PCC - Gamma Squeeze or another TrapShould this fail... Look out below for the Indicies.
They would challenge lows.
This would quickly to an Inverse Gamma Squeeze on
all Calls...
Put

PCC - Put call Ratio / Reliability has been a Solid Guide, accurate in the Extreme...
One exception remains the Higher end of the Range remains
open for a far Higher High.
Friday's Expiry was an excellent example of a PCC Squeeze
as rising from 1.1876 to 1.274 was an indication of Price having
a clear potential to run to close.
It did.
_________________________________________________________
Use it or lose it.
"Cheap" remains relative.

$CHPT up 32% in the last 7 Days will we see profit taking? No doubt chargepoint is a great company and is cheaper than last year. BUT we are still in a bear market, can we see some profit taking or will we see it continue to trend up. I believe we will see some red and profit taking and will come down just a bit before another run.

PCC - Squeeze ZoneWorks every time.
Looking for an RT.
Use the PCC.
Quit guessing.
Don't be a chump.

Expected Key Points Amazon 12 May 2022Amazon 12 May 2022
The current implied volatility is at 56.8%/year
So that converted into daily is 3.58%
The close of yesterday was 2107
So based on that our channel for today is going to be compressed within
TOP 2182
BOT 2032
with a probability chance of 80.5% based on the last 3007 candles
From fundamental point, today we have
PPI and initial jobless claims releases and these mark a huge volatility moment
At the same time the current values are expected to be bearish.

Weekly Prediction 9-13 May QQQ Iron CondorQQQ
9 - 13 May
The weekly VXN-> Volatility Index for S&P 100 index / Nasdaq
Implied = 37.4
In this we have to standard it for weekly session
37.4 / sqrt(52-> 52 weeks in a year) = 5.19%
My historical product is telling me with 1.5x coficient that the expected movement for this week
E Volatility = 38.02 / sqrt(52) = 5.27%
With this data, from my calculations, when EV > VIX, there were a 86.6% chance that the market
stay within the bottom and top created with the ranged from the E Vol
So for next week this range for us is going to be
TOP - 325.5
BOT - 293
Lets look into an iron condor oppotunity for trading:
325Call Sell - 328Call Buy
293Put sell - 290 Put buy
This is giving us at the current moment a 0.35 expectancy
So taking into account from 1109 weekly candles, that 86.6% of the times the market stay within our top/bot channel,
Our profit margin would be 86.4% * 0.35 - 13.6%*1 = 16.9ROI after 100 trades

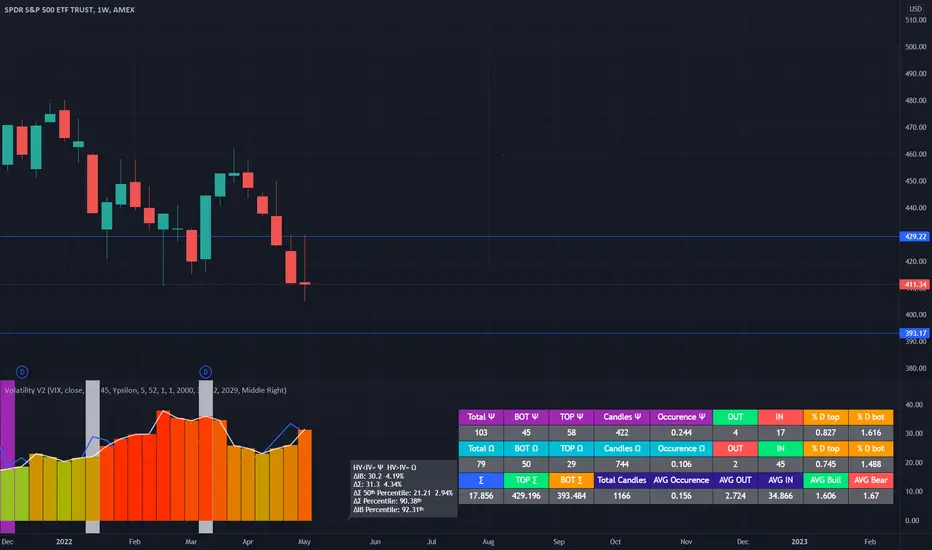
Weekly Prediction 9-13 May SPY Iron CondorSPY
9 - 13 May
The weekly VIX -> Volatility Index for S&P 500 index
VIX = 30.2
In this we have to standard it for weekly session
30.2 / sqrt(52-> 52 weeks in a year) = 4.19%
My historical product is telling me with 1.5x coficient that the expected movement for this week
E Volatility = 31.3 / sqrt(52) = 4.34%
With this data, from my calculations, when EV > VIX, there were a 90% chance that the market
stay within the bottom and top created with the ranged from the E Vol
So for next week this range for us is going to be
TOP - 429
BOT - 394
Lets look into an iron condor oppotunity for trading:
429Call Sell - 432Call Buy
394Put sell - 391 Put buy
This is giving us at the current moment a 0.32 expectancy
So taking into account from 1166 weekly candles, that 89% of the times the market stay within our top/bot channel,
Our profit margin would be 89.4% * 0.32 - 10.6%*1 = 18.6ROI after 100 trades
Weekly Prediction 9-13 May SPX/ES Iron CondorSPX
9 - 13 May
The weekly VIX -> Volatility Index for S&P 500 index
VIX = 30.2
In this we have to standard it for weekly session
30.2 / sqrt(52-> 52 weeks in a year) = 4.19%
My historical product is telling me with 1.5x coficient that the expected movement for this week
E Volatility = 31.69 / sqrt(52) = 4.39%
With this data, from my calculations, when EV > VIX, there were a 89% chance that the market
stay within the bottom and top created with the ranged from the E Vol
So for next week this range for us is going to be
TOP - 4305
BOT - 3942
Lets look into an iron condor oppotunity for trading:
4300Call Sell - 4325Call Buy
3950Put sell - 3925 Put buy
This is giving us at the current moment a 0.29 expectancy
So taking into account from 1166 weekly candles, that 89% of the times the market stay within our top/bot channel,
Our profit margin would be 89% * 0.29 - 11%*1 = 14.81 ROI after 100 trades

PCC - Tom Lee JinxNever underestimate the lunacy of former JPM Alumni
Tom Lee.
The Cathy Wood of C N B C - Tom simply needs to STFU.
In January, Tom was concerned about the Markets after
Mid-Year...
________________________________________________
Market Liquidity is evaporating.
Volatility is expanding.
The Algos have been very careful to press the Sellers on
spikes in the Put/Call Ratio for the CBOE.
_________________________________________________
Real Estate Ballon
Stock Market Bubble
Bond Market Beyond
So, VX intraday is used to keep everyone offsides and out
of the trades with extreme - wide-ranging swings.
Use the PCC to your advantage, it has worked quite well.
The range has been roughly 105 to 135 recently.
Trade safe and good luck.

Put Call - PCCCall buying is needed for the Gamma Squeeze.
Same junk, different month, same trade.
Kick em when they're up, kick when they're down.
_____________________________________________
Laundromat Thursday.

Short and Long Iron Condor SPX 05 May 2022We can estimate with a 84% confidence that the volatility for today is going to be below 1.65%
For this the market will stay within
TOP 4371
BOT 4230
At the same time We can estimate with a 86% confidence that the volatility for today is going move more than
0.4% based on the last 5658 Daily candles.
For this the market will stay above the
TOP 4306
BOT 4272
From the fundamental point of view, yesterday we had the release of the interest rates, so I believe currently
we are in a short relief moment, where we can have for some days/weeks a small bull trend
For today we have no big volatility news, so we cant expect big surprises.
From volume point, we can see that the point of concentration is around 4300-4285
Having said that we have 2 different ways of trading for today
IRON CONDOR for the first option, with the 4370sell 4400buy Call / 4230sell 4200buy Put
Reverse IRON CONDOR for the second option wiht 4305buy 4330sell Call/ 4275buy 4250sell PUT

Put / Call Ratio CBOEPCC can become more extreme, will it...
The one to watch for a Countertrend.
Many Sectors have broken or are @ 200 EMMs.
________________________________________
Many Weekly candles shower an acceleration of
Momentum last week.
Eventually, the squeeze arrives... from where...
TBD.


SHORT SPY - Resistance with Heavy VolumeYou can sell short S&P 500 ETFs like the S&P 500 Index (SPY). But this strategy can be risky, since losses on short positions in stocks, ETFs, or stock index futures are potentially unlimited, and may be subject to margin calls. However, there are times when a bearish bet against a benchmark stock index, such as the S&P 500, is appropriate. Buying Puts is one option, get it! also otm put calendar debit spreads may be worth watching.

Rising Wedge on BTC, Weakening RSI - ShortRising Wedge chart pattern on Bitcoin.
Bearish divergences.
Artificial intelligence short.

Eve & Adam Double Bottom confirmation on Costco ($COST)Earlier this month, Costco made confirmation of an Eve & Adam Double Bottom chart pattern as it began seeing daily closes above the mid range between lows. This pattern indicates a fairly high probability (about 88%) of a bullish reversal relative to the sell off which from the recent all-time high (571.49) achieved on December 29th, 2021.
Today, the price is within 10 points of the all-time high. I'll be looking over the coming weeks to see what happens next, and for possible positions. From here, I see one of two likely outcomes over the near term:
A) COST breaks out above the previous high and likely has a forcible move to the upside, or...
B) COST gets rejected from the current levels in the near term and has a pullback to somewhere around $520
In the case of A , I'll be looking to short either with a PUT spread, or potentially straight up long PUTs - which have a greater risk/reward but are enticing considering the macro picture of the broader market/economy as a whole. In the case of B , I'd shop for a long position with some kind of CALL spread.
The statistics indicate that track B has about a 2/3 chance of playing out. This could be even more advantageous because it could potentially offer both decent long and short opportunities over the next few months. We'll have to see where the chips fall.

SPY PRICE TARGET OF 431 - MARCH 3SPY is currently in a larger, but similar pattern to the one it completed about two weeks ago. It appears like a slanted W, and is caused by short sellers taking profit, but bulls not having enough momentum to create a higher high.
Just like the previous (yellow) pattern, price did complete a very slight higher high (0.5% both times) and should now reject. The On Balance Volume indicator is also showing the start of a down trend in volume, another possible sign.
I will be looking out for put opportunities tomorrow, March 3rd.

NVDA PRICE TARGET OF 232 - TOMORROW, MARCH 3NVDA slowly creeped up on Wednesday, March 2nd, with little volume (a sign of weak momentum) and closed the day with an impressive selloff - leaving price below the 15m 9ema.
NVDA has two options tomorrow the way I see it.
The first and most likely, is price drops to 232 and possibly even tests 226. This is will depend largely on the open tomorrow, and whether or not price stays below the 15m 9ema. This is backed by the the up trend being broken and the On Balance Volume indicator showing a steep decline.
The second and least likely, is price continues to creep up, retesting the upper trendline region of 250/252 - although I see it being very difficult for bulls to find the momentum to break through these strong resistances.
Of course, these analysis are becoming less reliable as the situation in Ukraine and Russia unfolds and updates.

BEARISH on QQQ todayI BOUGHT A PUT OPTION on #QQQ WITH A $349 STRIKE PRICE AND 3/4 EXPIRY...ALREADY IN THE MONEY... HERE'S WHY I ENTERED THE TRADE...
#QQQ opened higher than yesterday's market close. However, I believe this is a bull trap. Price is pushing against major trendline resistance and the stochastic indicator on 1HR and 4HR charts reflects QQQ in overbought territory.
My theory is that there is way too much bearish news in the marketplace for tech stocks to break resistance and go on a major run.
Do you agree or disagree? Let me know in the comments!

FEDEX PRICE TARGET 186 - END OF MARCHAfter potentially retesting 227, I see FEDEX approaching the bottom of this wedge (and a soft channel), and falling through - causing the price to reach 190/ 185 by the end of March or early April.

My Thoughts on Tommorow's Expiry17250-17260 is an important zone in nifty. Expected a small gap up opening or it can be even flat.as tommorow is expiry and if nifty breaches the levels downside in 2nd half then it is a sure shot fall of 50-60 points.

