Tesla Major Bubble?Tesla has absolutely exploded in value especially since March 2020, which we believe was the beginning of a massive equity bubble. Tesla began trading around $40-80 range for over 6-years.
The vehicles they produce now, they produced in 2017. The Tesla Battery and Tesla Solar Roof were all known back then as they are now. Tesla has not announced anything that should put their stock price at over $900. We know why the stock rallied to $1200, and that was solely the Fed.
Perhaps most shocking is Tesla's P/E ratio which is now over 100X their earnings. This is extreme, and it screams asset bubble. Not even Toyota which is the worlds largest car manufacturer which produces both electric and gasoline vehicles has a P/E of less than 10.
So where do we stand?
We see equities going into a bear market. The FOMC of 1-26-2022 confirmed this when the Fed announced they are continuing their plans for tapering, raising rates, and shrinking their balance sheet. This will adversely affect the stock market and bring equities below a 15% correction, into a bear market.
Key Factors
Buying Volume Weak
MACD Turning Bearish
P/E Ratio: Extremely Overvalued.
Fed Tapering, Raising Rates, and Shrinking Balance Sheet.
50MA is 1/3rd Current Value
100MA is $180 Range
With the biggest buying of equities calling it quits and essentially "selling" this is a stock that I would get out of the way, short but do not expect a continued rally.
Put

Trade idea on Walmart - WMTJust as an idea: Cash secured put on Walmart, with a strike price of $134 (delta 23) and an expiry of Feb. 18, 2022. Trade would to be closed on Feb. 16, 2022, 1 day before the quarterly results, which will be published on Feb. 17, 2022, before market opening. The $134-$135 area has successfully acted as support four times over 1 year. Whether it will do it another time is of course uncertain! The additional purchase of the cheaper put with strike price 115$ reduces the margin and creates a bull put spread. This trade idea is one of the 222 trade ideas from my book "The Stock Market Year 2022: Which stocks go up and when?"
Disclaimer:
This trade idea is for educational purposes only and does not constitute investment advice or a solicitation to buy or sell securities or financial instruments. Investment in securities and financial instruments (especially options) are generally associated with risks, up to total loss of the invested capital and above. I am not a financial advisor. Please do your own research and make your own decisions.

QQQ Put Credit Spread - 10% RoM As the title says, simple put credit spread, was enterred at noon today when we were green. THe position is currently being tested to the downside. I debated turning this into an IC as well just like the other trades from today, but I feel that QQQ would be the one to turn around the quickest and I do not want to end up in a scenario where my call side gets blown out.
500 BP used - 0.58 credit recieved.

TWTR Short!As you all know, TWTR has been in a pretty steep down trend for about the last 6 month. Nothing right now is really telling me a reversal is coming, especially with the way the entire market has been preforming in 2022. However, I don't like trading based off trends alone. So, I have identified a continuation pattern with the bearish rising wedge above. One of my favorite patterns to trade but remember the importance of setting entry, targets, and stop losses!!
Good luck!
Not advice, just speculation (:

DIA 305/300 Feb 18 Put Credit SpreadThis is an after the fact trade meaning that I made the trade today and it closed today as well. Unfortunately I did not have time to post at entry.
Entry: 0.50 Credit
Exit: 0.25 Debit
50% Profit in a day. Ill take it!

Nifty Options Important Levels Call And PutImportant level for 20/01/2022
buy CE Above the Buy line
Buy PE below the sell line
May open lower today

TLT Call Credit Spread 149/152 call credit spread - Filled for 0.36 - >10% Return on Margin
I believe that the 20 years will continue downwards with rate hikes. As such I have setup this call spread to take advantage of the downward move. This position was opened on Jan 11th but I just got around to posting. See blue vert line for entry date Candle.
Additional premium was collected due to selling on a up day, entry now can be had for a similar credit if not more.

XLE 55/53 Put Credit SpreadOpened for a 0.25 Credit
XLE is making a strong move upwards, this filled on the afternoon pullback. If this pulls back in the next few days I will add the call side to turn this into a IC. This will provide me delta neutrality and allow me to play the range from 55-60.

SPY looks bearish If price does not hold the box then as per my analysis and calculations and on Monday if I do see my favorite candles burning then $458 coming for sure.
Not bullish as if price even holds and goes up we have magnetic resistances at $470 & $472.
BEARISH

210/208 IWM Put Credit SpreadIWM is one of my favourites due to its range in the last year. I have played this range many times with credit spreads and Condors.
Trade setup:
Simple Put Credit Spread here opened for a 0.205 credit. Goal with these trades is to be a minimum of 10% RoM and no longer than 30 days.
Entry Criteria:
1. Red day, for increased premiums
2. Trading within a range (clear)
3. Short put is far enough away (see multiple support points lower)
4. Credit received meets RoM (Return on Margin) criteria.

Whispers from Options - BTCWe observe weakness/Bears dominating BTC market recently. Options Sentiment Indicator is giving mixed signals (overall we see bullish sentiment from Options traders but more volume is within PUT options still).
4 Virgin VPOCs are awaiting retest and are located above current price in comparison to 1 VPOC below current price - Bullish pressure
area of 46000 is major/key level, worth observing
from Options OrderBook of contracts expiring in 26 days (28th January 2022) - there are no strong resistance levels (!!) - Bullish pressure. However major support levels (a lot of CALL orders awaiting) are relatively low - 35,36 k
on H4 we see multiple Demand Signals coming from VSA Scanner software near 46 000 level

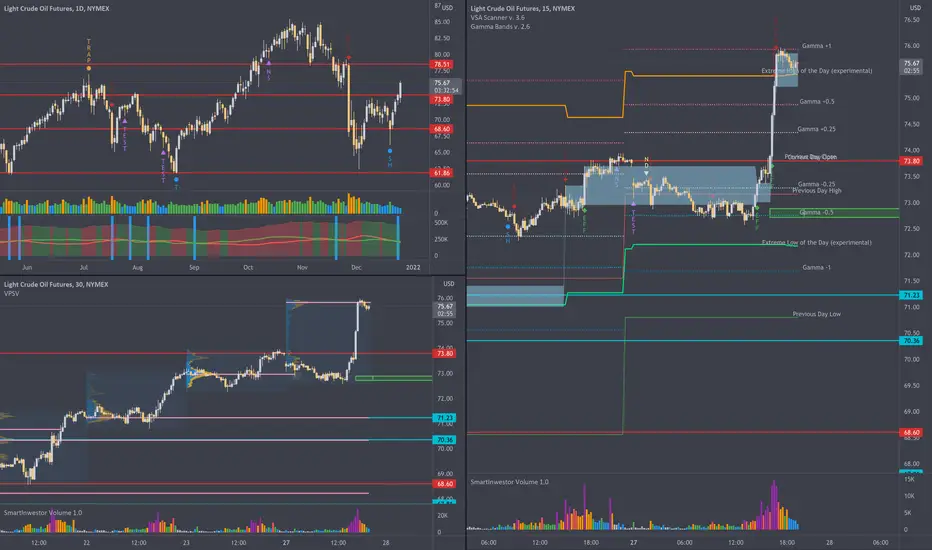
Strategy & Analysis with Options Tool suite kitToday I would like to introduce you all to process of analysis step by step instruments with usage of Options Toolkit Suite. I wrote in my earlier posts what edge can give us data obtained from Options Market. So now let's jump into details and have step-by-step detailed guide. Firstly we need chart layout split to 3, as on three different timeframes we will perform analysis and monitoring for potential trade opportunities.
Process follows:
All starts on D1 timeframe looking for key levels - where we can check Eagle-eye view perspective. Here most important is Options Flow Sentiment indicator (at the bottom) where we look for blue background - it means equal Volume on CALL and PUT options aka Balance on market is set. From those moments in time we take close of the candle/bar - and this is our significant S/R Level. If there is level too close to another one, I skip drawing it just not to make chart too noisy.
Continue on D1 timeframe checking Options flow Sentiment - also looking into sentiment indicator, I check firstly for green/red background. This is self-explanatory showing advantage of Bears or Bulls camps respectively. Then I am looking where is more money on Options flow put - if green line is above red line, it means volume of CALL Options is respectively bigger than PUT ones (aka Options traders put more money on Bullish move). In reverse works the situation for Bears, where red line is above green one.
Check for Virgin VPOCs on M30 - I am looking for untested next day VPOC levels. Those levels are always retested by market = working like a magnet. The only question is when it will happen. It's convenient to know if multiple levels are below/above current price level in order to know the balance/pressure on the market. Also for Intraday Trading, if price passes one of Gamma Levels near VPOC, we can try to trade a move with target on Virgin VPOC.
Mark Demand/Supply Zone on M30 - When we see multiple Bullish/Bearish candles in row so in other words strong impulse on market, I am looking where this move began. When I identify it, first reverse candle before this impulse sets range of Zone. Ok so jumping to example: in case of strong Bullish impulse, in the place where it started I am searching for last Bearish candle before start of this impulse. This candle's High and Low are marking range of the zone. After setting up zone, I am waiting for First Retest of this Zone . In case of Demand Zone (bullish impulse) I play in case of retest Long, in case of Supply Zone (bearish impulse), I play in case of retest Short. Very often we also can observe confluence, where within Zone or in close neighbourhood we will also have present one of Gamma levels. In case of Zone fail during 1st retest, this is also major signal but in direction of breakthrough zone.
Intraday Setups on M15 - Gamma Levels are marking key levels for observation. In general breaking through Gamma level is a signal for potential trade with target on next Gamma Level. Very rarely are passed levels Extreme Low and Extreme High of the Day which are setting typical maximum expected range of the day. Breakthrough Gamma -1/+1 is a signal of anomaly and typical for Trend Day. So if this level won't hold, then I play in direction of breakthrough. Another setup is bounce from Gamma -/+ 0.5 which is often very strong Intraday Level. In case of observed bounce back, target of the trade is Pivot (mid between Gamma -0.25 and +0.25).
Additional confluence factors - I am looking not for quantity, but for quality in case of trades - that's why I take opportunities which are having in common more factors aligned in direction of trade that I plan to take. Therefore when Gamma Level is passed and I have relatively close Virgin VPOC is one additional example. Another one would be Gamma level within or in close neighbourhood of Demand/Supply Zone. Last but not least - VSA Scanner Signals. When I see before Gamma level Demand (signals below candle/bar) or Supply (signals above candle/bar), it can add me additional confluence factor or sometimes push me to avoid taking this particular trade - when I expect Bullish move but I see instead Supply signals.
Stock is worth around 5In reality this stock is worth around 5 but it might not go that low. Probably we bounce now and continue the downtrend. Maybe i open a put spread later.

Apple should bounce tomorrow but there is weaknessIf you are long exit @175 or near that price point. Will see how price reacts when it enters the highlighted zone. We do have weakness on daily charts for sure. This $175 is just a zone to exit if you are long. I will not take a call or be long here as there is weakness on Daily TF

Options Data forecasting turning points and key levelsOptions are major weapon (if properly used) in toolset of Trader. Billions of dollars each day are floating on market and speculation here is an art. Art performed by Big Guys (aka Smart Money), where funds are often significantly higher in comparison to Futures Market. With help of Machine Learning algorithms, I load Options Flow data, parse and analyse it and extract to Quandl Dataset. From there, I load it via API to Tradingview and display results in indicators. And I trade with edge instruments from Futures Market.
This data doesn't need to be always used on Intraday timeframes. We can't forget about Big Picture aka Context. From D1 timeframe alongside with properly parsed Options Data, we're able to identify real key levels (not by using Price Action but by using Balance Points, where Volume of CALL options is equal to Volume of PUT options) - marked on DAX chart with red horizontal lines. Those are close prices of candles, on which indicator identified Balance Points (blue background on indicator). Demand always is trying to reach balance with Supply - therefore that's why it's even more important to observe such levels. I personally love to play retests of those levels and breakouts - especially when they happen after at least few days since initial Balance Point.
We can't forget about Pressure. Who is dominating at the market? This is the question that traders are asking themselves each session. Based on multiple factors, like: Put/Call Ratio, Strike Prices and Expirations of Options, Volume put on Options, Type of Options (ATM, ITM or OTM) - Machine Learning is allocating weigh ratio to those factors and return result identified on indicator by green/red area. Bigger Area show stronger Imbalance on market (aka one side dominates the market).
We have so many data around us, sorry - tons of data! We are unable to parse it and get insights manually. Here Machine Learning comes handy. I encourage you to deep dive into Options Market and combine it with picture, that Market draws you via chart. Market is based on emotions, so play what you see from moves of Big Players - which in majority believe me - are present on Options market.

$US30 chart analysis *This is not financial advice, so trade at your own risks*
*My team digs deep and finds stocks that are expected to perform well based off multiple confluences*
*Experienced traders understand the uphill battle in timing the market, so instead my team focuses mainly on risk management*
!! This chart analysis is for reference purposes only !!
If you want to see more, please like and follow us @SimplyShowMeTheMoney

Options flow are whispering on BTCThe Options Market can inform well in advance about movements that are yet to happen in futures contracts. Looking at the Options with an Exercise Date (expiry) in 22 days at the time of writing the analysis, the conclusions are quite loud and clear:
50,000 - Put Wall level, that is support with 2 times more capital than the other levels
60,000 - Call Wall level -> resistance
65,000 and 70,000 - successive resistance levels
We also see some Virgin VPOC points from the past, which only adds strength and confidence to the Bitcoin bullish prediction. All data and levels are based on BTC quotes from CME.
I am puzzled by a very large capital located at the level of 50k $ - someone really cares to defend this level at all costs. There is still time for it, so it's worth watching how the situation develops;)

?? back testing idea for learning spy making this weird pattern in the 4 hour time frame on this chart.
is it setting up for a pull back or will it break up over the 200 EMS (the white line)
waiting this week as its blackout week for the feds. next week pow sauce is on air and we will see where the market will go from there up or down
his words that he says needs to be very process to be bull or bearish.
?? lol lets see

INTU#INTU has been constantly trading in this upward channel, breaking above it recently and with an awesome earnings report skyrocketed based on the chart one can expect it run back down to within the channel or if it builds strong momentum it will be interesting to see if it can keep going however my money is on a short term PUT option. check out www.UnusualWhales.com for guidance on the flow to see where money is going.

Options flow predicting moves on Derivatives (Futures)Options have been and are an important instrument on the financial market for a trader trading Intraday Futures. Therefore, while exploring the mechanics of the option market over the last several months, as a result of work, indicators were created that load data from Quandl and then look for patterns that may herald a change of direction on the derivative market - in this case Futures Contracts. There are two main types of Options:
CALL - allow their owner to buy a given product in the future at a predetermined price (Strike Price)
PUT - allow you to sell this product at a predetermined price (Strike Price)
By observing the market volumes of both types of Options, we can observe the sentiment of investors. The key factors are which volume (call or put) prevail in the volume and the dynamics of the volume - what is the trend on volume, whether the difference between them increases or decreases. In addition, the Put / Call Ratio analysis allows you to confirm or negate the signals from the Option volume. The Ratio indicator behaves inversely to the price movement - in the case of a bearish sentiment, we expect the ratio to increase, and in the case of bullish sentiment - the indicator should decrease. If the Ratio follows the price in the same direction, it is an anomaly.
Of course, the mere observation of the Option volumes and the Put / Call ratio is not sufficient, as the Options Market is a much more complicated activity. It is worth including in the calculations such factors as Expiration Date, Bonus Amount, option type (In the Money, Out of Money or At the Money). Not each of the factors is equally important, therefore the key is additionally the appropriate selection of the weighting factors. For this purpose, due to the multitude of data, it is worth using Machine Learning, which I also do by saving the resulting data in a dataset in Quandl and displaying the data in TradingView using Pine Script.
Below are some additional examples from recent sessions on ES showing the predictive nature of the Option sentiment, often preceding major movements in the ES index (during the spot session):
First, from the left, the session from November 15 is shown and an opportunity to play Short. On the right, the session from November 16 and an opportunity to play the Long position this time.
Session from November 10, where we first got the Bull's signal, and at the top we got a warning signal of traffic reversal and the possibility of entering Short:
And one of my favorite moves on November 3:

Head and Shoulders on Desktop MetalI think it will head towards the 1.13 fib extension soon as the US Dollar and 10 Year Yield continues to rise.

Long/Short 🟢🔴 Ascending Wedge, Support/Resistance Lines Deep AI detected Ascending Wedge.
Ascending Wedge is a bearish pattern.
Its Target Price is the bottom white box.
However, the price has just hit support:
Machine-generated blue line.
Pseudo-quantum algorithms show possible upside.
See top white box, Target Price.
BTC might hit $70k before Support breaks.

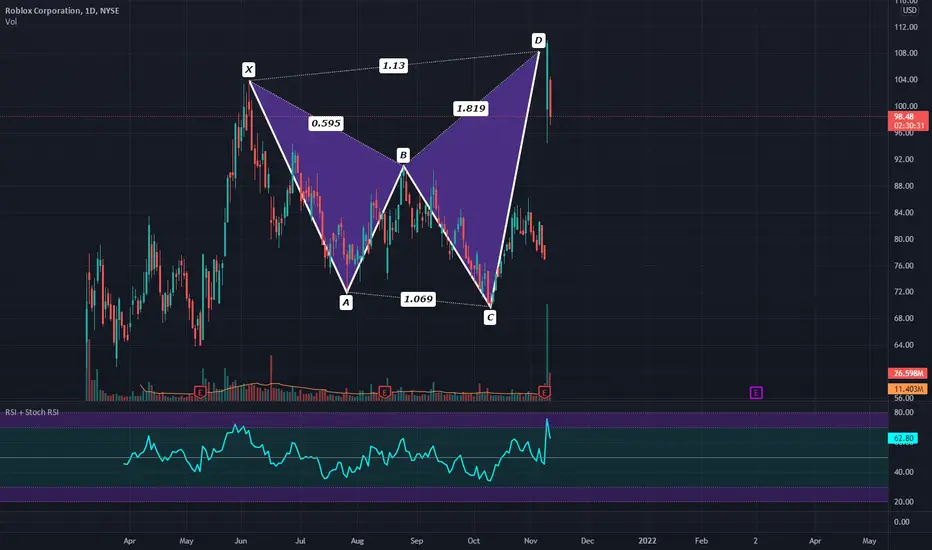
Huge Bearish Harami at a Shark PCZ if the Daily closes like thisNow may be a good time to buy some December puts near the $90 range.