THE FOSCHINI GROUP (TFG) DAILY TIMEFRAME SHORTThere is no magic crystal ball here. Whether you are on the daily timeframe or 4-hour, the stars are aligned baby! The price for this stock is moving in a clear range with the support at 15 760 and the resistance at 17 825. Now we can see a bearish candle start to form at the top, and a second closure of a bearish candle will likely be my trigger for the trade. A more conservative entry would be to enter when the third bearish candle moves halfway the length of the prior candle.
Put

CRON Bubble Popped: Fibonacci Retracement InitiatedThis sure looks familiar, doesn't it? CRON has a lot more going for it than TLRY, but we still lack justification for this recent rush up. Too high maaaan, it got too highhhh.
Notice the uptick in buying and selling volume here recently - this is typical in the end of a bubble cycle. Also notice the downward cypher pattern we are setup to form.
Bought a 50 delta, March 1st put on it - expecting to hold till around the $16 level. If you hop on the short train, be ready and be careful; this is about to be a wild ride.

Preparing for this weeks earnings! - DSWEarnings: Tuesday before open
Technical: Sell
Forecast: Expect a decline in earnings
In the last 20 days, it has done nothing but go down
Action: Buy a put

WDAY put saleBeen looking for a good pullback on this in order to sell some puts. Great earnings and growth company if I do get put shares.

AMZN down trendAMZN is currently down trend since October 2018. Resistance is at $1650 (100MA) and support is at $1600 (50MA). Since January 2019, 50MA has been touched 8 times so it's a very strong support. If it breaks support with strong volume then it could go to support trend line in 1 month.

USO-Option TradeAMEX:USO
Option: Put
Expiration: 18 APR 19
Strike: 11
Trade Goal: Double+
Entry: .45
Sell 3/4 @ 1.00
Current USO Position: Impulse Wave 5 (Down)
Fib Spiral:
Wave Count:
Will update.
-AB

FB-Option TradeFB
Rating: Strong Sell
Trades are first posted on FibMarketWatch.com
Dirty Facebook
Option Trade: Long Put
Expiration: 15 MAR 19
Strike: $165
Type: Put
Mark: $4.55
Entry: $4.40
Trade Goal: Double
Trade Time-frame: 5 Days
Trade Target: $150
Will update.
-AB

TWTR likes to fallnotice the 2 black channels , one going across , plenty room to drop , ,
the other down trend black channel also has room for it to drop more !
there is that one gap down there that has not filled
its below the channel and other gap that has filled
2 week out Put 31 put , 100 % to 200 % gain or stop loss 50%

Dividend Capture Strategy for easy cash flowDividend Capture strategy for easy cash flow on XOM
Exxon Mobil pays .82 per share quarterly and the ex-dividend date is this Friday (2/8/2019) the dividend pay date is on 3/11/19. So yearly Will get $3.28 (.82x4)for a dividend yield of 4.4% not bad.
But by selling the ATM Put for $1.02 I will increase the premium plus dividend paid for the year to $4.30 and increase the yield to 5.77%. That alone is an improvement of 31%.
If I don't get assigned I get to keep the premium and make over $500 in a couple of days and if I do get assigned then I will sell some calls to keep reducing my basis and improve my yield even more.
The Trade: XOM
Sold 5 ATM Puts @ 74.5 for $1.02
4 days to expiration


XSP Options short, Long putI'm conscious of how price has behaved around the highlighted pivot zone. This could be a good spot for strong rejection.
Momentum
indicators are showing a loss of momentum on low time-frames, and we have failed to break resistance for a couple of days.
Volume
We are now seeing a pronounced drop of buy volume visible on the daily and hourly charts which could indicate trend exhaustion is possible.
Time analysis: TD sequential on a green 7, unlikely to complete a full cycle, which could mean a slow and steady breakdown rather than a rapid selloff. This could mean
Momentum: MACD histogram is negative. RSI is constantly posting lower highs, and lower lows
overall sentiment on trend on lower timeframes is uncertain (previously bullish) and on longer timeframes remains bearish.


PKG ShortSPY breakdown leading to overall downtrend, PKG seems to have fizzled out of its ER catalyst cannot hold these levels I predict its going lower.
Strike $85 $2.4 Stop at 1.2
May go lower if spy continues

Short AMDI see a retest of 19.18 on the fib chart. The bottom bollinger band is showing 19.59 on the one hour chart. Right now, the bollinger bands are separating giving us a sign that it could drop. With the markets with high volitily, and the FED speaking Wednesday I would be careful how you play this one.
1. Target 19.59

FIT Put PossibilitiesTRADE TIMELINE 12/10 - 12/14
12/08 - POSSIBLE OPTION PLAY heavy watch
FIT 12/14 4.50 PUT dip buy 0.02 (0.04)
IV 74.38% Volume 384 Open Interest 333
----->"Throw a couple bucks at it" purely gamble play
This optionable stock moves like dry grass wildfires....
Why this play?
NOTE - Everything below the green diagonal boxed line is profit.
MACD - This indicator is opening south after a prior rejection
NEWS - Of course, sell the news, buy the rumors...and this case may be no less different, it will be a gamble play
RSI - hovering but moving south, indicating to me that this stock is not done selling off
EFI - Very stale movement, almost horizontal; not where this indicator wants to be
EMA - These 10 and 20 day EMAs have been rejected in the past, hard! (Sept 19-21) This pattern from the past tells me that history will repeat itself, especially since FITBIT has been trying hard to stay relevent and has been unable to do so (technology, competition, other brands establishing their footing in this space).
*Let's see what happens*
DISCLAIMER - I am not a professional trader. These are merely my thoughts and possible moves; i enjoy watching these stocks validate my process or slap me across the face lol. If you are in need of professional assistance with your trades, don't look here. I am not that guy.

Short Put on SPY 75% probability of profitAfter a Gap down, Sold the 254 put for $4 for a 75% probability of profit.
We make money as long as the price stays above 250. It needs to move another 6% down for us to start losing money.

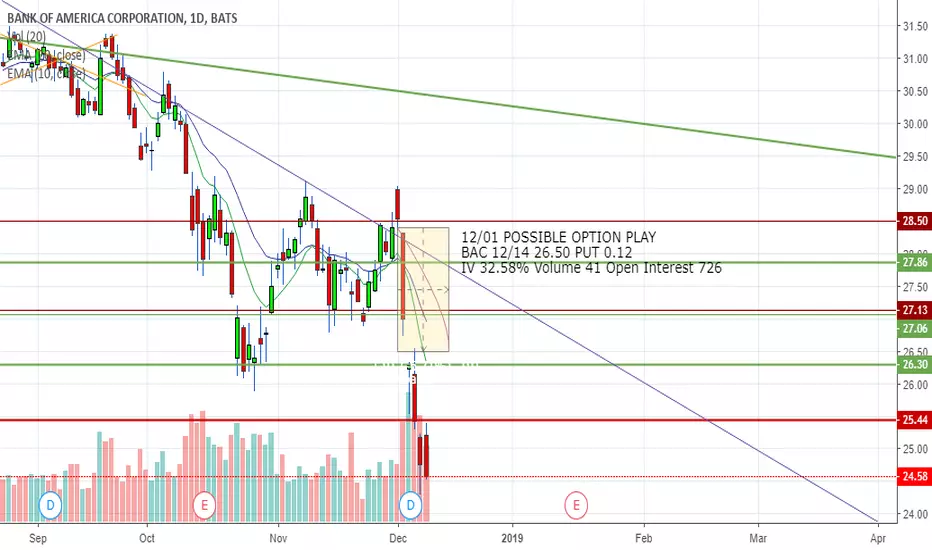
BAC i missed this put opportunity!!TRADE TIMELINE 12/01 - 12/14
I wanted to share this missed put play i charted. it was on my radar, i simply was looking elsewhere. Time to find another one.
12/01 POSSIBLE OPTION PLAY
BAC 12/14 26.50 PUT 0.12
IV 32.58% Volume 41 Open Interest 726
The market is giving away put money, and won't stop....
At the time of this publishing, 12/11/2018 2:55PM, this option is now worth 1.92 !!!!!
As we all know, $0.12 = $12.00 and $1.92 = $192
GE No Floor in SightTrade Timeframe - 12/10 - Jan 04
12/7 - POTENTIAL OPTIONS PLAY
GE 01/04 $6.00 PUT dip buy $0.06 ($0.15)
IV 71.58% Volume 99 Open Interest 202
Why?
Regarding the dip buy - There is opportunity to get this option at a discount due to mid-day movement and slight optimism as we saw nov 28 - dec 3, but then the option fell back into profit PUT levels. Idea is to "set it and forget it" for the dip buy. $6.45 is the next realistic floor. News also is negative in general.
MACD - Already crested north in the last several days, and is now on the verge to move south
EFI - Momentum has shifted dramatically, and its movement is turning south, showing pessimism
RSI - Although this is an oversold stock, there is nothing in the near future to hold up the RSI
EMA - There is nothing that shows a reversal, and resulting Volume is consistently in "Sell" mode
*Let's see what happens!*
*DISCLAIMER* - I am not a professional trader or stock broker. These are merely my thoughts typed out. If you need professional help with your trades, look elsewhere, not here. Good luck and happy trading.

SPY ( Put Spread )Whats up Traders -
Got a free options trade for YA - sure to please.
God speed - simple and too the point, explanation and details are on the chart.

#Twitter |$TWTR 's #ABCcorrection couldn't be ANYMORE OBVIOUS!#Twitter |$TWTR 's #ABCcorrection couldn't be ANYMORE OBVIOUS!

$ICC Put limit order placed. #ichimokukinkohyo #timetheory $ICC looks bearish here looking at the 1D and 240m time frames. PUT order placed. See chart for details.

NASDAQ: $PXS | #PyxisTankers is LITERALLY going to FUCKING TANK!NASDAQ: $PXS | #PyxisTankers is LITERALLY going to FUCKING TANK!

FIT and seemingly woes to come11/13 - POSSIBLE PLAY
FIT 11/16 $5.50 PUT 0.11 IV 87.61%
Volume 434 Open Interest 1,627
Add to this the lawsuit, may help push the PUT along
