Puts
How I made 1000 Percent in 1 RIDE Put AFTER the CloseIn this video, I try to explain how I bought a slightly out of the money put in RIDE for 3 cents, and then called my broker to manually exercise it, when bad news hit after the close.

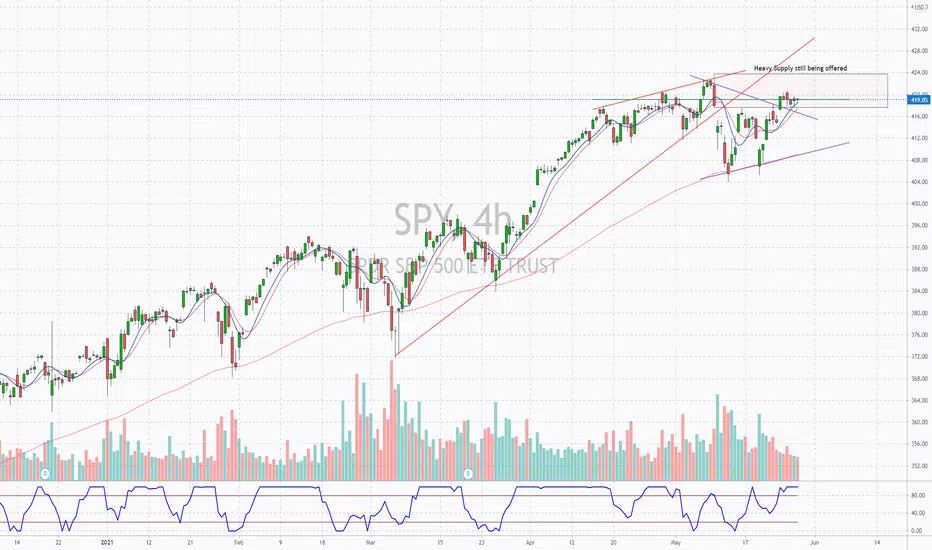
Bear case to $404 on $SPYClassic double top re attempt. Today was alow volume dead cat bounce. I expect for it to lose almost all green body by the bell. Opening up a shorts is a great idea. I like the 06/11 $416 Put here. Also lots bearish headlines over the weekend regarding China tickers and Feds facilities coming to a tail end.

SOS Descending Wedge Weak BreakNYSE:SOS
May be looking to catch shorts off guard. Otherwise this stock is one to avoid.

AMC to the MOOOOOOOOOO... Slaughter HouseJust kidding.. Possible ghost resistances ahead and a diverging Laguerre RSI... Enjoy the squeezes but be safe!
NYSE:AMC

NIKE Put Option Play - Ex-Dividend Expiration 5/28NYSE:NKE NIKE (NKE) Put Option Play - FRI 5/28
I hope you guys were able to capitalize on todays NKE Put option play. I had to wait it out but it did pay out a nicely.
OK, as many of you know, today 5/27 was the last day to buy NKE shares in order to qualify for Nike's dividend payment.
Those who were only holding for the dividend are able to sell tomorrow 5/28 and still receive their payment.
If you look thru NKE chart history you can clearly see a sell off directly after each qualifying date.
SNAP has ran up nicely ALL WEEK after being shorted/manipulated last week so that many CALL options would not cover.
I think with the potential inflation data looming over the market and it also being the end of the week, we are going to be seeing folks take some profits.
Tomorrow 5/28 the Personal Consumption Expenditures Price Index will be released.
This index is what is used by the FED as their preferred inflation measure.
If this shows that inflation is going higher than expected, it could cause the FED to act sooner and the market WILL react.
Taking into consideration these factors, I think it is likely we have a bearish day tomorrow.
Pay very close attention to futures and the 10-Yr bond yield tonight and before market open as this should give us a feel as to what type of day it will be.
Possible Option Play NYSE:NKE
Strike Price: $136-138 Put
Expiration Date: 5/28 or 6/4
Stop Loss: 40%
Notes: Watch price action & volume in pre-market. Make sure there is liquidity/open interest in the option.
This will be a quick in & out play as I'm anticipated a sharp gap/spike to the downside.
Open to all questions, critique and conversation. I'm a beginner and would love to know what you know and pick your brain.
Thanks for reading & happy trading tomorrow!
Disclaimer: This is not financial advice. These are just my ideas and notes on what I may do. NYSE:NKE


SPY at a Turning PointAMEX:SPY
SPY is at a critical level looking for guidance from the FED.
Could move very quickly from this level.
GME: Long Puts from 270-295Well here we go again, I am back to spin the roulette meal that is GameStop. Full disclaimer, I have gotten lucky on this ticker… and made money for all the wrong reasons. also lost money for… The right reasons?
Anyway, I will be playing this one again despite my hesitancy, as I feel a really incredible opportunity for an options play could present it self here soon. I will admit that I have doubted the game stop journey from day one, and genuinely did not believe we would ever see these prices again, yet here we are, and that presents an opportunity!
I’ll plan to buy OTM puts when if the price enters the zone on the chart (270 to 295). I really can’t give a tighter range because… Well this is GameStop after all, so my entry within that zone will really depend on the price action I am seeing. My strike will be around 195, expiration 04June2021 (cannot be totally sure so I will update if/when I open the position.
I was just my personal strategy, and not intended to be trading advice.
Good luck out there!
- Joe

Gap FillEarnings gapped the stock up and it turned right back around quickly. My portfolio is filled almost exclusively with long and neutral positions so it was nice to find a good short position to add but the problem is that I have already allocated all of my funds in other positions. With a small account I take a few extra risk to increase it more rapidly; one of these risks is that I allocate almost 100% of my account balance to active trades. If the markets decide to blow up my account then I am very vulnerable. I try to mitigate this risk by having a somewhat diverse array of long, short and neutral position on at all times but I haven't seen any short position that I really liked so this is a nice find for that reason.
This is just a 1 dollar gap so I wouldn't gain much from my typical deep in the money debit spread unless I thought it was going to fall much lower than my bottom trendline. So the way that I am going to set this trade up is to set up a in the money credit spread. If if it falls through the bottom trend line I make make profit, if it falls between the two lines I make money as long as its above my break even point, but the risk here is that if it doesn't drop in price enough to fall in the zone then all is lost; I'm good with that since I have defined my risk from the beginning of the trade with, in my opinion, is a kin to setting a stop loss in trades like this where the loss isn't much greater then the max profit.

Avoid Unprofitable Options ! - GME ExampleHello everyone, this is an example of how to detect unprofitable options BEFORE you take the trade , to better your chances.
We are all doing this (trading) for our own personal reasons, so we need to make sure we succeed.
I see many people want to SHORT GME, some other people suggest they buy PUT options on GME ---> This is a MISTAKE! Because those options are considered not probable to generate money.
In this example of GME (notice this is LOG CHART), you can buy a relative short-term put option for 41 days, but as you can see, to make 2 points of your risk you need the price to crash to a price of $50 within 41 days.
Why is it not profitable?
It costs 34.3, so you need the price to move down 34.3 dollars to be break-even, then another 34.3 dollars to 1 point of profit, and another 34.3 dollars to make 2 points of profits.
All this within 41 days... price could stay flat on a range of 160-255 and only then crash...
Assume that you fantasize about a 3 point profit on this PUT option, do you see the purple line? this is where the price needs to get so this fantasy will be true. HIGHLY UNLIKELY to happen.
So just avoid it!
Now, we will check the long-term option, maybe it gives us better results...
If we look at the long-term put option for 97 days, to make 2 points of profit you need the price to crash to 6!!!
So just avoid it!
It is fair to say though, that the longer-term put option, if someone thinks that a crash will happen testing the price of 45 within the next 3 months, he has a play of 1 to 1, that could be profitable.
But you can clearly see, that once you get that 1 to 1, you better snatch it and grab it because you are probably not going to get more $$$ from this trade.
Currently, the options on GME are not worth it (unprofitable), because the implied volatility is very high (150%+), they are very expensive.

SNAP $55 Puts 5/28 expSnap approaching a bit of a sell-off this off
Confirmation:
-Rejection off the 50 MA (red)
-Hit top off downward channel
Enter: $57.15

AMC Entertainment - Overbought - No PROFITS - ONLY HOPIUMBuyer Beware..... Go look at long term $GPRO chart. #stonks & #crypto #pogs #houseofcards #currencywars #poof


XLU Flagging Out or Channeling DownAMEX:XLU
We are closing above the volume weighted moving average. More upside to come.

AMD PUTS - TRADE OF THE YEAR IF IT BREAKS 300% GAINERGuys,
If this breaks under this is a MASSIVE gainer on PUTS. Massive. Not only will it full fil the trend bounce at $60 and the possibly descending broadening wedge which overall tends to be bullish with big break upside. It gives you the possibility to not only be short but confidentially swap short to long at $60.
MASSIVE PLAY HERE.
ONLY WORTH TRADING IF IT BREAKS UNDER THE HEAD AND SHOULDERS.

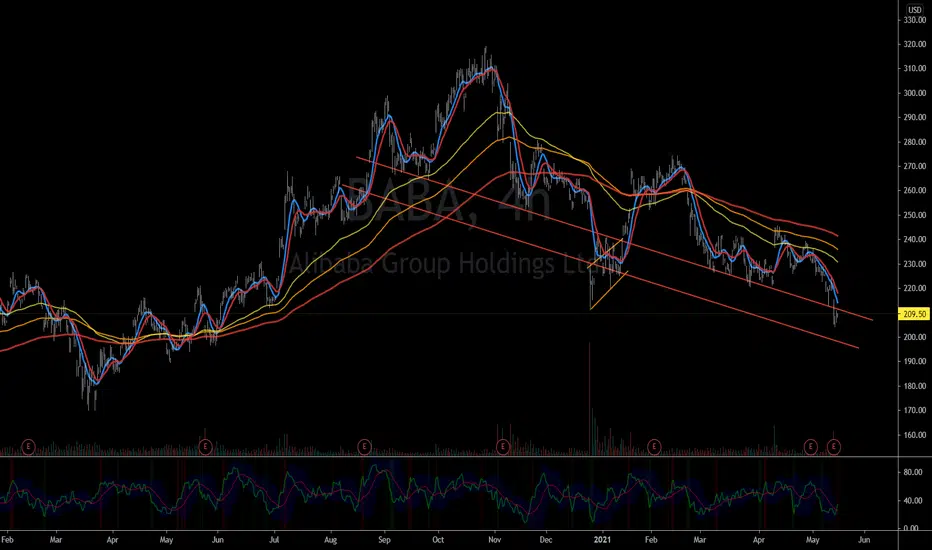
BABA Don't Preach, I'm In Trouble Deep!NYSE:BABA
Watching to fill this channel. Doesn't seem like it would be too difficult.
Riding the Red Slide!NYSE:STNG
Bought puts at the very top on May 4th right when markets opened. Sold them today with some nice gains.
Rode the puts for 7.5% (The stock dipped 7.5% - about $1.60)
I was tipped off about this stock by stocksoptionschanel.com - they publish daily articles about unusual options activity.
>Homepage --> "Articles" --> Notable Options Activity Articles
I sort through their articles and find different options that stick out to me. From there I hop on Tradingview and run charts on each stock that interested me - I make a note of it, wake up the following morning, right when markets open, and place my orders. So far its been working great for me.
Let me know if this helps you, I would love some feedback/dialogue
Godspeed

NVDA SHORT TO $575Perfect short opportunity for NVDA!
Seems like its been following this downward channel on the daily and 3hr. RSI is also falling after a huge run that happened this month... time to load up them puts!
My PT is going to be the bottom of the trendline support which brings us to ~575.25
This PT is also conveniently placed in 1D Demand zone where I expect NVDA to be bought up a lot and use this area as support!
My position:
5/21- 600p, 6/18-580p
STOP LOSS: Break above 622, makes play invalid

Summer Vacation Broke the Bank?Notice how just about every mid-June, Netflix takes a dip. Could this be a good option play?

PTON 7-Month Head and Shoulders Pattern FormationI have been monitoring PTON for a little while now and recently bought some puts on the stock. There is a massive Head and Shoulders pattern that has been formed over the course of 7+ months, starting in late September 2020. This stock was looking bearish when I opened the puts, as can be seen with the MACD crossover and many other indicators. The H&S chart pattern and the sell signals from a multitude of indicators coupled with the recent concerns about the safety of Peloton treadmills provides a golden opportunity for investors looking to make some money on the strong downtrend that this stock will potentially experience.
Currently, I am waiting for the breakout below the neckline for confirmation of the H&S pattern to open some more put positions. I will update this idea with more information as price action continues to flow.
Please like this idea if it was helpful and let me know how I can improve my ideas! I am always looking to better my techniques and analytical skills, so I welcome any constructive criticism. I will be posting many more ideas in the future, so consider following if you would like to see them. Happy trading, everyone!

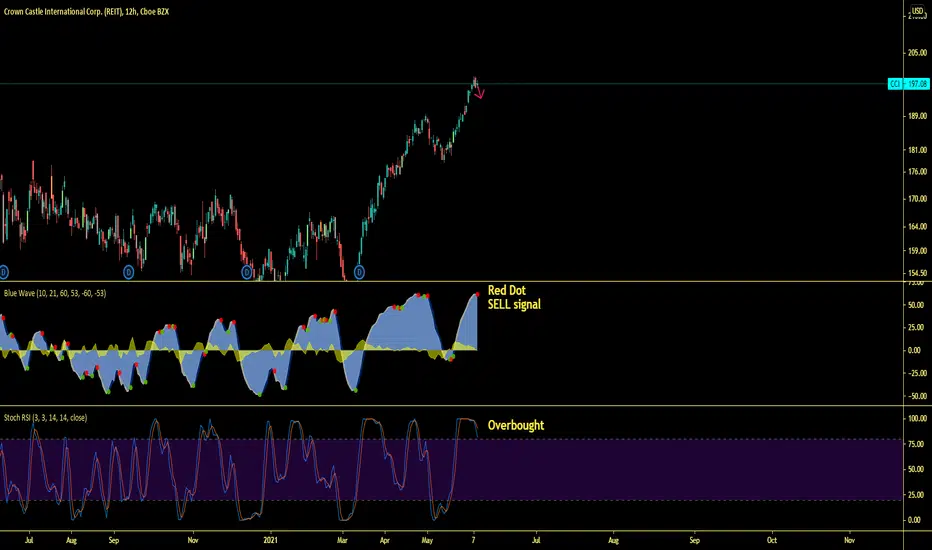
SPY Unusual Activity $6M puts purchased after market close.Continuous 11 Green days for the SPY has placed spy in a Very Extended territory and it is looks ready to let out some steam.
Stochastics are crossing over. We also have a gap to fill down and retest 20 day SMA.
AMEX:SPY Targets 1-2 weeks out $400.70
Consider $405 Puts April 19th
Unusual options activity spotted.
Big puts order flow after market close. About $6M approx. 10,000 contracts @ 5.75 above OI 7,240 June 18th $391 strikes.
Follow more unusual activity signup using my referral link marketaction.live .
Please comment below your thoughts and your personal target's for SPY into next week.

SOS | Don't Invest in the Hype!NYSE:SOS
Be wary of the social hype.
The multi time frame RSI on the lower panel is shouting caution in the wind.
