Analyzing a complex GME Put StrategyThis is a high level breakdown of a complex options strategy featured on financial television this last Wednesday. When I first saw the strategy I was intrigued and decided to put it through analysis tools to understand it for myself. I wanted to share this so that others can learn.
Puts

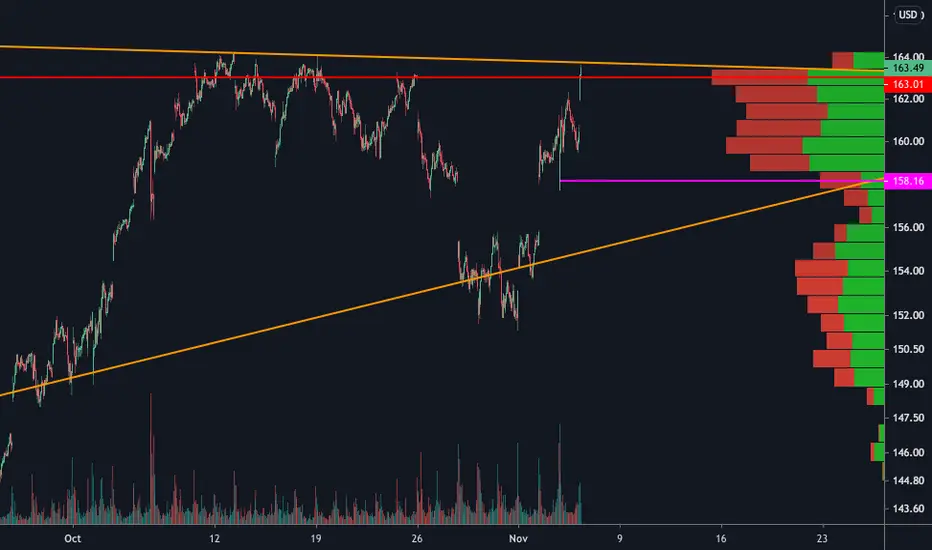
GE Short before LongI have price testing the resistance zone which is going on now. I can see price dipping down $10.63 - $10.99 which is a support zone to then testing $11.60 and up. For this company, it seems as if price always tests a resistance before dipping. We might be on pattern. I dont expect nothing crazy like Gamestop but get in where you fit in! Two opportunities coming up at market entry!
Let me know what you think!


BANC put credit16/14 put credit on BANC for 2/19/21 looking for .35. Swing for a couple weeks off good earnings. Watch movement Monday and breaking 16.50 support.

ROKU Ready to DropROKU has been moving within this ascending
channel recently, if it bounces off the bottom,
I would do nothing more than day trade long
positions asI am bearish on this one. The
20SMA is about ready to fall under the 50SMA,
with a hidden bearish divergence shown
with the RSI making lower lows. With IV
rising, it could be prime for puts under 407.

TGT ChannelTGT is currently at the top of the channel, with retail numbers recently coming out negative and all technicals pointing to a top, this red candlestick could mark the beginning of the reversal on TGT. IV is low, Puts could work, aiming for 180s by February.

Stay safe my friends! Bearish Gartley on the #SPX 1D #ShortNobody likes when they bears come out, unless youre short of course. Proper Bearish gartley printed on SPX, bearish divergence on the MACD, choppy waters ahead my friends. Be safe.

Short Selling Put OptionsI’m Markus Heitkoetter and I’ve been an active trader for over 20 years.
I often see people who start trading and expect their accounts to explode, based on promises and hype they see in ads and e-mails.
They start trading and realize it doesn’t work this way.
The purpose of these articles is to show you the trading strategies and tools that I personally use to trade my own account so that you can grow your own account systematically. Real money…real trades.
Short Selling Put Options
When short selling put options, a question people ask me is,
“Okay, Markus, how do you decide what strike price do you want to sell and whether there’s enough premium in there?”
I made a put options calculator called “The Wheel Calculator” that I gave away as part of my recent class on selling put options (Theta Kings) that helps me determine just that.
This calculator is now also integrated within The PowerX Optimizer Software as well.
Using my put options calculator, I can enter a few different figures and it quickly lets me know if this stock makes sense to sell put options on.
I started a small account with $25,380, and have continued to grow it substantially.
This was all done by selling put premium using my handy put options calculator!
So let’s take a look at a few examples using the airlines.
Here’s how you can quickly compare if an option makes sense to sell.
So United Airlines UAL , at the time of this is trading at $31.08/share.
So I’m going to take a look at the April 24th expiration and the $20 strike price.
I’m thinking maybe it would be a good idea to sell the $20 United Airlines UAL put option.
So now that I have the strike selected that I would like to sell put options on, let’s take a look at the premium these options have. This will let us know if this trade actually makes sense.
Right now, the Bid/Ask is $0.74 over $0.87. So I probably can get $0.80 for selling this option. This is all I need to enter in my spreadsheet, along with the expiration.
With the needed inputs entered into my handy dandy put options calculator it tells me,
“United Airlines can drop 36% and you’ll still be okay.”
It has to drop 36% before we get in trouble. I think that’s pretty good odds in my opinion.
The cool thing is that it also says that based on my account size, I should buy 17 options, and I would collect $1,320 in premium.
So this means that per day I would get $110 in premium. That’s not bad at all if I can make $100 on just one position.
And I like to have 4 to 5 positions in my account at any given time.
So based on the number of positions I like to have, this means that you can make $400 to $500 per day collecting premium. I like this a lot because it means annualized I would make 87%!
87% is nothing to sneeze at, right?
Short Selling Put Options — American Airlines
So now let’s do this same thing with another airline, American Airlines AAL , and see how the numbers look.
So like we did with UAL , I’m looking at what strike price in relation to where AAL is trading would it make sense to sell.
For American Airlines AAL it looks like probably the $8 strike price would make sense right here.
You always want to do it below the previously established low. So let’s take a look at American Airlines AAL .
The price right now is $12.26. the options strike price, we said we’d probably have to look at is $8.
Here we’re able to collect $0.35 per contract at the $8 strike price.
And you see, I could actually, since American Airlines is so cheap, buy 41 options based on my account size.
So 41 options and I would collect $1,444 in premium. This means I would get $120. That’s not bad at all.
And you see, American Airlines AAL also can drop 35% and we would still be OK. We only get in trouble if American Airlines over the next 15 days drops more than 35%.
Possible?
Yes. This is why you should always be willing to own the stock.
And this is why you want to make sure that you’re not getting in trouble. You need to adjust your position size based on your account.
Here obviously, I don’t want to trade two airlines because if airlines are crashing, they probably all do. With that said, let’s take a look at Boeing AAL .
Boeing Example
I like trading Boeing. I'm looking at a Boeing AAL chart to see where might be a good level here to sell Boeing.
Based on where AAL is trading at right now, it looks like $100 would be a good level to take a look at.
Let’s first try a strike price of $100, shall we? For $100 we get probably a $1.55 right here, with Boeing AAL trading right now at $150.
So if we were to sell the $100 put option on AAL , we are looking to make $1.55/contract.
And you see, this means that Boeing AAL could drop 33%, so we’re good here.
However, we can only buy three options.
Why?
Because Boeing AAL is really expensive.
So if we would have to buy Boeing at $100, this is when it gets expensive, right?
So you see, the strike prices here are much, much, much lower.
This is where you see I would only trade three not to overextend myself.
And that’s very important when you’re selling puts. You want to make sure that you’re not overextending yourself because otherwise, you’ll get margin calls.
Margin calls are ugly. A margin call means that your broker tells you,
“I want more money.”
You want to avoid that at all costs!
Because if you don’t have the money, you would have to sell the stock at a price that you don’t want.
Usually, this is how you can wipe out an account.
Anyhow, you see this is how we would only make $43 a day.
Let me ask you, what would you rather make? $110 to $120 per day? Or $43 per day?
I don’t know about you, but for me, these are better.
So it’s very easy to quickly compare which options you should be trading when you’re selling puts.
One of my favorite trading strategies right now is selling puts.
This is what you have seen in the past few examples.
My goal is to make $400 to $500 per day by doing so.
The best days to sell puts is on a down day.
On a down day, the VIX is usually shooting up and options premiums are higher.
This is exactly what you’re looking for as a premium seller.
For experienced options traders, selling put option premium in an environment like this can be a great way to consistently generate income, even if the stock doesn’t do exactly what you want.
I hope this helps!

$UPWK Last Bull Run before Bearish Divergence
$UPWK has been climbing steadily but the RSI and MACD are showing a Bearish Divergence Set Up
Even If the stock is a good value play - there is always room for capturing the volatility for profit

AMD Forming Head and ShouldersAMD forming Head and Shoulders.
Watch AMD build over the next week to hit a resistance at 94-95 range
Due to weak RSI momentum, an expected reversal back down to support level at 90.

Breadown of a descending triangle with gap to fill.Looking at a bearish descending triangle that broke below the support line on Thursday. Could potentially buy puts here and target the gap fill. If youre ballsy you can target the measured move from the height of the triangle downward. Not financial advice.

Will you miss the next market crash?No. You'll see it.
There is no need to start loading up on AMEX:SPY Puts every time the market has a down day. The market will reveal itself with price action if your are patient and contrarian. There will be opportunity to profit from a real bear market move with lower risk and higher probability than trying to catch the top. Corrections and crashes only come around rarely but there is a simple way to trade them...

$HD on strong supportHD is now at very strong support. I'll be watching it for a reversal for calls or a break of support for puts.

SPY BREAK OUT ON EITHER SIDE FED SPEECH TMM YOU ALREADY KNOW WHAT THE FUCK TOMORROW AND WEDNESDAY IS. SPY POOOOOOOOOOOOOOOOOTSS GO BRRRRRRRRRRRRR OR SPY CAAAAAAALLLLLLLSSSS GO BRRRRRRRRRRRRRRRR. EITHER WAY YOU HAVE TO BE FUCKING READY, CHECK OUT MY LEVELS THEY GO BRRRRRR.

BA Puts Opportunity$200 PUTS ON A BREAK BELOW $212.95
Next support at 0.618 Fib level, looks very weak. If we break below that uptrend, then puts will PRINT! Set your alerts for "Price Below $213"

Cash Secured vs Naked PutsI’m Markus Heitkoetter and I’ve been an active trader for over 20 years. I often see people who start trading and expect their accounts to explode, based on promises and hype they see in ads and e-mails.
They start trading and realize it doesn’t work this way.
The purpose of these articles is to show you the trading strategies and tools that I personally use to trade my own account so that you can grow your own account systematically.
Real money…real trades.
Cash Secured vs Naked Puts
What I want to talk about right now is the difference between cash secured vs naked puts.
If you've been following Coffee with Markus, then you know that recently there was a comment from someone who said
“They are the same thing!”
Of course, that is not the case.
So in this article, I’ll show you the differences between cash secured vs naked puts.
I’ll also explain why I highly recommend that you trade cash secured puts when trading the Wheel strategy.
Selling A Put Option
When you sell a put option it means that you have to buy the stock at the strike price that you sold it for if the contract is exercised at expiration.
This is very important, and you are obligated to do it.
So, therefore, obviously what you want is that the stock stays above the strike price that you chose.
Because in this case, you just keep the premium.
Now, let me give you a very, very specific example here.
Put Example: IBM
So recently, I sold a 115 put on IBM .
I did this with three days to expiration and I received a premium of $43 per option that I traded.
Now, I traded two options, or two contracts. So this means that I received $86 in premium.
If you divide this by three days, this means that we are looking at approximately $29 per day in premium, which is what I’m looking for.
I mean, this is how I have achieved the very systematic results here of 22.7% over the last three months, and if I can keep this up, this would translate into 19.8% per year.
So thus far, what does it have to do with cash secured or naked puts here?
In this example, as long as IBM stays above 115 until expiration, I would just keep the $86 in premium and the option expires worthless.
However, if IBM would close below 115 at expiration, then I have to buy 100 shares of IBM at a price of $115.
So in my case, since I have sold two options, I would have to buy 200 shares of IBM at $115.
This means that I would have to bring $23,000 to the table.
But here’s the deal. In order to sell these puts, my broker only required around $4,400.
Let’s take a look at this.
See IBM here, it says capital required $4,453. That’s only 20% of the money that I actually need to buy the shares.
The Differences Between Cash Secured vs Naked Puts
Now let’s talk about the difference between cash-secured puts and naked puts.
Cash secured puts mean that you have $23,000 in your account to cover the stocks if you are getting assigned.
So if you only had $5,000 in your account, you could still place the trade.
As you can see, the broker only required $4,453.
However, you wouldn’t have enough money to actually buy the shares if you got assigned.
This means that you sold the naked puts. You just don’t have enough money. You just had enough money for the broker, what he required to sell it.
So why would the broker let me sell the puts for only $4,400 when I need $23,000 to buy the shares if I get assigned?
Well, here is why the broker does it. He does it for two reasons.
Reason number one, most options expire worthless.
And number two, even if they don’t expire worthless most traders buy the option back.
So they close it before they expire and the broker knows that.
That’s why he’s only requesting 1/5 of the buying power that you need for buying the shares. And that’s all good as long as you close your position before expiration.
However, when trading the Wheel, you actually want to get assigned. It is part of the strategy.
You see, we not only sell a put option, if we get assigned we will sell calls and get the premium.
So the question now is…
What Happens If You Don’t Have Enough Money And You Get Assigned?
Let’s say you have $5,000 in your account and you entered this trade.
Now IBM is below 115 at expiration and you have to buy 200 shares at $115, but you don’t have the money.
So what happens?
Well, now your broker is buying them for you and you get a so-called ‘margin call’.
What does it mean?
A margin call basically means the broker asks you to wire the remaining $19,000 that you need for this into the account, and he wants to have this pretty much that day.
What happens if you don’t have the money?
If you don’t do this, the broker will sell the shares the next day at whatever price he can get.
So this means that you lose all control over this trade. Your broker is now in control and that’s not good.
You see, when trading the Wheel strategy you want to remain in control. After we get assigned the shares, we want to sell calls against it and collect even more premium.
Summary
I highly recommend that you trade cash-secured puts so that you have enough money in the account in case you get assigned.
This way, you have full control over your shares and you can actually make money with them.
Now you know the difference between cash-secured puts vs naked puts and you know when to use what.


UNH - United Healthcare Overpriced?United Healthcare is trading between the upper Bollinger bands and upper Keltner channel bands and it couldn't be at a better time. The topic of the affordable care act is now making headlines as Republican-led states and the Trump administration voice their case to the Supreme Courts today, claiming that the Affordable Care Act Mandate is unconstitutional. While the outcome of this case is still pending and may not have an impact on the stock, United Healthcare has been known to react whenever there is a potential change in how Americans receive healthcare. Today, President elect Joe Biden made a speech in favor of keeping and protecting the affordable care act. Let's see if any of these recent events surrounding the affordable care act have an effect on United Healthcare's stock over the next few days.
Just looking at the charts, my opinion is that the stock is overpriced. The stock is trading higher relative to the exponential moving average on the chart. So, any news related to the Affordable Care Act supreme court case could encourage a sell off.
REMEMBER: Reference to specific securities should not be construed as a recommendation to buy, sell or hold that security. Specific securities are mentioned for educational and informational purposes only. YouCanTrade is an online media publication service which provides investment educational content, ideas and demonstrations, and does not provide investment or trading advice, research or recommendations.

SPY - Bearish VibesHey Traders, I usually don't like going against the grain... especially when the SPY has gained nearly 30 points this week alone. But my trader's intuition is telling me that it's moving too fast and I am starting to get bearish vibes. Taking a look the chart above, you can see that as of today, the SPY has moved across the Keltner Channelin a matter of 4 trading days. Looking at the past three times the SPY crossed across the Keltner Channel, it took an average of about 14 trading days, or roughly 3 weeks. Based on where SPY is trading today, my opinion is that SPY will attempt to break out above its recent resistance level of 354.00... but I don't think it will. SPY has over extended past its moving averages by so much that I think it will regress towards the 8 EMA. The stock market is pumped due to the election...but once the count is over... I think the bulls will be taking profits and selling the news.
Again, this is just my intuition and I could be wrong, but I am going to stick to my guns and flag this idea with a Short bias.

PUT/CALL RATIO EQUITY MARKET WARNING SIGNALHello,
Here I've analyzed the PCCE (Put/Call Ratio Equities) in the monthly time frame.
Something extremely concerning is taking place for the coming months. We are close to hitting .45 on the put/call ratio which is in extremely overbought territory. What this means is when we are in this level, all of the buying power in the market is already in the market. We need to blow off steam before we can continue higher. Typically we can expect extreme volatility in the coming months after the ratio gets to this level. I've marked out historic times where price got to this level to add clarity to the chart.
We've already sold off 10% in September when we almost touched. Now we are lower and can possibly touch .45 this month, if that does. Cash may gain value.
USI:PCCE

AMD Major Bear Swing Target $55 AMD one of the best performers of the year hit a 2.272 fib extension on the monthly previous swing in '06-'08
Bearish divergence formed at that extension perfectly on multiple time frames Weekly, Daily and 4 hr.
Could have a head and shoulders top/into a descending triangle possibly with a measured move of around $ 59-53
Fuck ur calls bruh not financial advice these are just my thoughts
