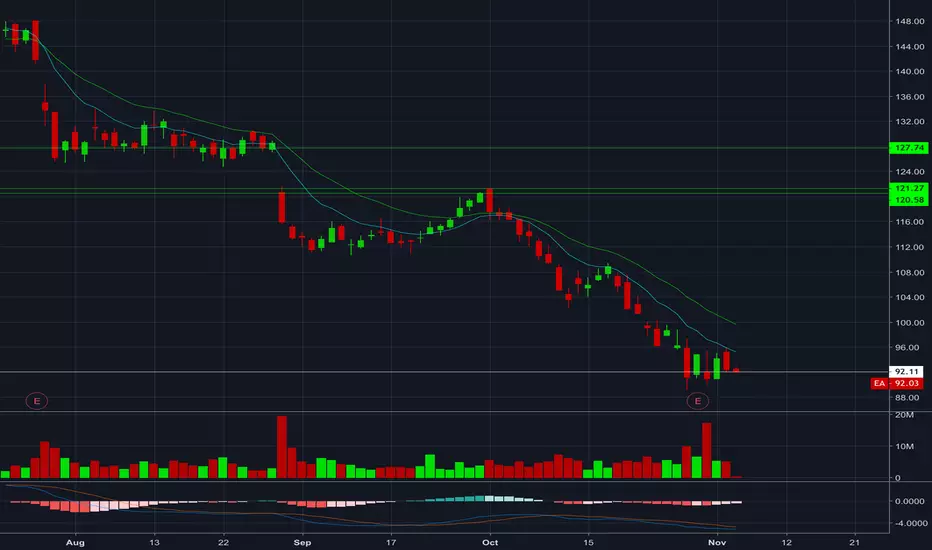
EA; get your head in the gameEA like many others, is lining up for a much larger pullback. We will watch 92.11 to act as support and if this fails we will expect a gap further down to test support 77.22. Great entries before this gap down team. Don't miss out on this profit.
Puts
Facebook having a hard timeWatching for the bearish movement to continue on FB as the market continues downwards. The weak close and movement of the market allowing much insight into this. We will watch the key level of 150.75 for entry after rejection on Monday. We can watch for more stable movement as a bottom presents itself around 113.54 however with movements of this size we would expect additional panic and selling which could easily result in movement far greater than this (ei SQ )
If there's any interest in understanding the market or learning to capitalize on these lucrative opportunities feel free to contact me for more info.

BA lagging as a bear; it's time will comeBA has been moving surprisingly strong (lagging bullish as most of the market has been bearish) and we will watch the key level of 352.07 expecting a larger move downwards(bearish) below this point.

Netflix Leading the charge downwardsNFLX like many of these setups, there's plenty of room to come down. NFLX appears to be ahead of the game as it's pushed it's lower high earlier than most and could help lead the charge downwards. Key level 318 will be watched for possible recovery above however we are more than likely expecting the bears to take charge below 269.21

Facebook pullback to continueWith the bear market looming and a weak close overall on Friday, I will be watching for FB to continue to pullback as this descending wedge confirms in the coming week. The key level we are watching here is the 150.75.

Bear move coming for NFLX, 26% drop by FebI'm actually long on NFLX stock but I think it'll drop over the next quarter. Overvalued compared to the other streaming services but lots of original content and a huge expected increase in subscriptions to streaming services over the long term.
This chart is based on a monthly consolidation but I am showing the weekly candle to show that my last 5 forecasts with NFLX all hit their targets, although they were shorter term targets.

Ponzi Tuesday strikes again...Get your FD putsWell well well...another gap..another call for FD puts...this is too predictable...notice how the correction didn't gap down at ALL and now when we move up we start making gaps again??
Sounds like PONZI to me. I'm not saying we going to SPY 270 or anything...just gotta fill this gap. Also today has been ultra-low volume pumping.

Puts on/Short XOM Into EarningsChart scale is normal and candles are three day
XOM has been in a massive triangle formation pattern for years now and just this week it looked like it was about to break out to the upside, before it ultimately failed and the market rejected the breakout. XOM has been one of the weaker stocks in the energy sector and with higher interest rates, falling oil prices and rising steel costs, the energy sector has three major headwinds against it for the short term at least. My inclination is to buy some at the money puts expiring the week earnings are released. It is possible but I doubt XOM will go down all the way to the lower bound trendline of the triangle before earnings, so the day before earnings are released you can either close the trade, roll it down (and out) or turn it into a put spread by selling a downside put to take advantage of the heightened implied volatility, depending on your convictions on how XOM will react to the earnings release of course.

$JD - JD.com $10M Bearish Bet$JD - JD.com saw a big $10M+ bearish bet today via the Jan'19 $70 Puts (very deep in the money - current stock price ~25.50) with 2,400 contracts purchased for ~$4,400 per contract.
The chart supports the bearish prediction with the price having been respecting the 50d ema for the majority of the summer on the 2H chart.
Medium term target - $23.00-23.50 area by mid-October (long term support levels)


$Snap snaps furtherSnap continues on its down trend despite what looked like a second wind last week. Look for break of $8.90 resistance on hourly chart to send this further down. $9.56 will constitute a firm reversal.

TWTR - TwitterTwitter cratered a bit after earnings, so taking advantage of the IV spike.
-1 Sep21 $33/38/39 Jade Lizard for $1.63. No upside risk on this play (will make $63 if expires over $39), $31.37 downside breakeven.
Risk: 2x cr received or continue to roll the put out.
Profit: 50% cr received

Netflix's epic run is over: SHORTWhenever an asset grows at an exponential rate, that is a red flag that a major correction is imminent. Netflix has seen unbelievable growth (along with the other FAANG's) in the past year, and signs are now showing that correction time has begun. Last week, Netflix reported earnings and user expansion slightly lower than the sky high expectations 'analysts' had created for their quarterly report, and the stock fell over 14%. That is a very bad sign. Yes, it recovered extremely strong the next trading day, but fell back to the original 14% decline in the days following.
The chart also shows signs that a correction is in store. Bearish divergence, even before the earnings report, showed weakening strength as the RSI fell and the price double topped around the $420 region. MACD has crossed over issuing a 'sell' signal, and is extremely high, increasing the possibility for a big tumble.
This is a weekly chart of Netflix, which gives the broader outlook for the coming months. There is a possibility Netflix rallies back towards the $400 region in the short term, but I highly doubt it will make a new high in the coming weeks.
Exponential rallies always end poorly, as they show growth is unsustainable at that rate.

JD - JD.comEarnings coming up soon and I like JD overall. Low part of the range after a great 2017.
I went with a synthetic covered call, selling the Aug17 $39 put for $1.90 cr. This trade is around a 5% cash ROC within the next 35 days.
I'll go for 50% W or continue rolling this position out, collecting credit through time.

XLI - IndustrialsEarnings season is imminent here for most companies. A few of the industrials have been reporting recently too. I decided I'd throw a little premium on in here.
-1 Sep21 $75 straddle for $3.43 cr.
Risk: 1.5-2x credit received
Profit: 25-30% of credit received.
If we get a down move, I may just take the call off and then roll out the put. We'll see how this trade works out.

EWZ - BrazilLooking for some high IV trades to enter into the mix here.
-1 Sep21 33/40 strangle for $1.34.
Risk: 2x credit received (worst case, take stock)
Target: 50% profit
Depending on how things go, I may keep rolling this position on in different ways, reacting to how the market moves.

XHB - HomebuildersGetting long homebuilders here at support.
-1 Sep21 $39 put for $.84 cr.
Risk: 2x cr received or I'll continue holding and rolling.
Profit: 50% cr received or continue to roll.
Notional Value: $3900/contract

XLK - TechnologySome Iv hiding out in the Tech sector due to the middle of the earnings season.
Sold -1 Sep21 70/73 strangle for $2.43 cr.
Risk: 2x cr received to upside, possibly continue to roll put to the downside.
Profit: 50% cr received or manual close on some quick profits (IV collapse due to earnings?)

KRE - Regional BanksTrying to gain some exposure here to banks.
Sold -1 Sep21 $60/66 strangle for $1.67.
Breakevens are at $58.33 & $67.67. I'll look to manage at 50% or deal with any troubles as they come.

XLU - UtilitiesIV isn't extremely high, but has spiked up a bit in Utilities, so I'm looking at placing a strangle here.
-1 Sept21 50/54 strangle for $1.14 cr. I will likely manage this position at 50% and we'll deal with specific loss mgmts when we get there.

Ebay: Another company Amazon will put out of businessIt is no secret that Amazon has taken the world by storm in the past few years as its market cap nears the unbelievable 1 trillion mark. Amazon now provides a service for nearly every demand you can think of. Food, retail products, shipping, a place to sell your goods/services, cloud services, etc. In the next few years, Amazon will probably increase its user base and put smaller companies out of business, such as Blue Apron, Barnes and Noble and Ebay.
Ebay is a great fundamental short. In the next few years, their annual revenue will decrease as they begin to lose money, inevitably going bankrupt due to Amazon's dominance. Technically, the chart tells the same story. Ebay recently announced terrible earnings, causing the stock to gap down hard. It has now fallen below all significant moving averages. The 50 day moving average (yellow line) also crossed below the 200 day moving average (blue line), a very bearish sign known as a death cross.
Due to the drastic recent decline, Ebay could be in for a short term bounce, but will continue to fall in the near and long term. I recently picked up Ebay puts with a break even price of $30 that expire January 18th. I would be astonished if they are not deep in the money by that time.

BAC SHORTBAC (and the rest of the banking industry) has a rough few months ahead. The major institution has seen solid gains over the past year and is about to relinquish them all. The major indication this downtrend is about to pick up steam is seen as the 50 day moving average is ready to cross below the 200 day moving average, a major bearish sign known as the death cross. Price on the weekly candle has managed to close significantly below this intersection point, a sign that a significant decline could come sooner than later as there is very little support below the current price. Seen on the chart above, RSI is also headed south with no sign of retracement anytime soon. Money Flow is in a steep downtrend as well. I anticipate BAC seeing at least a 20% decline in the coming months. The last time BAC had a similar set up with the 50 day moving average crossing over the 200 day moving average, the stock fell 33% in 6 weeks. I have picked up November and December puts for BAC (and JPM because the chart and my prediction is basically the same).

The most logical short in the stock market: TAOEarlier this month, my friend Harrison Schwartz wrote an eye opening article exposing the disaster that is in store for Chinese Real Estate investors (seekingalpha.com). The article analyzes the unthinkable situation China is in, and what is most likely going to happen. After reading it, my first thought was how can I make money off of this inevitable crash? That brought me to TAO, an ETF that tracks Chinese Real Estate. Fundamentally, this ETF could drop 80% over the next year or two. Technically, the signs are there as well. It is the most logical trade I have ever made.
Looking at the chart, there is a clear head and shoulders pattern that has formed over the past 10 months. A death cross has recently occurred, marked by the 50 day moving average crossing below the 200 day moving average, a very bearish signal. There has been a recent bounce after bullish divergence on the RSI which could lead more short term gains. However, if TAO reaches the low $29's, it will most likely get stopped out by resistance in the 200 day moving average and resume its plummet, where I will be looking to enter a highly leveraged short position. Lastly, the weekly chart for TAO confirms the long term bear trend that it has entered, as RSI is pointing down hard, validating the recent bull trap.
