$PYPL Bull case.No indicators, what I would like to see from a pure price perspective with the legs up, market may not allow. Void under 116.5 as we go right back into a chop zone.
PYPL

$PYPL Clears the way for a breakout to the Upside PT $200A year after PayPal adopted the crypto market and allowed users to receive and use crypto for goods, PayPal has returned to its Pre-Covid levels that most tech companies have recently returned to after seeing an extraordinary last two years.
Now in a clear uptrend with the stock market and crypto heading back up to breakout levels I anticipate PayPal to follow suite and gain considerable ground over the next few weeks.
My current PT is $180-$200
I've bought May 20th $150 Calls in anticipation of this.
GLTU All

PayPal, Back to "THE ORIGINAL CHANNEL"After a very significant drop, #PYPL finally arrived to its origin station.
IF price breaks this channel path 2 will be the future.
IF price fails to break this channel path 1 will come.
Since price has already fallen 70% below its high, path 1 is more convincing.
NOTICE:
This is not a financial advice

cDon't listen to all the pundits when they tell you the market is strong. If you had to borrow money every year to keep up your lifestyle and pay off those debts with larger debts, would you say your personal economy is strong? No. That's exactly what the government has done for decades and the chickens are coming home to roost. The SPX (S&P 500) has been phantom collapsing since August 2021 but it's hidden by the larger weighted stocks. It's possible we see a quick rally before a huge sell-off, but I wouldn't place that bet. There are good companies that are down dramatically. Even Chipotle (CMG) is down 31% in the last 6 months which is a crash! Here are some more: Clorox (CLX) down 28%, BlackRock (BLK) down 28%, Paypal (PYPL) down 69%, Penn National Gaming (PENN) down 50%, Paycom (PAYC) down 39% and so many more.
The first area to break we need to be watching is the 3,700 level. The next is the 3,500-3,250 then the where there is a possible area of large support off the old pre-pandemic highs. Our average sell-off yellow bar is 3,000 - 2,800 as a very fair level of support. That isn't to say we can't have a 50% collapse or more, but this is a great starting point to average out and see where this may end. If we see banks folding, WW3, or anything along those lines, expect massive moves to the downside and then incredible inflation (FED money supply growth).

PayPal (NASDAQ: $PYPL) Ready For Reversal! 🤩 #BullishPayPal Holdings, Inc. operates a technology platform that enables digital payments on behalf of merchants and consumers worldwide. It provides payment solutions under the PayPal, PayPal Credit, Braintree, Venmo, Xoom, Zettle, Hyperwallet, Honey, and Paidy names. The company's payments platform allows consumers to send and receive payments in approximately 200 markets and in approximately 100 currencies, withdraw funds to their bank accounts in 56 currencies, and hold balances in their PayPal accounts in 25 currencies. PayPal Holdings, Inc. was founded in 1998 and is headquartered in San Jose, California.

Shopping at GAPs..!These days, your stocks create big gaps (usually down side) after earnings!
Some People think this could be a good opportunity to enter a long position.
but
Is it really good to do that?
My simple answer to this question is:
No
Why?
Look at these examples in the past few months:
FB:
DOCU:
PYPL:
F:
ZM:
PINS:
WISH:
UPST:
BABA:
I hope you are convinced by now..!
Best,
Moshkelgosha
DISCLAIMER
I’m not a certified financial planner/advisor, a certified financial analyst, an economist, a CPA, an accountant, or a lawyer. I’m not a finance professional through formal education. The contents on this site are for informational purposes only and do not constitute financial, accounting, or legal advice. I can’t promise that the information shared on my posts is appropriate for you or anyone else. By using this site, you agree to hold me harmless from any ramifications, financial or otherwise, that occur to you as a result of acting on information found on this site.

PYPL: A possible REVERSAL sign on it!Hello traders and investors! Let’s see how PYPL is doing today!
The trend is clearly bearish on it, however, it is reacting nicely today. This reaction came at the right time, as PYPL is trading at a support area, and we are quite far from the 21 ema as well. A reaction was expected, and it is convenient.
We don’t see any bullish structure, and this reaction could be just another dead cat bounce, but if PYPL closes above the red line at 94.54 today, we might see a false breakout from a support level.
In the daily chart, we see that by holding at the $ 94.54, PYPL might trigger a double bottom chart pattern. The $ 113 would be the technical target, however, if it breaks this point, the next resistance would be the gap area at $ 170.
However, this would be a reversal thesis, and since we don’t see a clear reversal in the 1h/D charts, let’s hold this idea for now, and just pay attention to the signs it’ll give us near the support at $ 94.
PYPL looks promising, and I’ll keep you guys updated on this, so remember to follow me to keep in touch with my daily analyses.

$PYPL Time for a reversal?(LONG)
I want to see if it creates a demand in 99$ area, making its way to 100.54.
Next, I want to see it break out and retest that area and make a leg up. I'll enter at the retest or a pull back. Taking any profits if it is nearing resistance.
(SHORT)
Will buy put if it breaks the structure, retest previous support. Theres a good support around 94 - 95 area so that would be my target.

PYPL short term reversal If you haven`t sold PYPL ahead of earnings:
then it seems like it has found a support at $95 from which is aiming higher to the $120 resistance.

$PYPL #STOCK #NASDAQ #NASDA100 $NASDAQFinally , seems that something good has started here at paypal!
Short term trade !

PAYPAL - Monthly Demand Contacted NASDAQ:PYPL
PYPL has contacted Monthly Demand and is in line with the Monthly Demand that the S&P 500 has contacted.
There are several stocks that are currently aligned with the Monthly Demand of the S&P 500 ** See my profile for more stock scenarios**
PYPL has the potential to rocket with institution demand coming into play. This trade has the potential to reach new highs in the long term.
As we reach PEAK FEAR in the markets, we are liking to have reached a bottom on the S&P 500

Paypal rebounding?Seems like paypal started to rebound and is going to test the 120 range. Any thoughts?

PYPL Support and Resistance playIf you haven`t sold ahead of earnings:
Then it looks like a support and resistance play.
My price target is $120.
Looking forward to read your opinion about it.

MARKET CRASH! PAYPAL $PYPL ANALYSISHey all, I know this is some of the first Stock analysis that I have put out on trading view, but for those of you who know me, I have been calling moves in the stock market on point since 2018. Known for:
Called Shocktober of 2018
Called the Crash of 2020 (my call was for 3 days after the start of the crash, since COVID was the black swan catalyst that started its dive).
Called the irregular V-Bottom Recovery for the Crash of 2020.
Called the now forming start of the Crash of 2022 that Ive projected it to happen in Q1 2022, since the start of 2021. This Crash will be an overall trend reversal across major indexes, due to price action reaching a test of a macro scale .618 Fibonacci Extension. I've projected that the crash starting in 2022, will play out a similar style to that of the Bubble Pop that occurred in 1929, except due to the extensive size of the bubbled market we have today, this crash we will see in the market, will make the crash of 1929 look like its little BEEYYOTCH. Shown Here:
Now to jump into this analysis.
OVERALL MARKET ANALYSIS:
After seeing for the first time in a very long time we have seen the major indexes like the SPX , DJI and other indexes all have failed to create a new higher high, despite making a lower low off this recent drop we have seen since the start of 2022. This has started a new downward trajectory for the market, that could lead into the projected crash that I have called to start in 2022.
In addition to the FED re-introducing rate hikes as of Q2 2022, This will just add to all the inflation that is already happening i.e. current currency supply inflation, Consumer price index inflation, supply & demand inflation due to supply chain bottlenecking...
Examples of how inflation is affecting not only the consumers but even the companies producing the products can be seen everywhere. We as consumers continue seeing prices rising with what looks like no end in sight. Manufacturers have been downsizing the products they produce and are still charging more for the same product just packaged a bit smaller now.
For example Gatorade used to have the 32floz bottle size and used to be able to get them 2 for $4. Nowadays you will not see the 32floz size and instead you will see a 29floz bottle size and most commonly I see 2 for $6. Many products have been doing this to be able find extra product within the product they already produce and now use a slightly smaller container which both help cut some costs for the company while being able to produce the same product.
NASDAQ:PYPL CHART ANALYSIS :
Due to the major indexes making that lower low and then coming back with a lower high, this has started the downward trajectory, and as of Feb 2 2022, when the indexes made that top and the price turned around, You are seeing MAJOR PRICE DROPS across many of the individual stocks in recent days.
The drops normally have been forming new large gaps in the chart, which led me to analyze any other possible gaps that are present that have NOT been filled to current date. The ONLY REAL chart analysis that is needed at this point is to follow the gaps in the charts, because as the old saying goes "Gaps Fill".
As you can see here on Paypal's chart, we had been dropping from its highs since mid-2021 and also made a gap higher up in the chart in November 2021 that has yet to be filled from $216 - $224. The bottom of the gap was re-tested and failed, which resulted in a drop down to the .382 FIB Retracement, but upon its initial test, the price action broke below the .382 level. Although its attempt to hold that level, its initial break would be the cause for its continued move downward.
Although we had what looked like a promising recovery off the .55 Fib Retracement level, this was SAVAGELY Shut down the same day that the major indexes put in the lower high turnover in price action. Combined with the market pricing in its dissatisfaction with the FED reintroducing rate hikes next quarter, the combined confirmations have woke up the bears from hibernation and they are HUNGRY.
This SAVAGE rejection produced an instant GAP downwards of 20.5%, resulting in a GAP from $141 - $176. This has yet to be filled, as marked on the chart.
The drop down to this level has filled a GAP that was left unfilled from May 2020, and is now filled. Which is a slightly positive observation. We could have seen the gap that we just formed possibly fill, if the price action was able to break the bottom of the GAP which sits right on top of the .618 FIB Retracement level, and with the GAP candle forming under the .618 fib retracement, this produced a further move downward, creating a move further downward to the $123 price level.
Currently, we have the candle from last Friday (2/4/22) form candle body support on top of the .706 FIb Retracement level and that correlates to holding support on top of a Double Top that formed formed from the start of 2019 up to the crash of 2020.
PREDICTIONS:
Overall, there are plenty of swing trade opportunities all throughout each of the moves the market makes. But overall, a short/downward price action bias is still overwhelmingly strong right now
A) From this level we could see a move to re-test the .618 Fib Retrace, resistance level at $141. IF it does re-test the .618 fib retracement, the probability of being rejected is HiGHLY LIKELY due to the strength of the .618 fib levels overall, but that would also mark the top of the now filled GAP from May 2020. And considering the time frame as to which that would happen, that would be around the start of Q2 2022 which is when rate hikes would be started again. A break of such a strong fib level also has a very low possibility due to the move that was just made downward as well.
B) Whether we re-test $141 or we re-test the $128 level, which is the bottom side of the May 2020 Gap that's been now filled. The current candle body support on the .706 FIb Retracement level is below this $128 GAP resistance and also below the last long term ascending trend line that we had. The confluence of bearish confirmations would mean that the bottom side of that GAP would result as a new resistance point for the chart and seeing that there is yet another unfilled GAP from April 2020, we are most probable to see a move that pushes us down to the $94 - $96.50 price level. A Key indication of what the next move would be from this GAP fill would be whether or not the price action can recover and wick back above the .865 fib retracement to hold candle body support.
C1) IF it can recover the .865 fib level, that could fuel a trend to the upside to re-test the .786/ .706/ .618 fib retracement levels, A break and hold of support of each would allow us to fill the November 2021 and February 2022 GAPs.
C2) Keep in mind that there is also a GAP that is from April 2017 that is yet to be filled that sits down at the $45 -$46 price level. After filling the April 2020 GAP at $94 - $96.50, If we CANNOT recover the .865 Fib Level and start to close daily candles below $100, the probability of yet another move downward to the April 2017 GAP would be inevitable. We would see some indicator and oscillator relieving support at the 1 Fib Retracement level and then ultimately the 1.618 FIB Retracement level sits down at $37.50..
CONTINGENCIES:
There are a couple of things that would create the opportunity but also the ability to continuously capitulate in a waterfall down, 85% to fill the April 2017 GAP and down 88% to find support at the 1.618 fib retracement level.
These factors would include any of the following:
FED not realizing that the market will continue to capitulate as long as the are integrating Rate HIkes. Of which, start in Q2 2022 with up to a 1% rate hike, Q3 2022 with up to a 2.15% rate hike, and Q4 2022 with up to a 3.25% rate hike. Then for 2023 the continued rate hikes are projected at 3.25% and up based on FED evaluation. They do not plan on decreasing rates by any means until their have drastically reduced their $9.5 Trillion Balance of Mortgage Backed Securities (Debt Treasury Bonds) that they have bought from the banks in the form of bailouts. This balance does not include any of the passed budget plans that has required the FED to create new currency to fund budget plans which also include all the stimuli for COVID-19 and EDD funds to each state to continue to payout Unemployment claims, PUA and PEUC benefits to everyone.
NOT Reverting back to 0% rates will continue to impact the market with detrimental effects from the roughly $25-$30 Trillion dollars that have been created in the past 2 years. With how long the rates have been at 0% - 0.5% prior to COVID and then during the last two years, having maintained a 0% rate, while we also have been creating obscene amounts of new currency to be able to provide liquidity for everything that would be to simulate the economy velocity or to pay for COVID related expense, and bank bailouts. Another detrimental factor that comes into play are that physical fiat currency will NOT be made for most of the amounts that have been generated for liquidity. Which means that the Federal Stimulus direct deposits and checks, the bank bailouts, and the liquidity given to states to fund the Unemployment and PUA and PEUC benefits were all sent out using currency digits. Currency Digits = newly created currency from the FED that does not create new physical fiat currency to account for the newly created currency amount. Instead this currency amount is transferred as digits and then the debt is held in Treasury Bonds. Problem is that those T-Bonds become a ticking time bomb, cause the FED has been creating new currency digits to give out at a 0% rate, but then has to turn around and buy up defaulted mortgages and debt bailing out the banks to then make new Treasury Bonds for the new debt its bought, of which all banks and other country's banks and governments would bid to be able to acquire these T-Bond'd backed securities of debt for an incentive i.e. profit %, tax cut, lump sum payout for holding it. But when you have every other Country in the world that is having their own economic crisis that takes them out of the picture and banks cant buy up the T-Bond debt like they usually would because they would have to ask their sugar-daddy (The FED) for liquidity to be able to buy up the T-Bond Bills..Now these T-Bond backed securities of debt have no one buying them up and they will eventually come due,. Take a crazy guess as to what willl happen then?.... Yup thats right, more new currency to be able to
High Frequency Algorithmic Trading bots Fueling excessive moves downward due to the nature of which they are coded to use indicators and oscillators that reflect current market momentum and strength. Just as they did during the Crash of 2020. Many of the anchors on MSNBC would frequently discuss/complained about how these HFT Bots were continuing to drive the price down uncontrollably.
Overall High Inflation combined from the new Rate Hiikes (1%-3% per quarter), the Consumer Prince Index Inflation (avg. 7.1% ea. month), the Current Currency Supply (physical fiat) inflation (avg 28% YoY) combined with decreased Economic Velocity with force people into another economic indeflation where mass deflation and inflation are being made at the same time -- deflation made by the fear of markets downward trends and consumers reverting to mattress savings of cash, and inflation made by the government creating new incentives for people to apply credit and loans, new stimulus handouts, and any other way they can think of to stimulate the economy and continue to have velocity..
There you have it, a combined analysis of short term and long term price targets, analysis of the market overall plus $PYPL charts specifically, and then a cross analysis of how current and future economic conditions could and would effect the price as well.
If you found this helpful, Please remember to leave a Comment, Give this post a like and so you do can get regular updates for my analysis whenever they are posted, Follow me and make sure you have notifications turned on!

Are PYPL Leap Contracts Free Money Right Now?What's going on fellow traders, hope everybody enjoyed their long weekend. I just wanted to drop this here and see what your thoughts are on what I believe to be a no brainer.
As you've probably noticed, $PYPL has had an insane sell off that's been ongoing for what feels like an eternity at this point. Historically, you can see that there has been pretty solid support at the $100 level since the summer of 2018. That being said, given today's market conditions I wouldn't be surprised if $PYPL gets bullied a bit more subsequently dipping into the sub -10 RSI level. I believe pretty much any more selling pressure in the next 1-2 weeks could force the stock back into the high $80s mid $90s. From there it should be completely bottomed out and a fantastic time to load up on leaps as close to the money as possible. I'll be waiting to see if we can get in at an even bigger discount and will be targeting contracts within the <$95 zone and as soon as Oct 21 to Sep. 15, 2023.
The yellow drawn in trend line represents a rough trajectory of the price that I could see happening if $100 support is cracked. (just a guess)
Let me know what you guys think, and please send me any of your own picks that you like.
- Premium Flippa

About #PYPL analysisBy analysing #PYPL, I can see clearly that it's on bearish momentum. Since, 103 is a strong support level and breaking down of 103 level we can see easily see price around 98 and if 98 cannot hold than there's a high chance of reaching around 91 and 82 level.
However in next week we might see PYPL back to 114 level if it breaks 106.8 level. NASDAQ:PYPL NASDAQ:PYPL

Don't fall for the NarrativeThere's a general narrative going around of "buy the dip" and "look at these undervalued stocks". The goal here is not to compare Facebook to Microsoft to Paypal as companies, but to look at relative price structure between a handful of popular stocks. In this case, we have a few giant companies; Tesla , Facebook and Microsoft , charted against the smaller Paypal and Netflix , and which have taken a recent beating (along with Facebook ). The lines in the chart are an 1800 week linear regression of Microsoft's per-dollar performance relative to the M2 . The lines don't mean anything and are merely a rough guideline of history-projected asset strength. The prices are M2 adjusted to account for money supply expansion.
Facebook has been underperforming since 2018 after making a huge run in 2013 onward, but the notion that "it's a good deal" hardly stands up if you look at the relative trajectory of Microsoft and Tesla . Facebook was one of the biggest to rise, and was one of the first to fall. Microsoft on the other hand has a huge history of being an efficient capital allocator, and will probably be one of the last to fall. Let's ask the question: If Microsoft and Tesla make the same correction as did Paypal and Facebook , do you think Paypal and Facebook will be lower or higher following this hypothetical correction? The gut feeling here is that Paypal/ Facebook / Netflix /Peloton etc. COULD end up falling even more, given that many of these larger cap stocks are still standing well. I would rather short Tsla / Msft than long Paypal/ Facebook / Netflix /Peloton etc. given the current environment.
It's easy to want to fomo into these stocks when you look at a year or two of history, but I think this paints a more realistic picture.
Good luck and hedge your bets :)
Note: The arrows are not price targets, just medium term directional indicators.

Explanation of my post yesterday, re: Mirror on $PYPL ($NDX)Additional clarity on Mirror Pattern I posted yesterday concerning $PYPL.

PayPal - Possible relief rally soon?Key highlights:
1. Approaching weekly demand zone
2. May try to reclaim 200MA cluster
3. Volume climax
4. Approaching previous support level
5. RSI oversold on multiple time frames
6. Wait for a reaction from the demand zone
Conclusion : We may see a relief rally in the coming week. The idea seems to be too ambitious at the moment. Wait for a reaction from the demand zone.
Disclaimer : This is NOT investment advice. This post is meant for learning purposes only. Invest your capital at your own risk.
Happy learning. Cheers!
Rajat Kumar Singh (@johntradingwick)

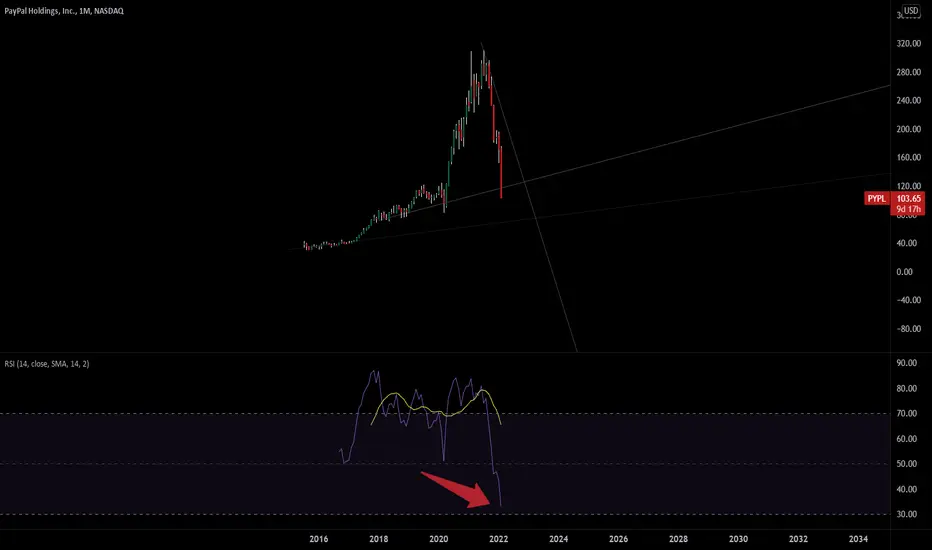
Monthly RSI close to 30Once monthly RSI hits 30, its time to buy. Next month we can see big rally. Hope it will drop another 10% or so before it bounces back in March.
Turn backk soonHere we can see a turn around soon, at 80 $, i hope. There is no reason for such a an aggresive dip.

This is what I want to see on PYPLThe first thing to say is, "I'm faaaar away from developing a setup right now on PYPL; when things are melting, trying to find a bottom is a really unprofitable business (or at least for me). So that's why I use relevant supports/resistances or trendlines as main levels before thinking about developing new setups.
In this case, the first trading opportunity I would be interested in is IF the price can break the first trendline. IF that happens, I want to see a correction, and a setup on a new high may be a good opportunity to get exposure to a new bull run.
I would like to add to this explanation why I always wait for breakout + correction before trading. This is because most of the time, we don't observe levels being broken like if nothing were there, most of the time when the price reaches or breaks a key level we will tend to observe some kind of retracement (this is valid both for bearish and bullish directions).
Waiting for this is a good way of avoiding fakeouts because you are not entering on the first breakout. This means that your drawdowns will tend to be more controlled because you are able to avoid A LOT of low-quality situations by doing this. The negative side is that sometimes the price breaks the level like if nothing were there and you miss the setup (however, I have realized that this is the exception)
Going back to the PayPal explanation, I think patience will be my strategy here; I want to see a clear bottom which means observing several more candlesticks before saying "oh, this is reversing" and then paying attention to the descending trendlines, as the first place where I'm thinking on developing setups. At the moment, PYPL stays on my watchlist as "WAIT WAIT WAIT."
Thanks for reading! Please feel free to share your view and charts in the comments.

