PYPL is a buy herePYPL is a good long term hold, but now were getting a good entry. Breaking above previous highs resistance becomes support. The 8ema broke above the 13sma and now price is above all the supporting averages. MACD is in a positive trend
PYPL


Buying Bitcoin on Paypal: Is there an arbitrage opportunity?In this video I look at the spread between the price of Bitcoin on Paypal and BITFINEX:BTCUSD on other exchanges. Is there an opportunity for profit in that difference?
What you'll find by the end of this video is the true meaning of "mass adoption" in cryptocurrency...


PYPL is close to breaking a multiple top resistance over 216NASDAQ:PYPL
After Cyber Monday and Black Friday are expected to be very good news on the company's profits.
The breakout now (if it occurs) will also actually be an all-time high.


PYPL - Monday 11/23 Triangle BreakoutVery bullish breakout formation has been formed, giving PYPL the perfect setup for Monday morning. On Friday I sold my 11/27 $200 calls to secure profit, but I'd like to buy them back ASAP.
We need PYPL to keep above 190 and push past the 0.5 fib at 194.8. This will send it up the gap and above 200, hopefully using the 0.618 fib as the new support.
First price target: 200
Second price target: 207

Supply & Demand Trading Analysis 11/22/2020With the strong bullish momentum dissipating, the signs of a reemergence of mass hysteria with wave 2 of covid arriving, numerous stocks a far distance away from major moving averages, big institutions adding more hedges to their portfolio's, these stories appear to ring the same tune prior to the crash in march. With a majority of stocks failing to reach new highs or inside supply zones, here are some stocks showing signs that a reversal to the downside is imminent.
MU
- A strong trend to the upside, however volume appears to diverge with price, a textbook bearish signal.
- Inside a major daily supply zone + strong rejection attempting to break above zone.
- Far distance away from 20ema on daily chart. Pullbacks resulted every time during similar prior occurrences.
- Entering a short position if price begins to break lower level of daily supply (59.44)
BIDU
- Price recently bounces of 200ema while inside a monthly demand zone.
- Price is showing consolidation, preparing for another strong move to either side.
- Looking to BTFD if price drops back to 200ema within the monthly demand zone.
MS
- A market top appears to have formed a market top on daily chart after failing to break above supply zones
- Will enter short position if price breaks below $57. Strong indication price is reversing.
- A triple top appears to have formed when analyzing weekly chart.
- A sharp rise in price with decreasing volume and far distance away from ema's = perfect pullback conditions
KSS
- Keeping an eye on how price moves this week as it appears to be forming a bull flag while attempting break above daily supply zone.
- If price moves in predicted pattern, will enter a short position as price enters circled zone. Black trendline is the top of monthly downtrend, expecting a rejection as price approaches.
PYPL
- Price in consolidation in middle of a 4 month trading range. With market conditions showing signs of a market ready to sell, I expect a breakout on the downside.
- Will look to BTFD if price breakouts out, entering demand zone along with 200ema inside zone resulting in high possibility price will use 200ema as support.
CNK
- Price rejects off 200ema after touching ema for the first time in 2020.
- If price begins to rise back into weekly supply zone AND with decreasing volume, will enter a short position in circled zone as it tests both a major supply zone and 200ema resistance.

$PYPL - Monthly Consolidating above 9ma on monthly chart.
ENTRY: 188.62 (1/2 size)
TARGET: 390
STOP: <165
NOTES: Will add the remaining 1/2 at support or break outside of the consolidation channel.

$PYPL - Called it to the T .. Look at the arrows before the runs$PYPL - Called it to the T .. Look at the arrows before the runs

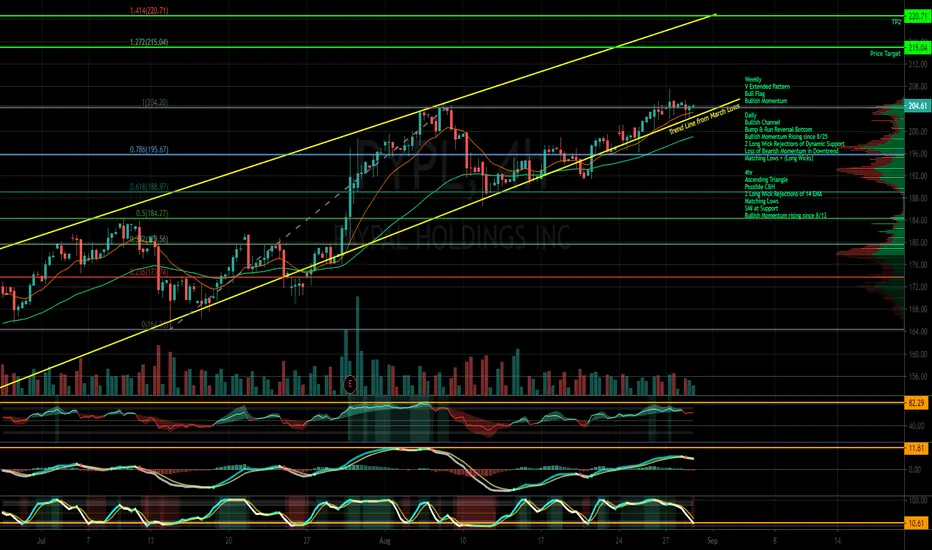
PayPal Report Exceeded Forecasts Due To Growth In Online SalesPaypal shows a clear uptrend. Formed a bullish flag. If it breaks through the key resistance level, then the next targets are the Fibonacci levels.
PayPal Holdings reported better-than-expected quarterly results due to increased online sales during the coronavirus quarantine, but the current quarter profit forecast disappointed analysts. The company's revenue increased by about 25% to $ 5.46 billion, beating the analyst consensus forecast of $ 5.43 billion.
A storm is brewing in the stock market until January 20. The name of this “weather phenomenon” is the US presidential election. The American economy is the largest in the world, so the world economy indirectly depends on what is happening in the United States.
Best regards EXCAVO

PYPL, was a top loser this week, declining -9.74%. PayPal Holdings (PYPL, $192.31) was a top weekly loser, falling -9.74% to $192.31 per share. Of the 50 stocks analyzed in the Data Processing Services Industry throughout the week of October 21 - 28, 2020, 9 of them (17.14%) exhibited an Uptrend while 41 of them (82.86%) were in a Downtrend. 90 similar cases when PYPL's price dropped 5% within one week were found. In 71 of those 90 cases, PYPL's price went up during the subsequent month. Based on these historical data, the odds of a Downtrend reversal for PYPL are 79%. Current price $189.54 crossed the resistance line at $183.23 and is trading between $193.32 resistance and $183.23 resistance lines. Throughout the month of 10/02/20 - 11/03/20, the price experienced a -6% Downtrend. During the week of 10/27/20 - 11/03/20, the stock fell -10%.
Bullish Trend Analysis
The Stochastic Indicator shows that the ticker has stayed in the oversold zone for 5 days. The price of this ticker is presumed to bounce back soon, since the longer the ticker stays in the oversold zone, the more promptly an upward trend is expected.
The 10-day Moving Average for PYPL crossed bullishly above the 50-day moving average on October 09, 2020. This indicates that the trend has shifted higher and could be considered a buy signal. Tickeron A.I. detected that in 16 of 18 past instances when the 10-day crossed above the 50-day, the stock continued to move higher over the following month. The odds of a continued upward trend are 89%.
Following a +6.50% 3-day Advance, the price is estimated to grow further. Considering data from situations where PYPL advanced for three days, in 248 of 348 cases, the price rose further within the following month. The odds of a continued upward trend are 71%.
PYPL may jump back above the lower band and head toward the middle band. Traders may consider buying the stock or exploring call options.
The Aroon Indicator entered an Uptrend today. Tickeron A.I. detected that in 306 of 396 cases where PYPL Aroon's Indicator entered an Uptrend, the price rose further within the following month. The odds of a continued Uptrend are 77%.

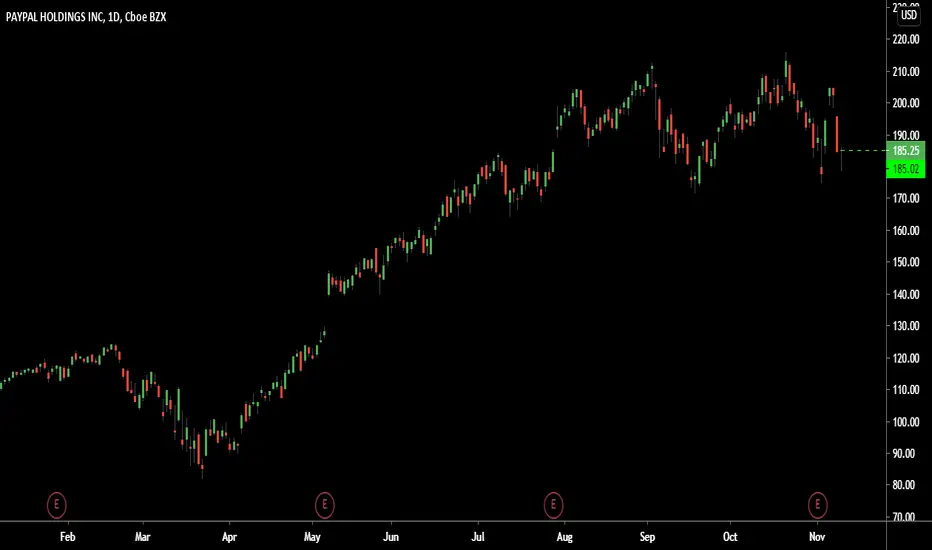
PAYPAL correction done?PayPal Holdings Inc. has been one of the biggest beneficiaries of the COVID-19 crisis, which has driven record usage of its payments platforms as more people shop online. Now the question is whether the company can keep this momentum going.
There is plenty of uncertainty ahead for PayPal PYPL, -4.23%, wrote MoffettNathanson analyst Lisa Ellis in a note titled, “Is this the end, or the beginning?” The company continues to face weakness in the travel and events vertical, it’s seeing a credit slowdown that could persist into next year, and former corporate cousin eBay Inc. EBAY, +2.19% is in the midst of moving from PayPal to its own managed payments platform, a transition that’s happening more quickly than expected.

PYPL Still Above Major Support LevelsPaypal looking bullish into the election. Price is still trading above some major support levels at 171.00 & 164.00 respectively. Look to buy into major support levels as risk/reward becomes very attractive. If the price manages to consolidate below 162.00 cut losses quickly. Any consolidation below 162.00 will be considered very bearish.

$PYPL BOM into ER - My chart a few weeks ago spot on so far 😍$PYPL BOM into ER - My chart a few weeks ago spot on! On watch tomorrow earnings

PYPL Bullish Cup and Handle pattern playing outLooks like a Cup and Handle pattern playing out on the Paypal (PYPL) chart. Upside target would be $251, but they report earnings on 2 November that could make or break this setup. I am not looking to play this setup until after the earnings report. I will post a video talking about this in more detail on my YouTube channel "Money Dad" soon.


PYPL looking to the upsideTrade ideas:
- BUY the stock and target 205 with SL 172.50
- Buy PYPL Call 195 OCT02

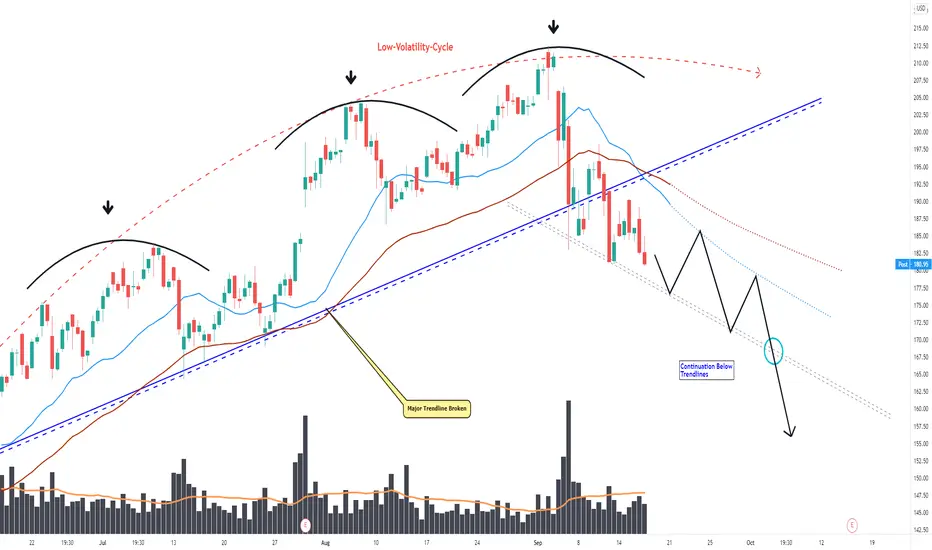
PYPL, Made The Move Below Major Trendline, Next Steps Ahead!Hello Traders Investors And Community,
Welcome to this analysis where we are looking at the 4-hour timeframe perspective, the recent events, the current formational structure and what we can expect the next times. PYPL like many other stocks in the current situation provided heavy bearishness to the downside, the big question now for this stock is if it will continue or manages to reverse in the structure, as the major indices also looking seriously bearish with a bigger potential for continuation given as there is the gap between the real economy and stock market existing we can not take the bearish perspective out of sight here and there are some possible outcomes I detected properly fulfilling when the stock shows up with the proper price-action in its destinies.
Looking at my charting you can watch there this huge low-volatility-cycle established now for a longer time period, furthermore, the stock broke below major layers of support which are now resistance, these are firstly the ascending trendline marked in blue which was a fundamental step into following up with this bearish move secondly below the EMAs where also a bearish crossover formed, these EMAs are now serious resistance and it is possible that we see a consolidation where they properly confirm as resistance, when this happens we can expect the next movements to consolidate between the trendline and resistance when the grey trendlines are broken there will follow up bearish pressure with a high possibility given.
In this manner, thank you for watching, support for more market insight, good day to you, and all the best!
“The men on the trading floor may not have been to school, but they have Ph.D.’s in man’s ignorance.”
Information provided is only educational and should not be used to take action in the markets.