Short PYPL on rising wedge termination in bear flag supportHere's PYPL marked up on the hourly. Bear flag move off 23APR, price terminating into a bearish rising wedge right on bear flag support. The best RR would be to shot at the top of the flag but I really do not believe it will get to 178 and you'll miss a sick setup.
I see it either head faking a break to the outside then dumping out of the bear flag, or just dumping out of the bear flag within a day.
PYPL

PYPL - PAYPAL buy zonesHello traders,
Description of the analysis:
Paypal the best buy zones for investment. The middle zone is the strongest.
About me:
Hi, my name is Jacob Kovarik and I´m trading on stock exchange since 2008. I started with a capital of 3000 USD. My first strategy was based on OTM options. (American stock index and their ETF ). I´ve learnt on my path that professional trading is based on two main fundaments which have to complement each other, to make a bussiness attitude profitable. I´ve tried a lot of techniques and many manners how to analyze the market. From basic technical analysis to fundamental analysis of single title. My analytics gradually changed into professional attitude. I work with logical advantages of stock exchange (return of value back to average, volume , expected volatility , advantage of high stop-loss, the breakdown of time in options, statistics and cosistent thorough control of risk). At the moment, my main target is ITM on SPM index. Biggest part of my current bussiness activity comes from e mini futures (NQ, ES). I´m trader of positions. I´m from Czech republic and I take care of a private fund (4 000 000 USD). During my career I´ve earned a lot of valuable experience, such as functionality of strategies and what is more important, control of emotions. Professional trading is, in my opinion, certain kind of mental training and if we are able to control our emotions, accomplishment will show up. I will share with you my analysis and trades on my profile. I wish to all of you successul trades.
Jacob

$PYPLLove the company, have been with them over a few years.
They are doing super well during this pandemic.
However they have been running up over 70% since the global lockdown.
Speculate, don't trade.

PAYPAL (PYPL): Getting Paid With PayPal✨ We provide charts every day ✨
Like and Follow to help us grow family! 🎉
---
It's time to get paid with some PayPal (PYPL) plays. Let's go!
Today we are looking at PayPal's chart going into earnings. The bet is that this online payment company did will during the second quarter under COVID and that we will be seeing new highs going into earnings on May 6th or shortly after.
---
1. PayPal is already back up near its previous highs, having gotten rejected at the R1 bearish orderblock.
2. We got a long signal from Fractal Trend (Green background color) and a long signal from Breakaway Scalper (Green bar color) back in mid-April. We take long positions when Fractal Trend is bullish and then Breakaway Scalper is bullish, so this setup worked well.
3. We have a trailing stop still active on that long to lock in profits and will be relying on it to signal an exit upon the run up if we break these highs at R1.
4. The idea here will be to stay in the long position into earnings, assuming the strategy continues to give us the "green light." This is because earnings momentum may bring us higher and force quite a few people to cover their shorts as well as earning being great from all the recently generated revenue while everyone has been at home from the quarantine.
5. If we do break down for whatever reason, perhaps due to weakness in the overall equities markets, or perhaps if earnings are surprisingly bad, then support levels to watch are S1 and S2. That said, the idea here is to get paid with some PayPal, and the strategy suggests the best way to do that according to the strategy is to stay in a long position for now. So that is the play.

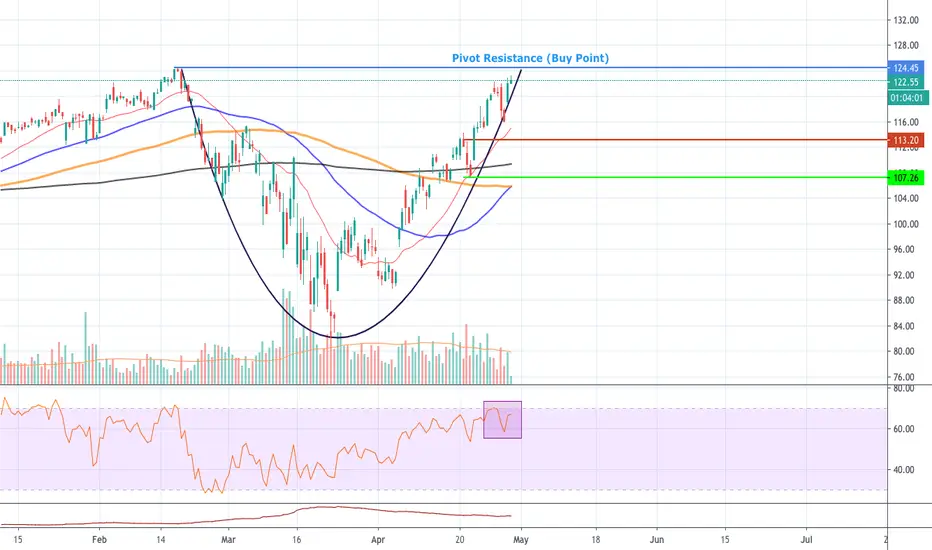
PayPal Holdings is forming "CUP" $PYPLPYPL is forming a deep cup and buy point is holding above $124.45. However, there is a negative divergence may pull back after hit pivot resistance till $113 or $110. Additionally EPS results also will affect the direction.
SP500 Going UpWhen I said it would go down in DEC19 I had to be confident to stand on my analysis, and it played out.
Here I support why its going back up, you've gotta draw the line somewhere, if its as the media portrays the world would have ended 10 times over already!
TRUTH is concerning as this outbreak is, compared to our massive world population of 7.8 Billion (MAR20) the numbers of this virus outbreak are minuscule.
They've been selling fear and the masses have been buying, business as usual, before this they were fear mongering about something, after this they'll find another issue to cry about. If you ask me this may have very well been a snowball of media fear mongering compiled with the sensitivities of feeble minds.
Being a medical matter, most of us and politicians are not educated on the subject matter, so it becomes important to follow the leader, because nobody wants to be taking the blame for mishappenings.
Here I believe the uptrend has started, and slowly but surely will return to sync with the pre corona trend.
Here on the M chart I believe it can close above 2500, or at 2500 by month end in 2 days, meaning APR the uptrend to become evident.
Just my take, do your own due diligence.

PYPL: can it pick up that lost track? i still like PYPL - and i beleive it was on a growth track to hit the $130 level, which was interrupted when the global / US market got hit by the CV situation - as a business, the fundamentals are still right and sound (don't want to say "strong" - i'm not qualified for that :)), and that's a business that shouldn't much impacted by the ongoing situation, on the contrary there's more demand on online shopping and payment services
prior to the sudden change, PYPL was one of these "well-behaved" stocks where price projections were relatively accurate (see the greenbox, and previous posts) - so what if it recovers now and starts getting back on track on the price growth movement.
The yellow circle is the scenario that "got interrupted" - the green circle is the new projection in that case -- we may see a rise to the $$120-$125 range in or before Q3 this year. however, for the time being, this is pure speculation -- just a "what-if" exercise, until we get strong confirmation of any recovery - but in all cases, i like PYPL in the buy zone between the 2 yellow lines - hope next week will give us an entry ..
if you like me to share these types of projections / "what-if" scenarios, let me know in the comment - and please *do not* take them for granted and do your own analysis and cross-check my assumptions before you trade - i can be totally off :)
please stay safe!

PYPL minor correction before bullish continuation PYPL is on a bullish trend. Price could encounter minor resistance at Wave A ($115) and correct to Wave B ($106) before continuing to test major resistance at Wave C ($124). Alternatively, PYPL could push through minor resistance at Wave B, and continue straight to Wave C without correction. The blue circles indicate the value of using the EMA20 as means to identify strong support/resistance.
Look for entry around $106
Stop Loss: $102
1st Target: $114
2nd Target: $124
If I decided to enter this trade, I will likely trade options (CALLS) instead of purchasing the underlying stock.

Adding more Paypal, if we can break that resistance line. $PYPLTechnical indicators are still showing bulls are still in control.
I am holding this stock in my portfolio and will add more if we can break and close above the yellow line with volume.


Paypal Fibonacci TradePaypal has broken bearish trend, and is attempting to cross 50% retrace from most recent drop and has met strong resistance. This chart has bounced off a long term Fib trendline of 50%, which we can expect profit taking at 88%, 100% and 161.8%. Short term, the 5MA has crossed over the 8MA on the 1D charts, which is a bullish indicator, as well as a W bottom, with a breakout above a trendline. We saw a very large volume of trading on October 24, enough to indicate a pivot.
We can expect strong resistance at this 50% ($108), which may cause a failed bullish signal, but I expect the previous resistance to turn into support, as the broken trendline will now become a support zone. We may see a bounce off this support zone, and I have marked the short term Fib Retraces with RED for resistance zones. Strong resistance at $108, and $111.
The green lines indicate targets, 88% and 100%, or $116, and $121.
This trade is a long term Fibonacci Bounce off the 50% line from December 24 2018 (low), until July 16 2019 (high).

PYPL Linear RegressionPYPL has recently had a nice dip, with the formation of this bowl, upsides are to come as per the regression trend. 0.86 strong regression uptrend. Great long entry. If you aren’t a fan of cryptocurrency ;) Rising wedge also present early.


PAYPAL - Next stop $111.75PYPL finally broke its key level resistance. We have a retest and now formed support. Looking to exit near $111.75s


PYPL Potential Bullish Longer Term Swing Trading OpportunityUsing our Elliott Wave Indicator Suite for the TradingView Platform we have identified a potential Long 5th Wave Swing Trading Opportunity for PYPL on the Weekly time frame . The 5th wave move in an elliottwave sequence is the highest probability move.
The wave 4 pull back has found support in the Amber zone of our probability pullback zones, which represents an 80% probability that our automated 5th wave target zone, in blue on the chart, will be hit.
We see yellow dots formed in the overbought zone on our special False Breakout Stochastic indicator, which signals strong Bullish momentum. When, during a wave 4 pullback, the stochastic pulls back against these false break out dots and crosses in the oversold zone, there is a high probability the stocks price action will resume the overall bullish trend .
We also measure the wave 4 behaviour with our Elliottwave oscillator, which has pulled back within our pre-determined zone.
So overall we have identified, using our Elliott Wave Indicator suite for TradingView, a high probability long swing trading opportunity for PYPL , Weekly Time Frame , with the following entry strategy:
Long entry through $109.07
Stop Loss $94.71
Target $132
Giving a Risk to Reward of 1:1.6

Long Paypal? $PYPLBreaking out next week?
MACD and RSI are bullish.
Stock is just above two moving averages (20,50) they will be acting as support.


$PYPL super set up$PYPL has a beautiful set up. Really excited if it stays in this wedge. Very Bullish.

PYPL Primed for move up after consolidation and W Bottom.Likes to consolidate after strength and return to growth after "W" double-bottoms. Higher highs could lead to a strong bounce off the current possible W Bottom test.
I expect a bounce up to appx $125 and a return to appx $118 by February 2020.

Long Term 5th Wave Swing on PYPL to the UpsideIts always great to have long term investments in your portfolio with strong growth Stocks. PYPL is getting ready to be added to our portfolio after a recent wave 4 pullback on the weekly timeframe.
Using our Elliott Wave Indicator Suite for the TradingView Platform we can see the recent wave 4 met all of our criteria for behaviour.
1. Wave 4 pullback found support in the amber zone of our probability pulback zones, representing an 80% probability the price will go on to reach our automated target zone (in blue on the chart) around $130.
2. Elliott Wave oscillator pulled back between 90-140% during wave 4 pullback
3. Stochastic has pulled back against false breakout dots in over bought zone and then crossed in over in the oversold zone during wave 4.
A conservative entry through $112 is sensible here and will be a physical holding that will run into next year, 2020.
To understand how our Elliott Wave Indicator Suite works for the TradingView platform and how it can help your stocks, forex, futures, crypto and commodities trading, please watch the video tour >>>HERE<<<


Trading the Elliott Wave Principle - Part 2 (3)This chart is part of our educational article "Trading the Elliott Wave Principle - Part 2."
