Classic Cup & Handle Pattern On PYPLHigh probability that PYPL trades higher in 2023 towards $120 based on a weekly cup and handle patter.
Note: This is not financial advice. Consult your financial advisor before doing anything.
Info: If you’re looking to up your trading game through expert guidance, come trade with me over at InTheMoneyStocks.com! Info about our different memberships can be found on the website. Links in bio to take you directly to our sites! Feel free to msg me for any more info, will respond to all followers as quickly as I am able!
PYPL

Stocks & Crypto QuickFire: Time StampedTimeStamps:
DOGE 0:18
SOXL 3:22
PYPL & DKNG 5:22
LTC 7:46
ETH 8:50
HSI 9:50
GOLD 12:00
PHUN 13:40
SLP 14:58
MSFT 16:14
NVDA 17:10
TSLA 18:00
AUDCAD 19:04
I say something like 17-6 in the beginning when I'm looking at DOGE. I meant to say 7.6 cents when referring to 7.6 cents being a smaller position entry area and 6 cents for a more sizeable one.

After Hours Market Update 11/21/2022You can view or copy my chart from this link: www.tradingview.com
APPL 0:00
DJI 2:00
DXY 2:40
NASDAQ 3:45
BTC 7:36
SPY 11:40
USDWTI 13:05
HSI 14:06
GOLD 14:42
DKNG 15:15
HOOD 16:49
GME 16:59
MSFT 18:08
PYPL 18:37
TSLA 19:30

PYPL: A classic Descending Broadening Wedge!• PYPL is doing a Descending Broadening Wedge in the weekly chart;
• This week it went up almost 20%, and it is in a key resistance area, made by the upper purple trend line and by the 21 ema;
• In theory, PYPL would correct next week, however, if the bullish momentum persists, PYPL would break this Descending Broadening Wedge, and in this scenario, the next resistance is the $122 (green line);
• The volume is increasing, which reinforces the idea of a breakout;
• For now, let’s pay attention to this resistance area.
Remember to follow me to keep in touch with my analyses!

Target 93Following daily.
I got a long signal with my system.
Hard TP 93
But I'll publish a dynamic SL and target. If you want to join trade, please follow my updates.

PYPL bearish hammer above 10 EMA weeklyGood hammer on weekly, nothing prevents us from going into wave 5 of downtrend except for the bearish candle above 10 EMA.
Except from that all clean of MA and POC can go to $35.

Paypal set to drop from $87 to $75?Watching this falling megaphone pattern set up a potential Paypal drop to $75 within the next 2 weeks. $PYPL

PYPL (POTENTIAL BUY ZONE)Just my basic MONTHLY charting.
I have marked what I see as the POSSIBLE bottom (support).
I see overall DOWNTREND with a possible reversal.
I have marked my potential buy zones for longs.

PayPal Hot Stock PayPal was super bullish because people were spending during pandemic. Now everyone is back to work and the stock crashed hard as long with tech stocks like Upstart and Affirm. Will the stock keep going down? Here is the resistance and support I think we should watch.
If PayPal breaks support at $69, it will slide to $42 like butter.

PayPal ready to rocket PayPal on Daily is showing two breakout patterns in the making...A Cup and Handle and an Ascending triangle...
We need the price to first break above $104.00. Then the next target will be easily at $134.45.
Few concerns:
1. Price is still below 200MA - which signals a bear market
2. The price could be consolidating before further downside
But overall I'll be Bullish Bias once the breakout occurs. Thank you for the request. Let me know if you need any other analyses.

PYPL LONGHello,
PYPL, I think there is correction and can reach $120 or more so I will wait price action to take long around $80
DYOR, Not financial advice
Short on Paypal. PYPLStart of B Wave.
We are not in the business of getting every prediction right, no one ever does and that is not the aim of the game. The Fibonacci targets are highlighted in purple with invalidation in red. Confirmation level, where relevant, is a pink dotted, finite line. Fibonacci goals, it is prudent to suggest, are nothing more than mere fractally evident and therefore statistically likely levels that the market will go to. Having said that, the market will always do what it wants and always has a mind of its own. Therefore, none of this is financial advice, so do your own research and rely only on your own analysis. Trading is a true one man sport. Good luck out there and stay safe.

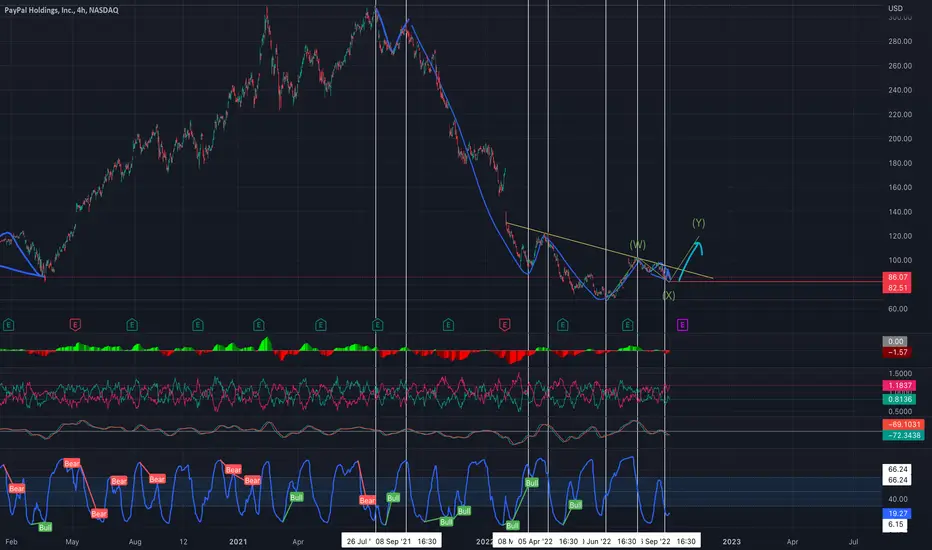
paypal (pypl) on bullish trendPaypal (PYPL) shows a very clear picture in the chart structure. We have two possible scenarios here, whereby the alternative scenario only has a probability of 20% due to the sell-offs.
Thus, I assume that Paypal saw the low at $68 on June 29 and has been in a wave (1) since then, which was completed August 16. Since then, the stock has been building a clean a-b-c correction, where the c should bottom in the area between the 0.618 retracement ($81.36) and the 0.786 retracement ($75.52), and then sustainably rise in a wave (3).

Paypal: Pay up for thisPayPal - Short Term - We look to Buy at 89.71 (stop at 84.43)
Broken out of the channel formation to the upside. We have a Gap open at 89.63 from 02/08/2022 to 03/08/2022. We have a 38.2% Fibonacci pullback level of 89.84 from 103.03 to 68.51. Preferred trade is to buy on dips.
Our profit targets will be 116.91 and 152.00
Resistance: 103.03 / 117.20 / 122.92
Support: 89.84 / 80.22 / 76.71
Disclaimer – Saxo Bank Group. Please be reminded – you alone are responsible for your trading – both gains and losses. There is a very high degree of risk involved in trading. The technical analysis, like any and all indicators, strategies, columns, articles and other features accessible on/though this site (including those from Signal Centre) are for informational purposes only and should not be construed as investment advice by you. Such technical analysis are believed to be obtained from sources believed to be reliable, but not warrant their respective completeness or accuracy, or warrant any results from the use of the information. Your use of the technical analysis, as would also your use of any and all mentioned indicators, strategies, columns, articles and all other features, is entirely at your own risk and it is your sole responsibility to evaluate the accuracy, completeness and usefulness (including suitability) of the information. You should assess the risk of any trade with your financial adviser and make your own independent decision(s) regarding any tradable products which may be the subject matter of the technical analysis or any of the said indicators, strategies, columns, articles and all other features.
Please also be reminded that if despite the above, any of the said technical analysis (or any of the said indicators, strategies, columns, articles and other features accessible on/through this site) is found to be advisory or a recommendation; and not merely informational in nature, the same is in any event provided with the intention of being for general circulation and availability only. As such it is not intended to and does not form part of any offer or recommendation directed at you specifically, or have any regard to the investment objectives, financial situation or needs of yourself or any other specific person. Before committing to a trade or investment therefore, please seek advice from a financial or other professional adviser regarding the suitability of the product for you and (where available) read the relevant product offer/description documents, including the risk disclosures. If you do not wish to seek such financial advice, please still exercise your mind and consider carefully whether the product is suitable for you because you alone remain responsible for your trading – both gains and losses.

PYPL - Approaching SupportLike many stocks today, PYPL looking to test next support at the 93.5 area. Good for short term entry on EMA21 level and target profit around 100-102 IF this level holds. will look for support and RSI crossover from below 20 to the upside. If fails, could fill down the gap/window to the 90 - 89 area.

Mmm I think I am bearish now but wait is for a couple of days.Not a financial advise.
I see the double top on the hourly chart and the rsi practically dead.
Pump & Dump may be...
I see $PYPL falling to the $90s levels.
Let's see what happens next.

ROBINHOOD (HOOD) LONG!!!!We are coming down into the 4th wave correction to our green region, which where we will then see a push-up to higher highs. Targeting near $13

Why PayPal ( $PYPL) is one of my TOP long call "position trades"Why I like PayPal PYPL
Back to 2017 levels, pretty much "recession proof" (give or take). It's almost God sent being down at these levels (undervalued/fair value). There are some strikes that are def. set up for nicely profitable positions if chosen correctly, common shares as well. Though I hid a lot of my indicators for a simple view, there is def. a divergence between price and RSI on both the Daily & Weekly, as well as the Monthly looking pretty bottomed out. I am pretty big into Harmonic patterns , but am not going to share my "secret sauce", at this current time.
I will continue to add to my position and average down (as planned) into further out strike dates. I as well will MOST LIKELY play the short term trends as well, but my overall goal is to see at least $115.00 with my "position trade" call contracts.
I typically leaves these "ideas" pretty brief on Trading View as I don't really have a BIG following on here
If you have any questions about my "idea" feel free to reach out!
(This is a repost as I had some community violations I was unaware about)

PYPL: Can Hedgie change fortunes?PayPal
Short Term - We look to Buy at 78.86 (stop at 71.88)
Activist hedge fund Elliot Management reported to have increased stake. Price jumped 6% in premarket. Although the bears are in control, the stalling negative momentum indicates a turnaround is possible. There is scope for mild selling at the open but losses should be limited. We look to buy dips. Further upside is expected.
Our profit targets will be 99.79 and 104.00
Resistance: 100.00 / 123.00 / 154.00
Support: 75.00 / 60.00 / 40.00
Please be advised that the information presented on TradingView is provided to Vantage (‘Vantage Global Limited’, ‘we’) by a third-party provider (‘Signal Centre’). Please be reminded that you are solely responsible for the trading decisions on your account. There is a very high degree of risk involved in trading. Any information and/or content is intended entirely for research, educational and informational purposes only and does not constitute investment or consultation advice or investment strategy. The information is not tailored to the investment needs of any specific person and therefore does not involve a consideration of any of the investment objectives, financial situation or needs of any viewer that may receive it. Kindly also note that past performance is not a reliable indicator of future results. Actual results may differ materially from those anticipated in forward-looking or past performance statements. We assume no liability as to the accuracy or completeness of any of the information and/or content provided herein and the Company cannot be held responsible for any omission, mistake nor for any loss or damage including without limitation to any loss of profit which may arise from reliance on any information supplied by Signal Centre.

PYPL, good for the long term?There are a lot of trendlines to act as resistance, but price down here is extremely appealing to me.
1-Above 75.28
2- Retest and rejection of lows at 68.65

$PYPL - Paypal Looks Setup Nice for a Gap FillSome things looking good here - and a lot of people are short. Lets see a lil gap fill.

Daily wolfe wave for SQThere is a daily wolfe wave setup that triggered on Jun 21 closing day at 60.52. The projected target is calculated by extending a linear line between pivot 1 and 4 and projecting the line. This is represented as the green perforated line, as shown in the chart. The projected target is 94.85 which is expected to reach this price target before July 6. Projected targets are defined by identifying the apex of the wolfe wave and projecting a vertical line toward the green perforated projection tgt which is extending from left to right. However, in this particular setup the underlying price of SQ under performs since the price did not achieve the forecasted target defined by the wolfe wave apex. The setup is valid until the stop loss is triggered. Two days after the apex, a daily ttm squeeze formed which is another bullish setup opportunity into Monday and Tuesday.

PYPL DAILY WOLFE WAVE SETUPThere is a daily wolfe wave setup. The projected target is calculated by extending a linear line between pivot 1 and 4 and projecting the line. This is represented as the green perforated line, as shown in the chart. The projected target is 84 which is expected to reach this price target anytime before earnings. There is also a gap that remains open. If markets trades green, the next few days, then PYPL may experience short term momentum that would attempt a gap fill at 84 before earnings. Stop loss consideration would be at 67.00.
