#PYR/USDT#PYR
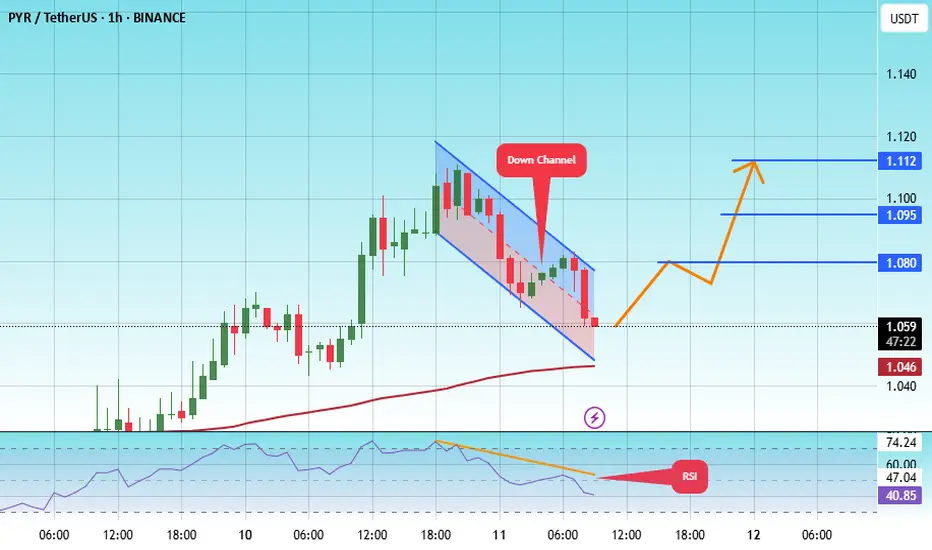
The price is moving within a descending channel on the 1-hour frame, adhering well to it, and is heading towards a strong breakout and retest.
We are experiencing a rebound from the lower boundary of the descending channel, which is support at 1.05.
We are experiencing a downtrend on the RSI indicator that is about to break and retest, supporting the upward trend.
We are heading towards stability above the 100 Moving Average.
Entry price: 1.06
First target: 1.08
Second target: 1.09
Third target: 1.11
Pyramiding
#PYR/USDT#PYR
The price is moving within a descending channel on the 1-hour frame, adhering well to it, and is heading for a strong breakout and retest.
We are experiencing a rebound from the lower boundary of the descending channel, which is support at 1.100.
We are experiencing a downtrend on the RSI indicator, which is about to break and retest, supporting the upward trend.
We are looking for stability above the 100 moving average.
Entry price: 1.130
First target: 1.174
Second target: 1.200
Third target: 1.259

#PYR/USDT#PYR
The price is moving within a descending channel on the 1-hour frame, adhering well to it, and is heading towards a strong breakout and retest.
We are seeing a bounce from the lower boundary of the descending channel, which is support at 1.13.
We are seeing a downtrend on the RSI indicator that is about to be broken and retested, supporting the upward trend.
We are looking for stability above the 100 moving average.
Entry price: 1.165
First target: 1.19
Second target: 1.23
Third target: 1.28

#PYR/USDT#PYR
The price is moving within a descending channel on the 1-hour frame, adhering well to it, and is heading for a strong breakout and retest.
We are experiencing a rebound from the lower boundary of the descending channel, which is support at 1.07.
We are experiencing a downtrend on the RSI indicator that is about to break and retest, supporting the upward trend.
We are heading for stability above the 100 Moving Average.
Entry price: 1.08
First target: 1.11
Second target: 1.14
Third target: 1.187

#PYR/USDT#PYR
The price is moving within a descending channel on the 1-hour frame and is expected to break and continue upward.
We have a trend to stabilize above the 100 moving average once again.
We have a downtrend on the RSI indicator that supports the upward move with a breakout.
We have a support area at the lower boundary of the channel at 1.05, which acts as strong support from which the price can rebound.
Entry price: 1.18
First target: 1.27
Second target: 1.37
Third target: 1.48

#PYR/USDT#PYR
The price is moving in a descending channel on the 1-hour frame and is adhering to it well and is heading to break it upwards strongly and retest it
We have a bounce from the lower limit of the descending channel, this support is at a price of 1.325
We have a downtrend on the RSI indicator that is about to break and retest, which supports the rise
We have a trend to stabilize above the 100 moving average
Entry price 1.390
First target 1.464
Second target 1.529
Third target 1.615

#PYR/USDT#PYR
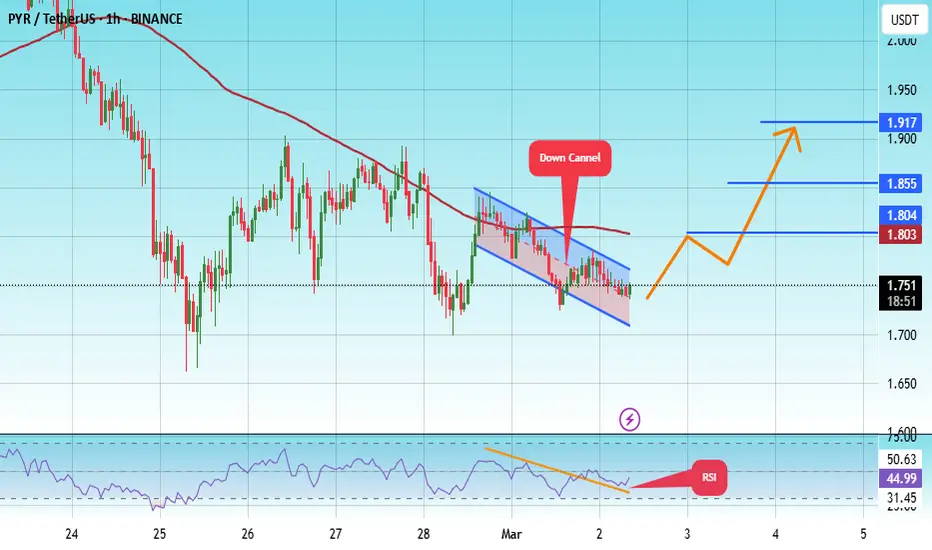
The price is moving in a descending channel on the 1-hour frame and is adhering to it well and is heading to break it upwards strongly and retest it
We have a bounce from the lower limit of the descending channel, this support is at a price of 1.72
We have a downtrend on the RSI indicator that is about to be broken and retested, which supports the rise
We have a trend to stabilize above the moving average 100
Entry price 1.73
First target 1.80
Second target 1.85
Third target 1.19
Ready to launch upwards#PYR
The price is moving in a descending channel on the 1-hour frame and is adhering to it well and is heading to break it strongly upwards
We have a bounce from the lower limit of the descending channel, this support is at a price of 2.44
We have a downtrend on the RSI indicator that is about to be broken, which supports the rise
We have a trend to stabilize above the moving average 100
Entry price 2.52
First target 2.70
Second target 2.80
Third target 3.03

#PYR/USDR#PYR
The price is moving in a descending channel on the 1-hour frame and is expected to continue upwards
We have a trend to stabilize above the moving average 100 again
We have a descending trend on the RSI indicator that supports the rise by breaking it upwards
We have a support area at the lower limit of the channel at a price of 3.30
Entry price 3.34
First target 3.40
Second target 3.50
Third target 3.60

#PYR/USDT#PYR
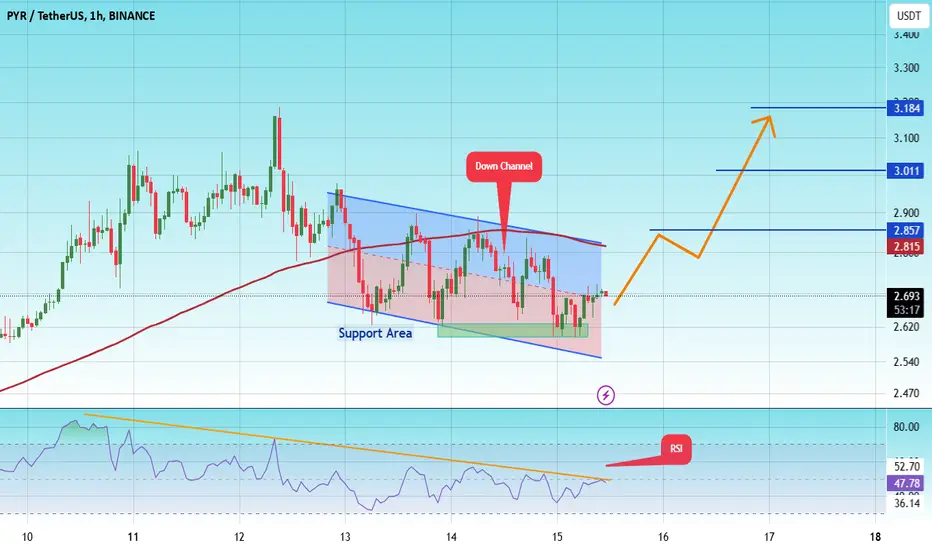
The price is moving in a descending channel on the 1-hour frame upwards and is expected to continue.
We have a trend to stabilize above the moving average 100 again.
We have a downtrend on the RSI indicator that supports the rise by breaking it upwards.
We have a support area at the lower limit of the channel at a price of
2.70
Entry price 2.70
First target 2.85
Second target 3.01
Third target 3.18
#PYR/USDT#PYR
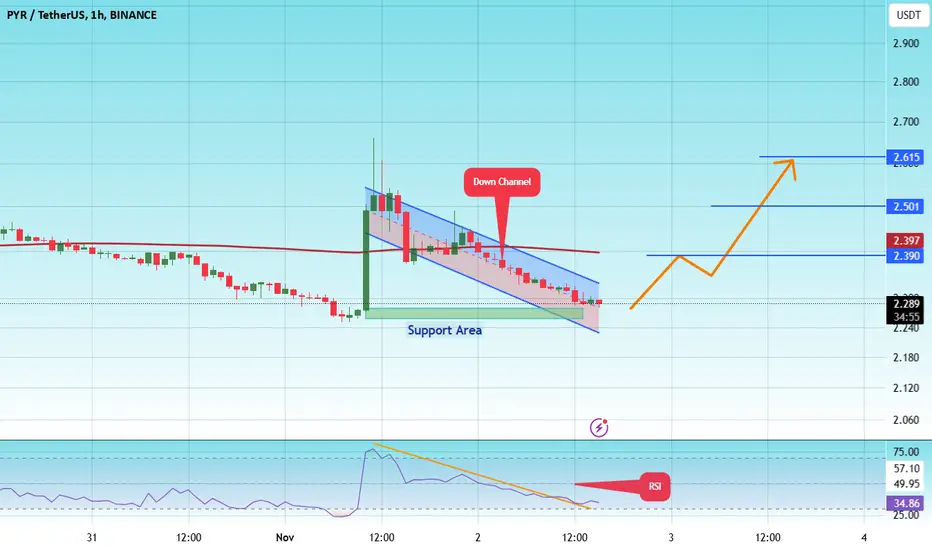
The price is moving in a descending channel on the 1-hour frame upwards and is expected to continue.
We have a trend to stabilize above the moving average 100 again.
We have a downtrend on the RSI indicator that supports the rise by breaking it upwards.
We have a support area at the lower limit of the channel at a price of
2.28
Entry price 2.28
First target 2.39
Second target 2.50
Third target 2.61
#PYR/USDT#PYR
The price is moving in a bearish channel pattern on the 4-hour frame and sticking to it well
The price rebounded well from the lower border of the channel at the green support level of 3.80
We have a tendency to stabilize above the Moving Average 100
We have oversold resistance on the RSI indicator to support the rise, with a downtrend about to break higher
Entry price is 4.00
The first goal is 4.45
Second goal 4.75
Third goal 5.28

#PYR/USDT#PYR
The price is moving in a triangle on the 12-hour frame and we have a support area in green at the 7.50 level
We have a higher stability moving average of 100
We have a good bounce being prepared from the lower border of the triangle once the downtrend is broken
The RSI indicator has a downtrend that is about to break higher
Entry price 7.93
First goal 9.53
Second goal 11.25
Third goal 13.00

PYRUSDT Strong Bullish!PYRUSDT Technical Analysis Update:
PYRUSDT has formed a channel pattern and has been ranging for the last 540 days. Once the price breaks out of this channel, we can expect a strong bullish momentum in PYR. we can anticipate a 100-300% upward move.
The PYRUSDT chart is similar to LINKUSDT, and recently, LINK's price went up more than 60% after a Channel breakout.
LINKUSDT Chart Below
Thanks
Hexa

gokaldas exports did pyramidAveraged up my position in GOKEX today at 816.
Prev. holding avg stands out at 510
Looks good for long term.
This is a pyramid position.

Close to use Darvas's boxes trategyTechnically:
H4 big desc. candle, closed below the support line.
No correction above 5%
H1 shows us accumulation in a narrow range
Bearish pattern
There are empty zone below.
Green dash line is an next support.
Nicholas Darvas wrote his book after he understood that when the price follows the trend there should be possibillities to increae your position at local stops. It like a train, going fwd, and at the stations you can join the trip. Next station we expect at the 838 (supp.from the Hune 15, confirmed Jun, 30) We have to be very careful about increasing our sells and should see the confirmations from the chart. like low corrections, small bars approaching the level, close retests of the level. In this case it will be allowed to double your position with correction of SL.

Bearish moodDaily:
Down trend, target price ~5.80 (5.90). The pair is in the channel after descending, no bullish signs from higher TF.
H4:
After fast descending from the 9.00 the price stopped at local support (~7.9). Usually after fast movement the price need some time for the rest, new traders will come in. Everyone see the levels, everyone is putting their stops and market orders in one place. Therefore it is quite usual, when the price will breakthrough res|sup with further backward moving...
As of today, we have to wait short signals (bearish patterns) of the cahrt to go deeper. Meanwhile we may start* to sell close to ~8.0, with SL above and increase our short at 7.73, 7.50
*Do not expect from the market that it will go as you plan, be in focus on real situation here and now. Manage risks and turn-off emotions.

Vulcan Forged PYRPYR/USDT now Resistance Zone broke and im waiting for breakout on this zone and i buy


Bitcoin's Falling Wedge; TO THE MOON? 🚀🚀On my previous post I provided an extremely accurate falling wedge, however it failed at the last moment, then I realized that it's because we're making a new pyramid thus making it a larger falling wedge, meaning we're still gonna break upwards.

How Do You Build A Position With Pyramiding?As a trader, it’s a general rule of thumb that we should always be looking to maximise potential returns (per unit of risk) with each transaction. We should always be looking to squeeze as much out of the market as we can.
There are times when this can occur by simply letting the trade run its course. However, sometimes market conditions align perfectly for savvy traders to “press the trade” or Pyramiding into the trade.
Don’t press your luck; press the trade instead!
Attempting multiple entries in the direction of a trend is one strategy savvy traders use in an attempt to maximise return (otherwise known as Pyramiding). The problem with this tactic is that while it may increase the potential reward, having a larger position in the market also opens you up to more risk. As a trader, you need to find the perfect balance of pressing the trade while not pressing your luck.
There are a few ways to achieve this:
If the market is moving at a snail’s pace, and not much movement has been made from the initial entry, any additional entry should be minor. If, however, a decent distance has been travelled, a trailing stop will secure more profit, and any additional entry can be larger. In essence, any additional position sizes are partly dependent on the distance between the initial entry position to stop loss.
Ensure you have a strong driver that pushes prices along. Simply pressing trades at random is not good risk management.
Reduce risk on entry by only adding additional positions when the stop loss on the first position can be trailed.
Pick your battles carefully when Pyramiding
You may find that as time wears on, you’re left with a large portion (>2% of total equity) in a single trade. The tactic of adding exposure will generally make for a “short” pyramid, which typically won’t grow over 2.5% of overall equity. This Pyramiding tactic ensures you’re exposed to additional upside while minimising downside to a level with which you’re comfortable.
Here are a few things to be wary of:
Keep an eye out for drivers that influence market psychology: This is when momentum and volatility will be high, allowing you to pyramid into a move more easily. For the technical traders, you may prefer to avoid day-to-day shifts by taking in a broader market view.
Diversify: as with any investment, don’t place all your eggs in one basket. Diversification is key to keeping overall risk low.
Have strict risk limits in place: With 2.5% in one pyramid, another 2.5% in another – next thing you know, your overall portfolio heat is close to 10%. That’s a high amount of risk to carry around with you. Consider minimising position sizes of certain trades to reduce overall risk.
Consistency is key with position sizes: If your initial entry is $100k and your second is $300k, you’re off to a lousy start in building your pyramid.
Final Thoughts on Pyramiding
Remember always to start small and slowly. There’s no need to rush in. Experiment with pyramiding until you’re comfortable with your approach. Always remember the two key elements to consider:
Resist the temptation to take profit early when the opportunity arises. Sometimes it’s best to sit on an existing trade.
Be wary of adding to your trade at “worse” levels. Trends will always end at a certain point, so you don’t want to be pyramiding into an extended, ongoing trend. Look for new trends to pyramid in, which will reduce your overall risk.

NEOUSD Target Price 63.62Next Target is 63.62. Trail Stop Loss. Look for price action signal Inside Bar on the lower time frame to enter another position.

Custom pyramid strategyHi all
I want to share a new approach I have been trying for the past year with great results.
Normally I would try to create a script that would create 100% trades, meaning that each emittet alert would sell 100% or buy 100%. I fell in love with the pyramid strategy because this keeps you in the market as much as possible but I was still missing something. In a standard pyramid strategy you would buy at several levels and then at some stage sell it all. And that works great in most situations but I saw several times that selling all could end up throwing you off the market at an early stage of a bull run. So I created my own custom pyramid strategy where the percentage of both sell and buy orders are based on volume and other indicators.
The percentage is calculated to be exponentially rising if orders of the same kind happens concurrently and then if an alert of an opposit order should emit then percentage of that order is calculated from the position in the major trend + the volume at the certain time.
This enables me to stay in the market and not miss out on major jumps. Granted that I might not have everything in the market at all time but I am never missing an opportunity. So I guess this is a matter of temper/risk at least. :) I prefer not having risked it all at once. How do you prefer to trade?
I have published a script to show the results from my findings (click the image below). This script shows how it works with BTC but it can be fitted to work with most of the major coins. It works best with the major coins because of the volume.
