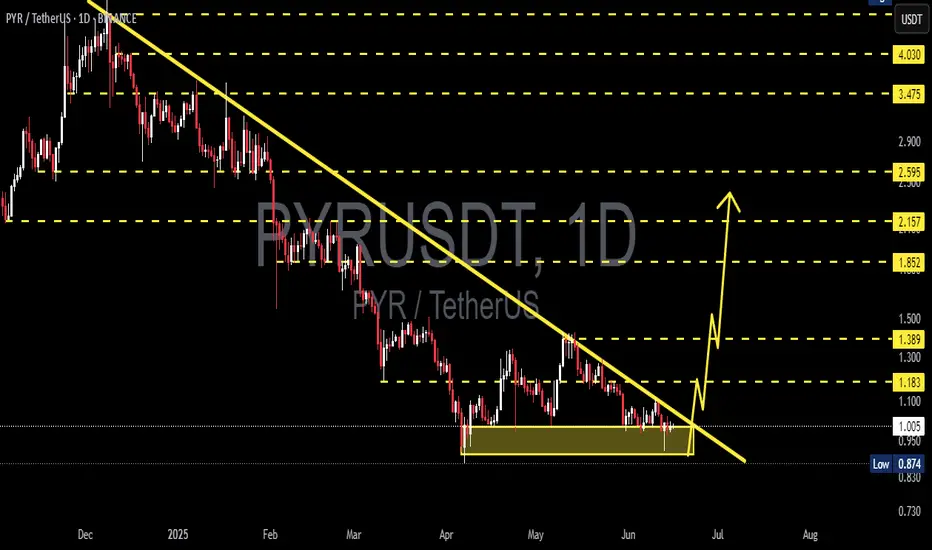
$PYRXRP Ready to Fly.XETR:PYR is testing a key downtrend line after months of accumulation around $0.78–$0.82.
A breakout here could signal a major reversal, with upside potential toward $4.70, over 400% gains.
Watch closely for confirmation.
DYOR, NFA
PYRUSDT

PYR/USDT Breaking the Downtrend? Major Reversal Setup Toward $2+
📌 Analysis Summary:
PYR/USDT is currently at a critical juncture after enduring a prolonged downtrend since December 2024. However, early signs of a major trend reversal are emerging as selling pressure weakens and a bullish pattern begins to form.
The price action has shaped a classic Falling Wedge — a well-known bullish reversal pattern. The declining volume, narrowing price action, and strong support zone indicate that a breakout may be imminent.
📊 Pattern: Falling Wedge (Bullish Reversal)
Descending Trendline: Consistent lower highs since December 2024 now being tested.
Volume Contraction: Typical of the final phase of accumulation before a breakout.
Solid Support Base: Formed at the $0.78–$0.83 area, with multiple bounces.
This pattern suggests that although the price has been declining, bearish momentum is fading, paving the way for a potential sharp move upward.
🚀 Bullish Scenario (Upside Reversal):
If PYR can break above the descending trendline and close above $0.95 with strong volume, it would confirm the breakout and open the path toward these key resistance levels:
1. $1.045 – Initial breakout target.
2. $1.10 – Psychological resistance.
3. $1.181 – Former support turned resistance.
4. $1.300 – Consolidation zone from earlier.
5. $1.382 – Fibonacci-based extension.
6. $2.148 – Mid-term target and key historical resistance.
7. $2.592 – $3.458 – Long-term target if the bullish trend fully unfolds.
📍 A daily candle close above $1.10 with strong volume would be a solid confirmation of trend reversal.
🔻 Bearish Scenario (Failed Reversal):
If the price fails to break above the trendline and faces rejection:
A retest of the $0.83–$0.78 support zone is likely.
A breakdown below $0.78 may lead to deeper lows (not visible on this chart).
Bearish momentum would strengthen further if BTC or the broader market sentiment turns negative.
📍 Bearish confirmation would occur on a strong breakdown below $0.78 with increasing sell volume.
🎯 Strategy & Key Insights:
Watch for a clean breakout with volume above the descending trendline.
Ideal setup for breakout traders or mid-term swing traders.
Excellent risk/reward ratio near the bottom of a long downtrend.
📈 Summary of Potential Upside Targets:
Target Type Price Level
Initial Breakout $1.045
Breakout Confirmation $1.10
Extension Target $1.181 - $1.382
Mid-Term Target $2.148
Long-Term Potential $2.592 – $3.458
🔥 Final Thoughts:
PYR/USDT is sitting at the edge of a breakout from a long-term downtrend, and if this Falling Wedge pattern plays out, it could mark the beginning of a powerful bullish phase. The upside potential is massive, with targets over 100% above the current level. However, caution is still needed — a rejection at the trendline could invalidate the bullish thesis. Watch this chart closely!
#PYR #PYRUSDT #CryptoBreakout #AltcoinReversal #FallingWedge #TechnicalAnalysis #BullishSetup #CryptoTrading #BreakoutTrade #AltcoinSeason

PYRUSDT 1D AnalysisPYR ~ 1D Analysis
#PYR Buy back gradually from here if you still have confidence in this coin with a short term target of at least 15%+
#PYR/USDT#PYR
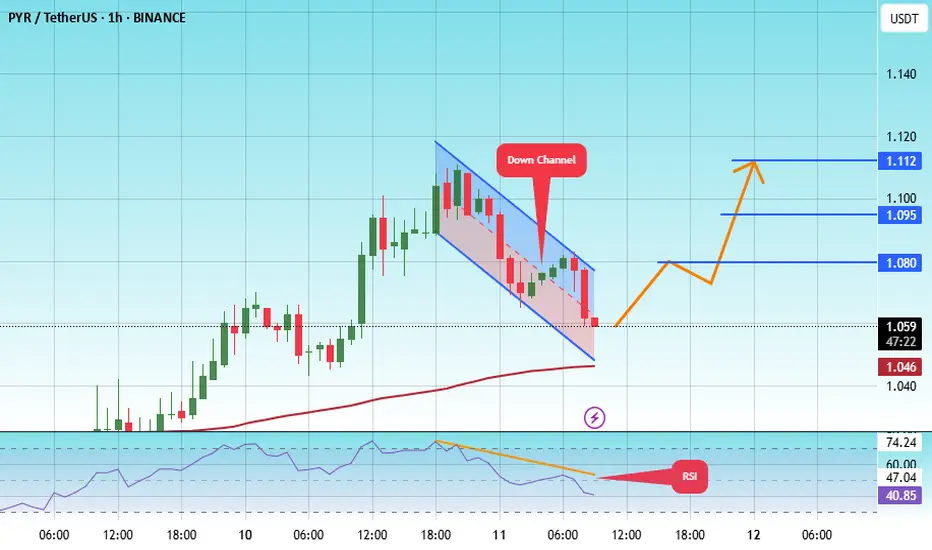
The price is moving within a descending channel on the 1-hour frame, adhering well to it, and is heading towards a strong breakout and retest.
We are experiencing a rebound from the lower boundary of the descending channel, which is support at 1.05.
We are experiencing a downtrend on the RSI indicator that is about to break and retest, supporting the upward trend.
We are heading towards stability above the 100 Moving Average.
Entry price: 1.06
First target: 1.08
Second target: 1.09
Third target: 1.11
#PYR/USDT#PYR
The price is moving within a descending channel on the 1-hour frame, adhering well to it, and is heading for a strong breakout and retest.
We are experiencing a rebound from the lower boundary of the descending channel, which is support at 1.100.
We are experiencing a downtrend on the RSI indicator, which is about to break and retest, supporting the upward trend.
We are looking for stability above the 100 moving average.
Entry price: 1.130
First target: 1.174
Second target: 1.200
Third target: 1.259

PYRUSDT 1D AnalysisPYR ~ 1D Analysis
#PYR Buy after successfully breaking through this resistance line with a short-term target of at least 10%++
#PYR/USDT#PYR
The price is moving within a descending channel on the 1-hour frame, adhering well to it, and is heading towards a strong breakout and retest.
We are seeing a bounce from the lower boundary of the descending channel, which is support at 1.13.
We are seeing a downtrend on the RSI indicator that is about to be broken and retested, supporting the upward trend.
We are looking for stability above the 100 moving average.
Entry price: 1.165
First target: 1.19
Second target: 1.23
Third target: 1.28

SOLUSDT UPDATE
Pattern: Falling Wedge Breakout
Current Price: \$173.38
Target Price: \$300
Target % Gain: 105.90%
Technical Analysis: SOL has broken out of a falling wedge pattern on the daily chart, indicating a bullish reversal. Strong momentum and breakout confirmation suggest a potential move towards the \$300 level.
Time Frame: 1D
Risk Management Tip: Always use proper risk management.

#PYR/USDT#PYR
The price is moving within a descending channel on the 1-hour frame, adhering well to it, and is heading for a strong breakout and retest.
We are experiencing a rebound from the lower boundary of the descending channel, which is support at 1.07.
We are experiencing a downtrend on the RSI indicator that is about to break and retest, supporting the upward trend.
We are heading for stability above the 100 Moving Average.
Entry price: 1.08
First target: 1.11
Second target: 1.14
Third target: 1.187

DEXEUSDT UPDATE
Pattern: Bullish Pennant Pattern
Current Price: $14.835
Target Price: $26.61
Target % Gain: 80.18%
Technical Analysis: DEXE has broken out of a descending triangle pattern on the 1D chart. The breakout is supported by a strong bullish candle and sustained price action above the trendline resistance, indicating momentum toward the target.
Time Frame: 1D
Risk Management Tip: Always use proper risk management.

SCRTUSDT UPDATE
SCRT Technical Setup
Pattern: Falling Wedge Breakout
Current Price: $0.2453
Target Price: $0.59
Target % Gain: 160.55%
Technical Analysis: SCRT has broken out of a falling wedge on the 1D chart, indicating a bullish reversal. The breakout is confirmed with strong green candles and volume build-up.
Time Frame: 1D
Risk Management Tip: Always use proper risk management.

KAVAUSDT UPDATEPattern: Falling Wedge Breakout
Current Price: $0.4567
Target Price: $0.74
Target % Gain: 60.53%
Technical Analysis: KAVA has broken out of a long-term falling wedge on the 1D chart, with strong bullish momentum and price closing above the trendline resistance. This breakout signals potential continuation toward the projected target.
Time Frame: 1D

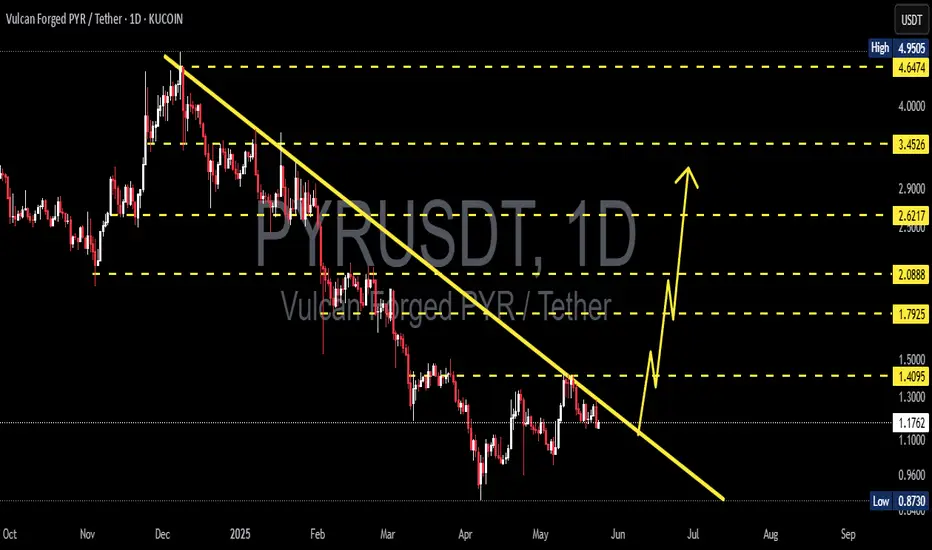
Vulcan Forged Late 2025 1340% & 2188% Potential Profits TargetsVulcan Forged is now on a broken downtrend. The highest volume ever comes after the All-Time Low. The session that produced this really high volume ended up red but the fact that the price is much higher (last week) compared to the ATL (7-April) means that PYRUSDT is now bullish.
Good evening my fellow Cryptocurrency trader, you will be surprised by the performance of this pair.
There are many pairs, many projects, many Altcoins; it is hard to choose, sometimes.
If we develop a plan and invest some time choosing becomes easy.
Choosing doesn't have a be mathematical left brain type of thing. It can be something more creative where you interact with the information that I share, you interact with the market and other traders; let what comes up come up and give it a deep look. Repeat over and over and you will be able to choose with a high level of certainty what is right for you.
There is a trick here. If you don't know what to choose, first, that's ok and it means you are not ready. Wait longer; read, read, read, read everything I share.
Keep reading and then it happens. You get the feeling and the feeling comes with a certainty, "I want to buy this pair." And that's one. Keep doing it until you reach 5 or 10, depending on your capital and plan of course. That's a start.
The trick is that there is no rush, you can take your time and it will work.
Nobody can pick for you, this would be a mistake. I can choose pairs for you, some people ask me which pairs they should buy, and somehow this never works, why? Because you are the one who is going to collect the profits or accept the loss, for this, you are the one that should invest the energy on what to buy and hold.
When you read the analysis, when you see the numbers, some will standout. Those that standout you mark with a check. When you are ready, you start choosing from your very own list of pairs.
You can wait and after sometime you will see many pairs going up. Say you didn't buy but you can easily recognize the ones that called your attention. Next time, when you get that feeling, that intuition, you know it is the right one.
You can also track those that didn't move or went the other way; what type of feelings did you have when you saw those pairs? When you get that feeling again, you know to stay away. It is a mental game.
If you can gain control of your mind, you can make the right decision. If you can make the right decision at the right time, money flows.
The money you make will depend 100% on your mindset, your efforts and the market as a whole.
Support the market, participate and eventually the market will reward with your desired results.
» Vulcan Forged (PYR) is bullish now. Still trading at bottom prices with huge potential for growth. Very strong targets can be seen on the chart.
Namaste.

#PYR/USDT#PYR
The price is moving within a descending channel on the 1-hour frame and is expected to break and continue upward.
We have a trend to stabilize above the 100 moving average once again.
We have a downtrend on the RSI indicator that supports the upward move with a breakout.
We have a support area at the lower boundary of the channel at 1.05, which acts as strong support from which the price can rebound.
Entry price: 1.18
First target: 1.27
Second target: 1.37
Third target: 1.48

ACEUSDT UPDATEACE/USDT Technical Setup
Pattern: Falling Wedge Breakout
Current Price: $0.635
Target Price: $1.714
Target % Gain: 250.34%
Technical Analysis: ACE has broken out of a long-term falling wedge pattern on the 1D chart with strong bullish momentum. Volume has increased significantly, confirming the breakout with potential for a 250% upside move.
Time Frame: 1D
Risk Management Tip: Always use proper risk management.

PYRUSDT 1DPYR ~ 1D Analysis
#PYR Buy after successfully penetrating this resistant line with a short -term target of at least 10%+ from here.

DEGOUSDT UPDATEDEGO/USDT Technical Setup
Pattern: Falling Wedge Breakout
Current Price: $1.808
Target Price: $3.70
Target % Gain: 115.05%
Technical Analysis: DEGO broke out of a falling wedge on the 1D chart, showing bullish momentum with a clean candle close above resistance and follow-through volume. Chart suggests potential continuation toward the measured target.
Time Frame: 1D
Risk Management Tip: Always use proper risk management.

SUPERUSDT UPDATESUPERUSDT is a cryptocurrency trading at $0.5519, with a target price of $1.2000. This represents a potential gain of over 170%. The technical pattern observed is a Bullish Falling Wedge, indicating a possible trend reversal. This pattern suggests that the downward trend may be coming to an end. A breakout from the wedge could lead to a significant upward movement in price. The Bullish Falling Wedge is a positive indicator, signaling a potential price surge. Investors are showing optimism about SUPERUSDT's future performance. The current price may present a buying opportunity. Reaching the target price would result in substantial returns for investors. SUPERUSDT is positioned for a potential breakout and significant gains.

STRAXUSDT UPDATESTRAXUSDT is a cryptocurrency trading at $0.04440, with a target price of $0.07000. This represents a potential gain of over 80%. The technical pattern observed is a Bullish Falling Wedge, indicating a possible trend reversal. This pattern suggests that the downward trend may be coming to an end. A breakout from the wedge could lead to a significant upward movement in price. The Bullish Falling Wedge is a positive indicator, signaling a potential price surge. Investors are showing optimism about STRAXUSDT's future performance. The current price may present a buying opportunity. Reaching the target price would result in substantial returns for investors. STRAXUSDT is positioned for a potential breakout and significant gains.

UNIUSDT UPDATEUNIUSDT is a cryptocurrency trading at $6.780. Its target price is $10.000, indicating a potential 50%+ gain. The pattern is a Bullish Falling Wedge, a reversal pattern signaling a trend change. This pattern suggests the downward trend may be ending. A breakout from the wedge could lead to a strong upward move. The Bullish Falling Wedge is a positive signal, indicating a potential price surge. Investors are optimistic about UNIUSDT's future performance. The current price may be a buying opportunity. Reaching the target price would result in significant returns. UNIUSDT is poised for a potential breakout and substantial gains.

KDAUSDT UPDATEKDAUSDT is a cryptocurrency trading at $0.4898. Its target price is $0.8000, indicating a potential 90%+ gain. The pattern is a Bullish Falling Wedge, a reversal pattern signaling a trend change. This pattern suggests the downward trend may be ending. A breakout from the wedge could lead to a strong upward move. The Bullish Falling Wedge is a positive signal, indicating a potential price surge. Investors are optimistic about KDAUSDT's future performance. The current price may be a buying opportunity. Reaching the target price would result in significant returns. KDAUSDT is poised for a potential breakout and substantial gains.

DOTUSDT IDEADOTUSDT is a cryptocurrency trading at $4.415. Its target price is $7.500, indicating a potential 70%+ gain. The pattern is a Bullish Falling Wedge, a reversal pattern signaling a trend change. This pattern suggests the downward trend may be ending. A breakout from the wedge could lead to a strong upward move. The Bullish Falling Wedge is a positive signal, indicating a potential price surge. Investors are optimistic about DOTUSDT's future performance. The current price may be a buying opportunity. Reaching the target price would result in significant returns. DOTUSDT is poised for a potential breakout and substantial gains.

GMXUSDT UPDATEGMXUSDT is a cryptocurrency trading at $15.52. Its target price is $30.00, indicating a potential 90%+ gain. The pattern is a Bullish Falling Wedge, a reversal pattern signaling a trend change. This pattern suggests the downward trend may be ending. A breakout from the wedge could lead to a strong upward move. The Bullish Falling Wedge is a positive signal, indicating a potential price surge. Investors are optimistic about GMXUSDT's future performance. The current price may be a buying opportunity. Reaching the target price would result in significant returns. GMXUSDT is poised for a potential breakout and substantial gains.
