#PYTH/USDT#PYTH
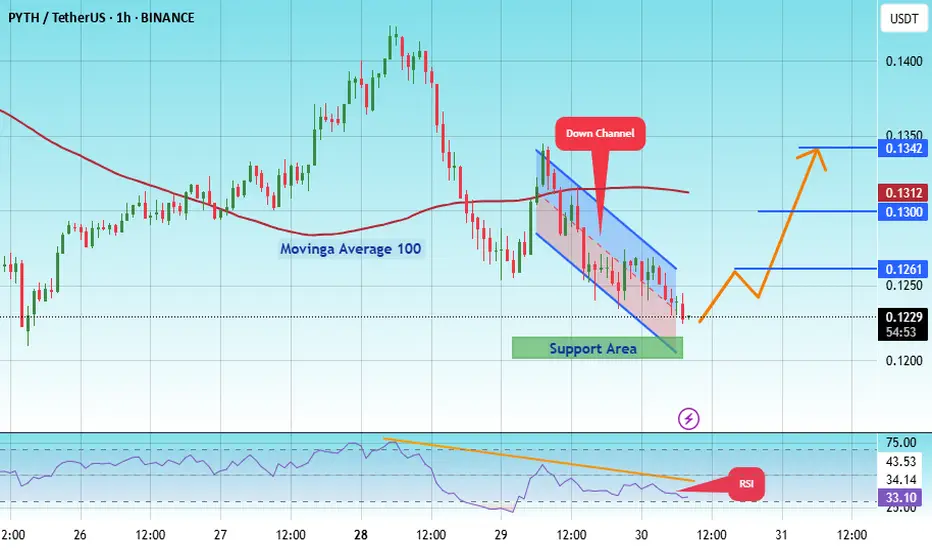
The price is moving within an ascending channel on the 1-hour frame, adhering well to it, and is on track to break it strongly upwards and retest it.
We have support from the lower boundary of the ascending channel, at 1215.
We have a downtrend on the RSI indicator that is about to break and retest, supporting the upside.
There is a major support area in green at 0.1200, which represents a strong basis for the upside.
Don't forget a simple thing: ease and capital.
When you reach the first target, save some money and then change your stop-loss order to an entry order.
For inquiries, please leave a comment.
We have a trend to hold above the 100 Moving Average.
Entry price: 0.1230
First target: 0.1261
Second target: 0.1300
Third target: 0.1342
Don't forget a simple thing: ease and capital.
When you reach your first target, save some money and then change your stop-loss order to an entry order.
For inquiries, please leave a comment.
Thank you.
Pyth
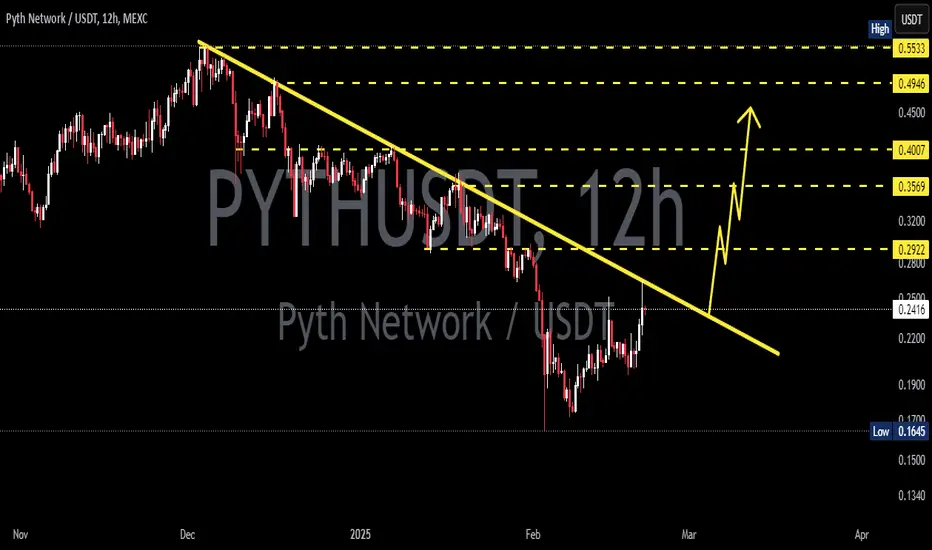
PYTH/USDT Breakout Watch Is the Accumulation Phase Finally Over?📌 Technical Overview:
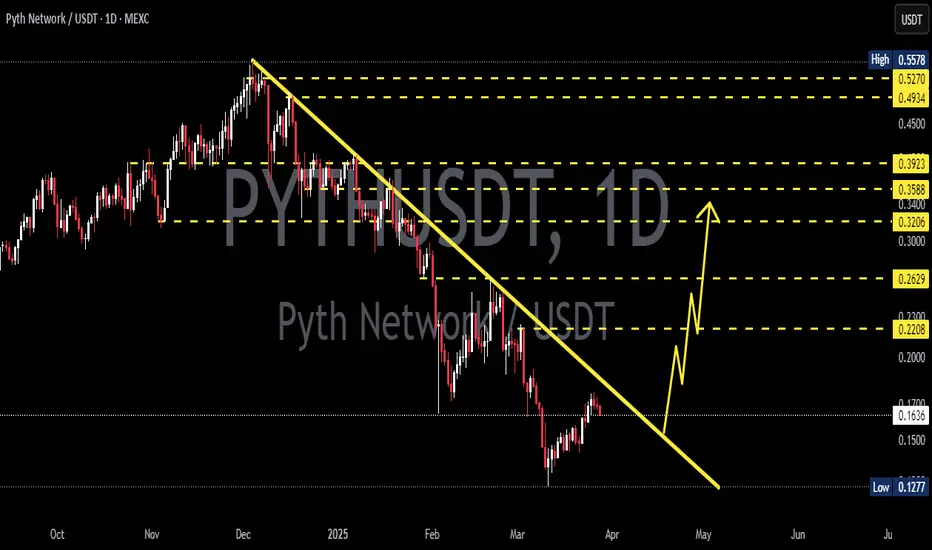
After nearly 8 months in a strong downtrend, PYTH/USDT is now showing signs of a potential trendline breakout. Price action is testing a critical descending resistance that has been respected since late 2024. This could be the turning point for a major trend reversal.
📉 Historical Context:
PYTH reached a high of $0.55, followed by a consistent downtrend with a series of lower highs and lower lows.
Since June 2025, however, the structure has shifted to higher lows, signaling early accumulation and waning bearish momentum.
📐 Technical Pattern: Descending Trendline Breakout
Price is currently challenging a long-term descending trendline, which has held as resistance since November 2024.
The pattern resembles a falling wedge/descending triangle breakout, typically viewed as a bullish reversal pattern.
A recent bullish candle is attempting to break above the $0.13 level, indicating growing momentum.
🟩 Bullish Scenario: The Reversal is On
If price closes above $0.13–$0.14 and confirms the breakout:
1. Short-Term Targets:
🔼 $0.1736 (Minor resistance / previous demand zone)
🔼 $0.1952 (Breakout retest zone)
2. Mid-Term Targets:
🔼 $0.2457 (Strong consolidation area)
🔼 $0.3196 – $0.3912 (Pre-breakdown range highs)
3. Long-Term Target:
🔼 $0.5258 – $0.5533 (Previous market top)
> A successful breakout could trigger a rally of +200–300%, especially if supported by market-wide bullish sentiment.
🟥 Bearish Scenario: Fakeout Risk
If price fails to hold above the trendline and drops below $0.12:
Support zones to watch:
🔽 $0.1000 (psychological level)
🔽 $0.0860
🔽 $0.0807 (major bottom support)
This would indicate a bull trap, and the market could return to a distribution phase.
🔍 Additional Confluences:
RSI is rising toward 60–65, suggesting bullish momentum is building.
Volume is increasing near the breakout — a good sign of trader interest.
A Golden Cross (EMA 50 crossing EMA 100) could occur soon if upside holds.
✅ Conclusion: Critical Pivot Zone
PYTH is testing a major inflection point. If confirmed, this breakout could end the long-term downtrend and launch a new bullish cycle. A rejection here, however, keeps the bear case alive.
#PYTHUSDT #PYTHBreakout #CryptoAnalysis #AltcoinSetup #TechnicalAnalysis #BreakoutCrypto #TradingView #TrendReversal #CryptoSignals #FallingWedge #BullishMomentum

#PYTH/USDT pump to $ 0.1025soon!#PYTH
The price is moving within a descending channel on the 1-hour frame, adhering well to it, and is on its way to breaking it strongly upwards and retesting it.
We have a bounce from the lower boundary of the descending channel. This support is at 0.0938.
We have a downtrend on the RSI indicator that is about to break and retest, supporting the upside.
There is a major support area in green at 0.0920, which represents a strong basis for the upside.
Don't forget a simple thing: ease and capital.
When you reach the first target, save some money and then change your stop-loss order to an entry order.
For inquiries, please leave a comment.
We have a trend to hold above the 100 Moving Average.
Entry price: 0.0950
First target: 0.0970
Second target: 0.0993
Third target: 0.1025
Don't forget a simple thing: ease and capital.
When you reach the first target, save some money and then change your stop-loss order to an entry order.
For inquiries, please leave a comment.
Thank you.

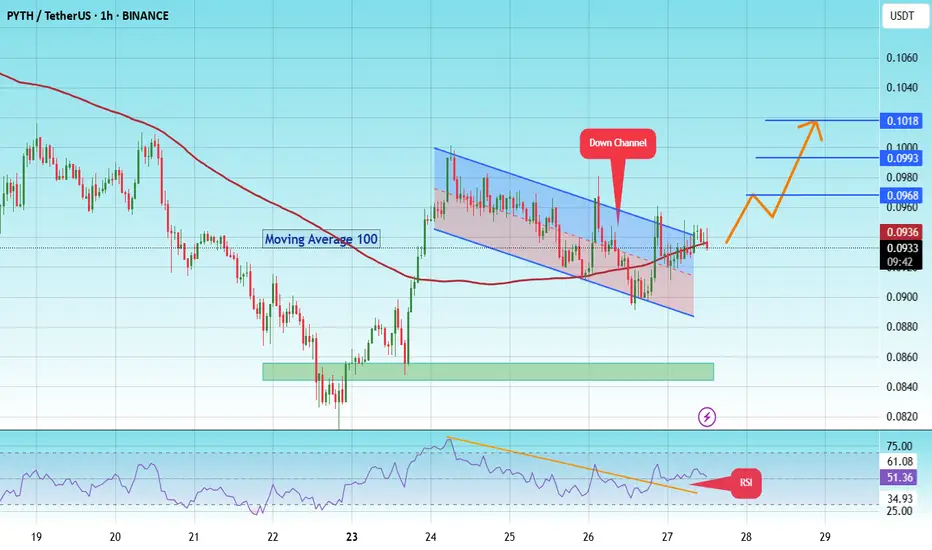
Pyth pump to $0.1018 soon! #PYTH
The price is moving within a descending channel on the 1-hour frame and is expected to break and continue upward.
We have a trend to stabilize above the 100 moving average once again.
We have a downtrend on the RSI indicator that supports the upward break.
We have a support area at the lower boundary of the channel at 0.0895, acting as strong support from which the price can rebound.
We have a major support area in green that pushed the price upward at 0.085.
Entry price: 0.0936
First target: 0.0968
Second target: 0.0993
Third target: 0.1018
To manage risk, don't forget stop loss and capital management.
When you reach the first target, save some profits and then change the stop order to an entry order.
For inquiries, please comment.
Thank you.
PYTH NETWORK (PYTHUSD) - (10X - 50X Potential)Pyth Network is an oracle protocol originally built for Solana, optimized for ultra-low latency and first-party data directly from exchanges and market makers. Unlike Chainlink’s node-aggregator model, Pyth enables real-time price feeds (as fast as 400ms) sourced directly from over 100 institutional providers, including Binance and Cboe.
🧩 Why Pyth?
DeFi apps need fast, accurate pricing to avoid exploits and ensure fair trading. Pyth delivers high-frequency, high-integrity data, especially valuable for derivatives, perpetuals, and high-speed DeFi protocols.
🌐 Massive Expansion
What started on Solana now powers 100+ blockchains, including Ethereum L2s, Cosmos, Sui, Aptos, TON, and more. As of 2025, over 420 protocols integrate Pyth, with over $48B+ monthly trading volume secured. It has become the #2 oracle in DeFi by usage, dominating ecosystems like Solana, Sui, and Injective.
📊 Tokenomics & Unlocks
Max supply: 10B PYTH
Circulating: ~5.75B (mid-2025)
Next major unlock: May 2026 (~2.1B tokens)
Utility: Governance, staking, publisher rewards, and oracle integrity
Pyth’s decentralized governance is growing, with a DAO now guiding key protocol parameters. It’s also expanding beyond price feeds, launching products like randomness (Entropy) and MEV mitigation tools (Express Relay).
Disclaimer: This is not financial advice. Always do your own research before making investment decisions.
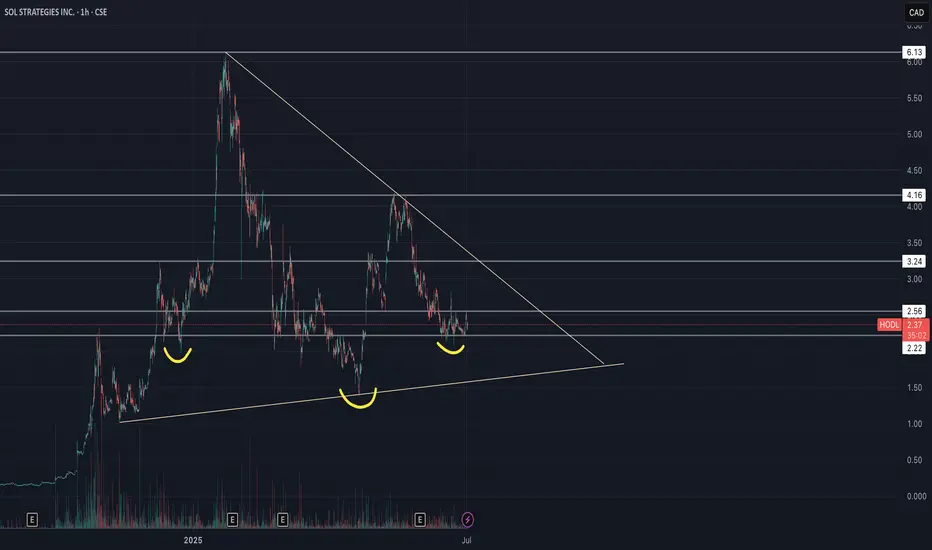
Sol Strategies Inc (HODL) - Inverse H&S🚀 SOL Strategies (HODL) – Public Market Gateway to Solana Yield
SOL Strategies (CSE: HODL) is a publicly traded company laser-focused on the Solana ecosystem. With nearly 395,000 SOL held (most of it staked) and over 3.7 million SOL delegated to their validators, they generate consistent income through staking rewards and validator commissions.
Their business model is simple:
📌 Accumulate SOL → Stake it → Run institutional-grade validators → Earn yield
📌 Expand through partnerships (3iQ, Neptune, BitGo, Pudgy Penguins)
📌 Hold strategic Solana ecosystem tokens like JTO and jitoSOL
📌 Operate with SOC 2-certified infrastructure and pursue a Nasdaq listing
SOL Strategies is not just holding crypto – they are building core infrastructure for Solana, giving equity investors direct exposure to staking economics in one of the fastest-growing blockchain networks.
📊 For traders: HODL stock offers a pure-play vehicle for Solana exposure, with an income-generating twist.
⚠️ Always do your own investment research and make your own decisions before investing.
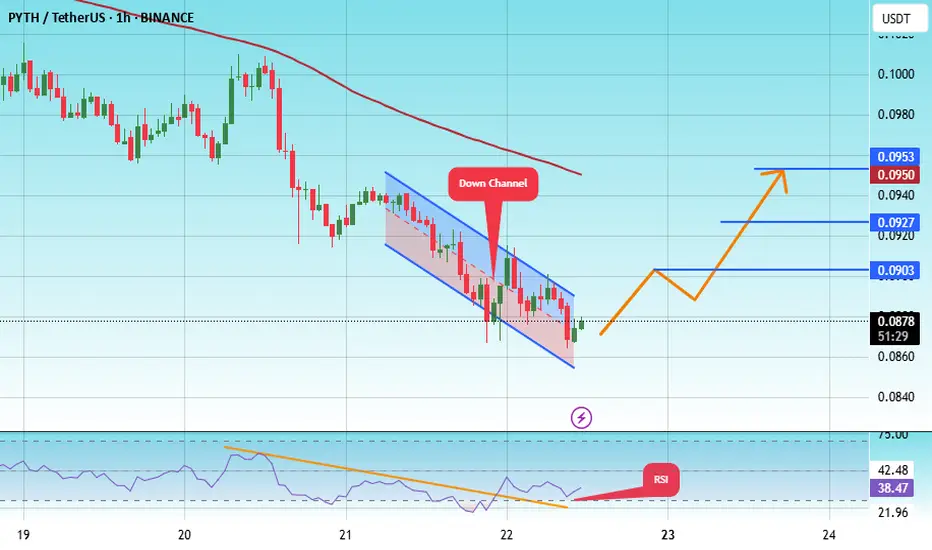
#PYTH/USDT#PYTH
The price is moving within a descending channel on the 1-hour frame, adhering well to it, and is heading for a strong breakout and retest.
We are seeing a bounce from the lower boundary of the descending channel, which is support at 0.0860.
We have a downtrend on the RSI indicator that is about to be broken and retested, supporting the upward trend.
We are looking for stability above the 100 moving average.
Entry price: 0.0880
First target: 0.0903
Second target: 0.0927
Third target: 0.0950
#PYTH/USDT#PYTH
The price is moving within a descending channel on the 1-hour frame, adhering well to it, and is heading toward a strong breakout and retest.
We are experiencing a rebound from the lower boundary of the descending channel. This support is at 0.1030.
We have a downtrend on the RSI indicator that is about to be broken and retested, supporting the upward trend.
We are heading toward stability above the 100 moving average.
Entry price: 0.1080
First target: 0.1111
Second target: 0.1140
Third target: 0.1180

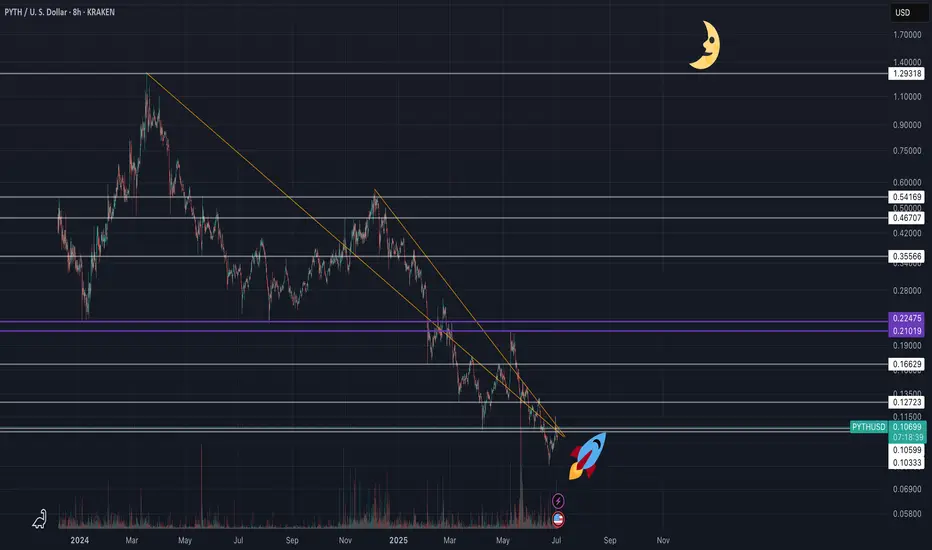
HUGE INCREASES Possible on PYT | Here's WhyPython is a fairly new altcoin with big upside.
From the earlier two charts on the left, we see that initial downturns shouldn't be feared. Historically, SOL and SUI started with downtrends and transitioned into massive upside alts.
Python might especially see parabolic increases, once ETH starts to move towards a new ATH. This will be due to the rotation of liquidity between altcoins in terms of larger and smaller market caps.
Don't miss yesterdays update on ETH!
____________________________
BINANCE:SOLUSDT
COINBASE:SUIUSD
BINANCE:PYTHUSDT

#PYTH/USDT#PYTH
The price is moving within a descending channel on the 1-hour frame, adhering well to it, and is heading for a strong breakout and retest.
We are seeing a bounce from the lower boundary of the descending channel, which is support at 0.1270.
We have a downtrend on the RSI indicator that is about to be broken and retested, supporting the upward trend.
We are looking for stability above the 100 moving average.
Entry price: 0.1280
First target: 0.1322
Second target: 0.1350
Third target: 0.1400

PYTHUSDT | Short Zone at the Blue Box—Proceed with Extra CautionPYTHUSDT is pressing lower with conviction, and the blue box marks our primary area to consider short entries. Although buyers are technically present, their support feels fragile; every test of this zone risks failing unless you have a strong appetite for heightened risk.
Why the Blue Box Matters
• Price has paused here before, making it a logical spot for sellers to reemerge.
• The current decline suggests sellers are in control and likely to defend this zone again.
Conditions for a Short Entry
Lower‑Time‑Frame Breakdown
Observe a clear breakdown pattern on shorter charts—whether a series of lower highs or a decisive support breach.
Volume Confirmation
Seek evidence that selling volume outpaces buying volume as price approaches the blue box.
CDV Divergence
Confirm that cumulative delta volume does not support the rally, indicating genuine exhaustion among buyers.
Entering here demands extra conviction and precise execution. If these confirmations line up, a short trade could offer favorable risk‑reward. Without them, it is wiser to watch from the sidelines until a clearer setup emerges.
📌I keep my charts clean and simple because I believe clarity leads to better decisions.
📌My approach is built on years of experience and a solid track record. I don’t claim to know it all but I’m confident in my ability to spot high-probability setups.
📌If you would like to learn how to use the heatmap, cumulative volume delta and volume footprint techniques that I use below to determine very accurate demand regions, you can send me a private message. I help anyone who wants it completely free of charge.
🔑I have a long list of my proven technique below:
🎯 ZENUSDT.P: Patience & Profitability | %230 Reaction from the Sniper Entry
🐶 DOGEUSDT.P: Next Move
🎨 RENDERUSDT.P: Opportunity of the Month
💎 ETHUSDT.P: Where to Retrace
🟢 BNBUSDT.P: Potential Surge
📊 BTC Dominance: Reaction Zone
🌊 WAVESUSDT.P: Demand Zone Potential
🟣 UNIUSDT.P: Long-Term Trade
🔵 XRPUSDT.P: Entry Zones
🔗 LINKUSDT.P: Follow The River
📈 BTCUSDT.P: Two Key Demand Zones
🟩 POLUSDT: Bullish Momentum
🌟 PENDLEUSDT.P: Where Opportunity Meets Precision
🔥 BTCUSDT.P: Liquidation of Highly Leveraged Longs
🌊 SOLUSDT.P: SOL's Dip - Your Opportunity
🐸 1000PEPEUSDT.P: Prime Bounce Zone Unlocked
🚀 ETHUSDT.P: Set to Explode - Don't Miss This Game Changer
🤖 IQUSDT: Smart Plan
⚡️ PONDUSDT: A Trade Not Taken Is Better Than a Losing One
💼 STMXUSDT: 2 Buying Areas
🐢 TURBOUSDT: Buy Zones and Buyer Presence
🌍 ICPUSDT.P: Massive Upside Potential | Check the Trade Update For Seeing Results
🟠 IDEXUSDT: Spot Buy Area | %26 Profit if You Trade with MSB
📌 USUALUSDT: Buyers Are Active + %70 Profit in Total
🌟 FORTHUSDT: Sniper Entry +%26 Reaction
🐳 QKCUSDT: Sniper Entry +%57 Reaction
📊 BTC.D: Retest of Key Area Highly Likely
📊 XNOUSDT %80 Reaction with a Simple Blue Box!
📊 BELUSDT Amazing %120 Reaction!
📊 Simple Red Box, Extraordinary Results
I stopped adding to the list because it's kinda tiring to add 5-10 charts in every move but you can check my profile and see that it goes on..

PYTH bleeding out.. time to accumulate?PYTH is desperately looking for support after a massive unlock selloff. These are moments when convictions are tested. In addition, this is where RR is best.
Full TA: Link in the BIO
PYTH 4H ANALYSIS – Bullish Setup in PlayAfter completing a 5-wave impulse to the downside, PYTH has shown signs of a trend reversal. The first upward impulse displayed a clear 5-wave Elliott structure, breaking out of the descending channel — a strong bullish signal.
Following this, a classic A-B-C zig-zag correction occurred, which acted as a retest of the broken channel resistance, now turned support. This confluence increases the probability of a bullish continuation.
With market structure aligning and correction likely complete, PYTH is showing potential for a 50%+ move to the upside.
🟢 Entry Zone: 0.1400 – 0.1500
🔴 Stop Loss: 0.1272 (Below wave C & structural support)
🎯 Target Price: 0.2235
💡 Note: Always manage your risk and confirm with your own analysis before entering any trade.

inverse head & shoulder ???on May 20th PYTH will release 28% token unlock. then 71% will be out.
looking for 0.1420 and 0.1350 if lucky.
.40 in July ???

Dips in uptrends are opportunities. PYTH dipping down to support is a great time to DCA. The volume below is an opportunity to find liquidity to be taken or to find buyers to defend their positions.
Full TA: Link in the BIO


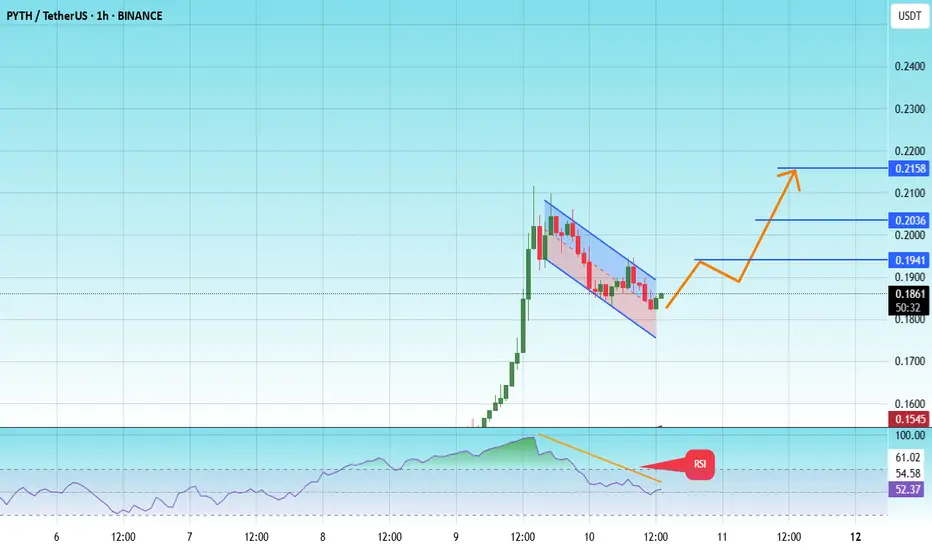
#PYTH/USDT#PYTH
The price is moving within a descending channel on the 1-hour frame and is expected to break and continue upward.
We have a trend to stabilize above the 100 moving average once again.
We have a downtrend on the RSI indicator that supports the upward move with a breakout.
We have a support area at the lower limit of the channel at 0.1800, which acts as strong support from which the price can rebound.
Entry price: 0.1860
First target: 0.1941
Second target: 0.2036
Third target: 0.2160
PYTH: Completed Double Combo#Pyth has been in a bearish trend since Mar 2024, partly due to poor tokenomics.
However, it seems to have completed a double combo correction, that potentially ended with a bounce from the trend-based Fib extension at $0.10 which could be a possible bottom for this token.

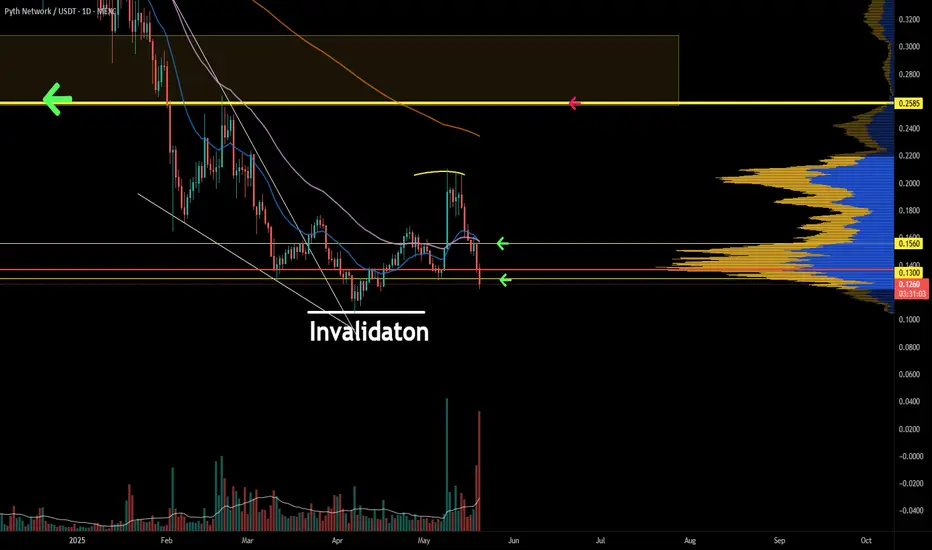
Pyth: Your Altcoin ChoicePyth hit a new All-Time Low 7th April 2025, this is likely the market bottom. There is truly no need for the market to continue lower and lower. Remember, the market cannot kill itself nor has any intention to do so. The market always looks for balance.
Now that many players are down and in the red, the market will seek balance by growing and producing gains. At one point, the market takes everything away. At a later stage, the market gives and gives, you'll see... We are about to enter the bullish phase.
» PYTHUSDT just hit bottom recently and conventional analysts would read this as bearish. To me, bearish is when there is potential for lower prices. Bullish when there is potential for growth.
» PYTHUSDT is bullish in the sense that there is huge growth potential. It isn't bearish because the potential for it to go lower is so small, so small that it is almost irrelevant or not worth our attention. If there were to be anymore bearish action, it would be short-lived. Bullish action on the other hand, can go for years to come. A new All-Time High and beyond.
» PYTHUSDT is showing an ending diagonal pattern in Elliott terms, this is a reversal pattern. This pattern is combined with a bullish divergence with the RSI. Both these signals are combined with a very strong volume rise. The RSI reading is relatively strong.
All these signals combined tells us that the market is ready to turn. Not all happens in a single day, remember. It grows slowly, the momentum, and after several months we get a strong advance, a bullish jump. Think back of late 2024.
August 2024 was the bottom, relate this to April 2025.
From August 2024 the market went sideways and started to build up strength while printing higher lows. 2 months, in November, the market produced a very strong bullish jump.
The same again. Two months, April and May, or May and June and then a strong bullish jump. Allow for variations, but regardless of the fluctuations between pairs and projects, overall, we are going up. We are about to experience massive growth. Just watch!
Thanks a lot for your continued support.
Another great project & Altcoin Choice.
Namaste.

PYTHUSDT 1DPYTH ~ 1D Analysis
#PYTH Buy gradually after successfully penetrating this resistant line with a short -term target of at least 10%+.
PYTH is bullishBINANCE:PYTHUSDT
PYTH bounced from very strong support
Entry 0.40
Target 0.60
Stop 0.25

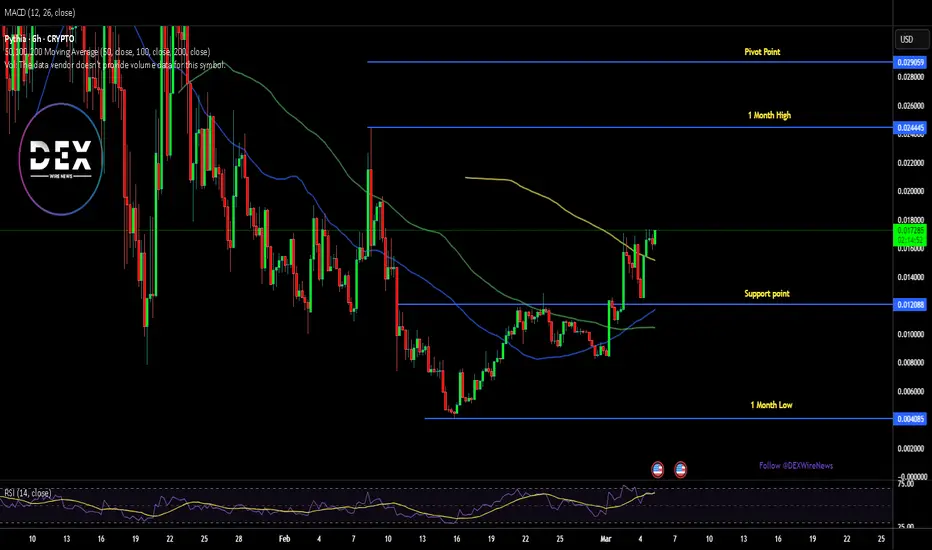
$PYTHIA Set to Surge 40% Amidst A Bullish Engulfing PatternThe Solana memecoin Pythia known as the world's first rat connected to AI that represents a symbiosis of biology and technology, resulting from merging a live brain with a neural interface and AI, is set to breakout with a 40% surge amidst a bullish engulfing pattern.
The memecoin recently broke out of a falling wedge pattern that resorted to this engulfing move.
In the case of a pullback, the 61.5% Fibonacci retracement level is serving as key support point for $PYTHIA. similarly, a breakout above the 1-month high pivot could pave the way for massive surge in the long term.
Pythia Price Live Data
The live Pythia price today is $0.016800 USD with a 24-hour trading volume of $915,707 USD. We update our PYTHIA to USD price in real-time. Pythia is up 13.27% in the last 24 hours with a live market cap of $16,799,482 USD. It has a circulating supply of 999,982,135 PYTHIA coins and a max. supply of 1,000,000,000 PYTHIA coins.
PYTHUSDT 12HPYTH ~ 12H Analysis
#PYTH Pay attention to this coin. Buy after successfully penetrating this resistant line with a short -term target of at least 10%+.