#PYTH/USDT#PYTH
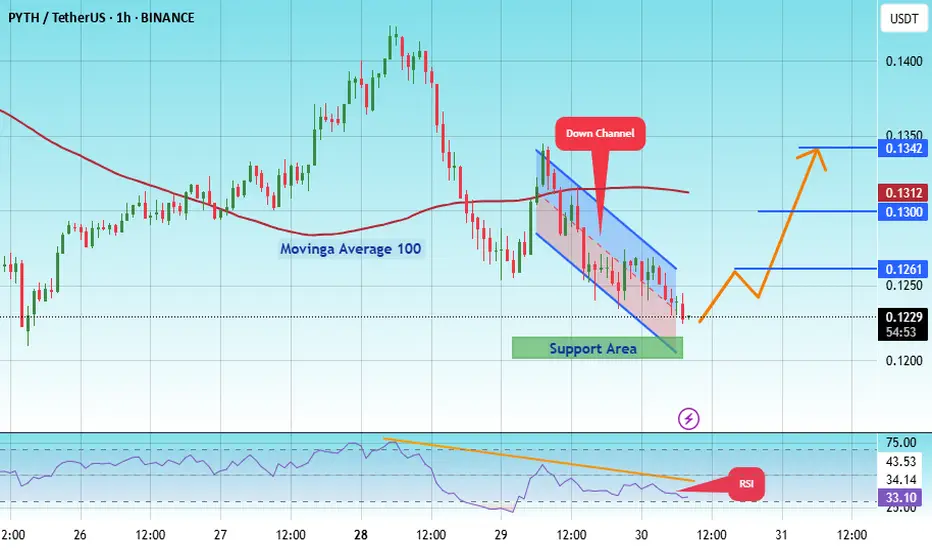
The price is moving within an ascending channel on the 1-hour frame, adhering well to it, and is on track to break it strongly upwards and retest it.
We have support from the lower boundary of the ascending channel, at 1215.
We have a downtrend on the RSI indicator that is about to break and retest, supporting the upside.
There is a major support area in green at 0.1200, which represents a strong basis for the upside.
Don't forget a simple thing: ease and capital.
When you reach the first target, save some money and then change your stop-loss order to an entry order.
For inquiries, please leave a comment.
We have a trend to hold above the 100 Moving Average.
Entry price: 0.1230
First target: 0.1261
Second target: 0.1300
Third target: 0.1342
Don't forget a simple thing: ease and capital.
When you reach your first target, save some money and then change your stop-loss order to an entry order.
For inquiries, please leave a comment.
Thank you.
PYTHUSD
PYTH/USDT Breakout Watch Is the Accumulation Phase Finally Over?📌 Technical Overview:
After nearly 8 months in a strong downtrend, PYTH/USDT is now showing signs of a potential trendline breakout. Price action is testing a critical descending resistance that has been respected since late 2024. This could be the turning point for a major trend reversal.
📉 Historical Context:
PYTH reached a high of $0.55, followed by a consistent downtrend with a series of lower highs and lower lows.
Since June 2025, however, the structure has shifted to higher lows, signaling early accumulation and waning bearish momentum.
📐 Technical Pattern: Descending Trendline Breakout
Price is currently challenging a long-term descending trendline, which has held as resistance since November 2024.
The pattern resembles a falling wedge/descending triangle breakout, typically viewed as a bullish reversal pattern.
A recent bullish candle is attempting to break above the $0.13 level, indicating growing momentum.
🟩 Bullish Scenario: The Reversal is On
If price closes above $0.13–$0.14 and confirms the breakout:
1. Short-Term Targets:
🔼 $0.1736 (Minor resistance / previous demand zone)
🔼 $0.1952 (Breakout retest zone)
2. Mid-Term Targets:
🔼 $0.2457 (Strong consolidation area)
🔼 $0.3196 – $0.3912 (Pre-breakdown range highs)
3. Long-Term Target:
🔼 $0.5258 – $0.5533 (Previous market top)
> A successful breakout could trigger a rally of +200–300%, especially if supported by market-wide bullish sentiment.
🟥 Bearish Scenario: Fakeout Risk
If price fails to hold above the trendline and drops below $0.12:
Support zones to watch:
🔽 $0.1000 (psychological level)
🔽 $0.0860
🔽 $0.0807 (major bottom support)
This would indicate a bull trap, and the market could return to a distribution phase.
🔍 Additional Confluences:
RSI is rising toward 60–65, suggesting bullish momentum is building.
Volume is increasing near the breakout — a good sign of trader interest.
A Golden Cross (EMA 50 crossing EMA 100) could occur soon if upside holds.
✅ Conclusion: Critical Pivot Zone
PYTH is testing a major inflection point. If confirmed, this breakout could end the long-term downtrend and launch a new bullish cycle. A rejection here, however, keeps the bear case alive.
#PYTHUSDT #PYTHBreakout #CryptoAnalysis #AltcoinSetup #TechnicalAnalysis #BreakoutCrypto #TradingView #TrendReversal #CryptoSignals #FallingWedge #BullishMomentum

#PYTH/USDT pump to $ 0.1025soon!#PYTH
The price is moving within a descending channel on the 1-hour frame, adhering well to it, and is on its way to breaking it strongly upwards and retesting it.
We have a bounce from the lower boundary of the descending channel. This support is at 0.0938.
We have a downtrend on the RSI indicator that is about to break and retest, supporting the upside.
There is a major support area in green at 0.0920, which represents a strong basis for the upside.
Don't forget a simple thing: ease and capital.
When you reach the first target, save some money and then change your stop-loss order to an entry order.
For inquiries, please leave a comment.
We have a trend to hold above the 100 Moving Average.
Entry price: 0.0950
First target: 0.0970
Second target: 0.0993
Third target: 0.1025
Don't forget a simple thing: ease and capital.
When you reach the first target, save some money and then change your stop-loss order to an entry order.
For inquiries, please leave a comment.
Thank you.

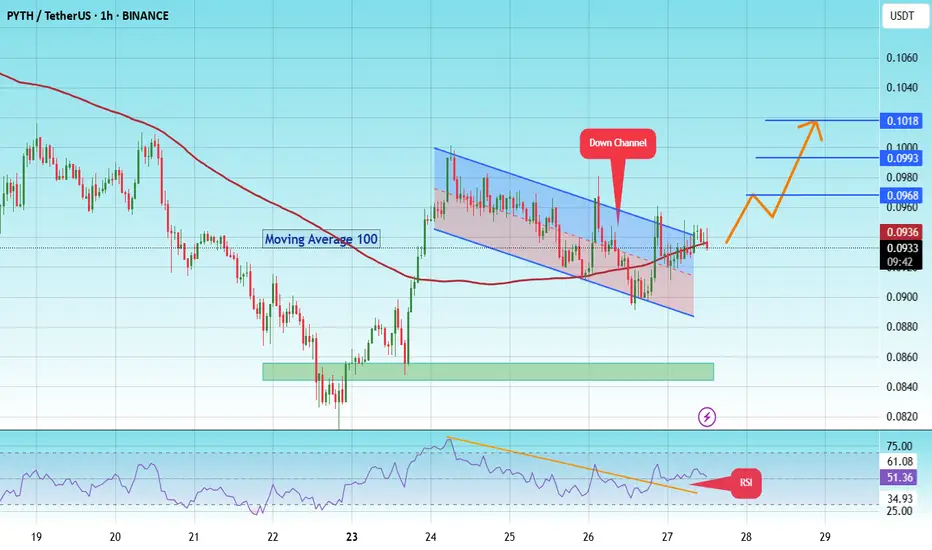
Pyth pump to $0.1018 soon! #PYTH
The price is moving within a descending channel on the 1-hour frame and is expected to break and continue upward.
We have a trend to stabilize above the 100 moving average once again.
We have a downtrend on the RSI indicator that supports the upward break.
We have a support area at the lower boundary of the channel at 0.0895, acting as strong support from which the price can rebound.
We have a major support area in green that pushed the price upward at 0.085.
Entry price: 0.0936
First target: 0.0968
Second target: 0.0993
Third target: 0.1018
To manage risk, don't forget stop loss and capital management.
When you reach the first target, save some profits and then change the stop order to an entry order.
For inquiries, please comment.
Thank you.
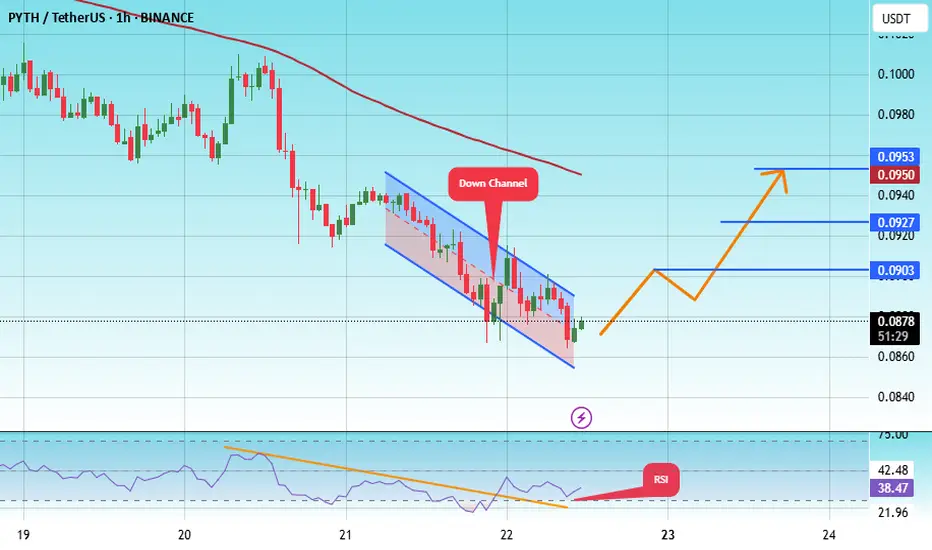
#PYTH/USDT#PYTH
The price is moving within a descending channel on the 1-hour frame, adhering well to it, and is heading for a strong breakout and retest.
We are seeing a bounce from the lower boundary of the descending channel, which is support at 0.0860.
We have a downtrend on the RSI indicator that is about to be broken and retested, supporting the upward trend.
We are looking for stability above the 100 moving average.
Entry price: 0.0880
First target: 0.0903
Second target: 0.0927
Third target: 0.0950
#PYTH/USDT#PYTH
The price is moving within a descending channel on the 1-hour frame, adhering well to it, and is heading toward a strong breakout and retest.
We are experiencing a rebound from the lower boundary of the descending channel. This support is at 0.1030.
We have a downtrend on the RSI indicator that is about to be broken and retested, supporting the upward trend.
We are heading toward stability above the 100 moving average.
Entry price: 0.1080
First target: 0.1111
Second target: 0.1140
Third target: 0.1180

PYTH ROADMAPTo me the view is pretty clear.
* The purpose of my graphic drawings is purely educational.
* What i write here is not an investment advice. Please do your own research before investing in any asset.
* Never take my personal opinions as investment advice, you may lose your money.

HUGE INCREASES Possible on PYT | Here's WhyPython is a fairly new altcoin with big upside.
From the earlier two charts on the left, we see that initial downturns shouldn't be feared. Historically, SOL and SUI started with downtrends and transitioned into massive upside alts.
Python might especially see parabolic increases, once ETH starts to move towards a new ATH. This will be due to the rotation of liquidity between altcoins in terms of larger and smaller market caps.
Don't miss yesterdays update on ETH!
____________________________
BINANCE:SOLUSDT
COINBASE:SUIUSD
BINANCE:PYTHUSDT

#PYTH/USDT#PYTH
The price is moving within a descending channel on the 1-hour frame, adhering well to it, and is heading for a strong breakout and retest.
We are seeing a bounce from the lower boundary of the descending channel, which is support at 0.1270.
We have a downtrend on the RSI indicator that is about to be broken and retested, supporting the upward trend.
We are looking for stability above the 100 moving average.
Entry price: 0.1280
First target: 0.1322
Second target: 0.1350
Third target: 0.1400

PYTHUSDT | Short Zone at the Blue Box—Proceed with Extra CautionPYTHUSDT is pressing lower with conviction, and the blue box marks our primary area to consider short entries. Although buyers are technically present, their support feels fragile; every test of this zone risks failing unless you have a strong appetite for heightened risk.
Why the Blue Box Matters
• Price has paused here before, making it a logical spot for sellers to reemerge.
• The current decline suggests sellers are in control and likely to defend this zone again.
Conditions for a Short Entry
Lower‑Time‑Frame Breakdown
Observe a clear breakdown pattern on shorter charts—whether a series of lower highs or a decisive support breach.
Volume Confirmation
Seek evidence that selling volume outpaces buying volume as price approaches the blue box.
CDV Divergence
Confirm that cumulative delta volume does not support the rally, indicating genuine exhaustion among buyers.
Entering here demands extra conviction and precise execution. If these confirmations line up, a short trade could offer favorable risk‑reward. Without them, it is wiser to watch from the sidelines until a clearer setup emerges.
📌I keep my charts clean and simple because I believe clarity leads to better decisions.
📌My approach is built on years of experience and a solid track record. I don’t claim to know it all but I’m confident in my ability to spot high-probability setups.
📌If you would like to learn how to use the heatmap, cumulative volume delta and volume footprint techniques that I use below to determine very accurate demand regions, you can send me a private message. I help anyone who wants it completely free of charge.
🔑I have a long list of my proven technique below:
🎯 ZENUSDT.P: Patience & Profitability | %230 Reaction from the Sniper Entry
🐶 DOGEUSDT.P: Next Move
🎨 RENDERUSDT.P: Opportunity of the Month
💎 ETHUSDT.P: Where to Retrace
🟢 BNBUSDT.P: Potential Surge
📊 BTC Dominance: Reaction Zone
🌊 WAVESUSDT.P: Demand Zone Potential
🟣 UNIUSDT.P: Long-Term Trade
🔵 XRPUSDT.P: Entry Zones
🔗 LINKUSDT.P: Follow The River
📈 BTCUSDT.P: Two Key Demand Zones
🟩 POLUSDT: Bullish Momentum
🌟 PENDLEUSDT.P: Where Opportunity Meets Precision
🔥 BTCUSDT.P: Liquidation of Highly Leveraged Longs
🌊 SOLUSDT.P: SOL's Dip - Your Opportunity
🐸 1000PEPEUSDT.P: Prime Bounce Zone Unlocked
🚀 ETHUSDT.P: Set to Explode - Don't Miss This Game Changer
🤖 IQUSDT: Smart Plan
⚡️ PONDUSDT: A Trade Not Taken Is Better Than a Losing One
💼 STMXUSDT: 2 Buying Areas
🐢 TURBOUSDT: Buy Zones and Buyer Presence
🌍 ICPUSDT.P: Massive Upside Potential | Check the Trade Update For Seeing Results
🟠 IDEXUSDT: Spot Buy Area | %26 Profit if You Trade with MSB
📌 USUALUSDT: Buyers Are Active + %70 Profit in Total
🌟 FORTHUSDT: Sniper Entry +%26 Reaction
🐳 QKCUSDT: Sniper Entry +%57 Reaction
📊 BTC.D: Retest of Key Area Highly Likely
📊 XNOUSDT %80 Reaction with a Simple Blue Box!
📊 BELUSDT Amazing %120 Reaction!
📊 Simple Red Box, Extraordinary Results
I stopped adding to the list because it's kinda tiring to add 5-10 charts in every move but you can check my profile and see that it goes on..

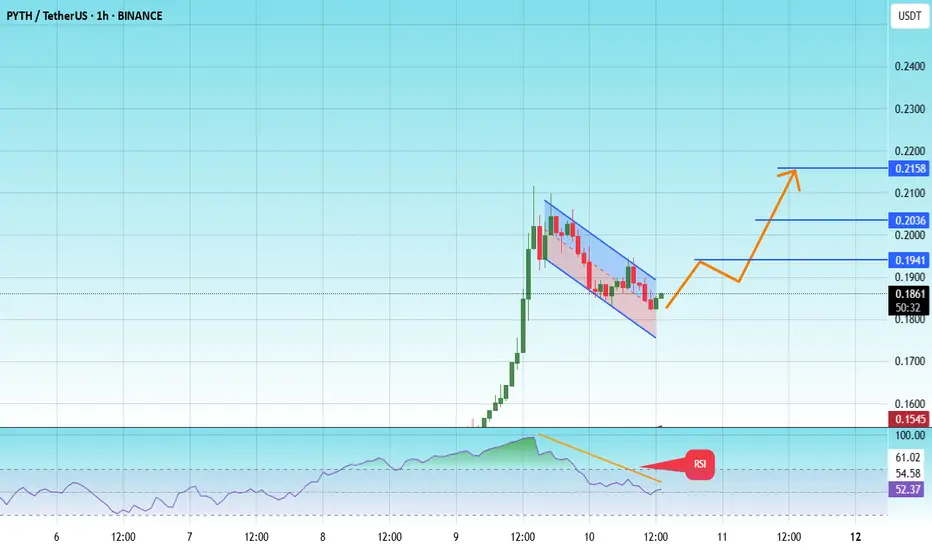
#PYTH/USDT#PYTH
The price is moving within a descending channel on the 1-hour frame and is expected to break and continue upward.
We have a trend to stabilize above the 100 moving average once again.
We have a downtrend on the RSI indicator that supports the upward move with a breakout.
We have a support area at the lower limit of the channel at 0.1800, which acts as strong support from which the price can rebound.
Entry price: 0.1860
First target: 0.1941
Second target: 0.2036
Third target: 0.2160
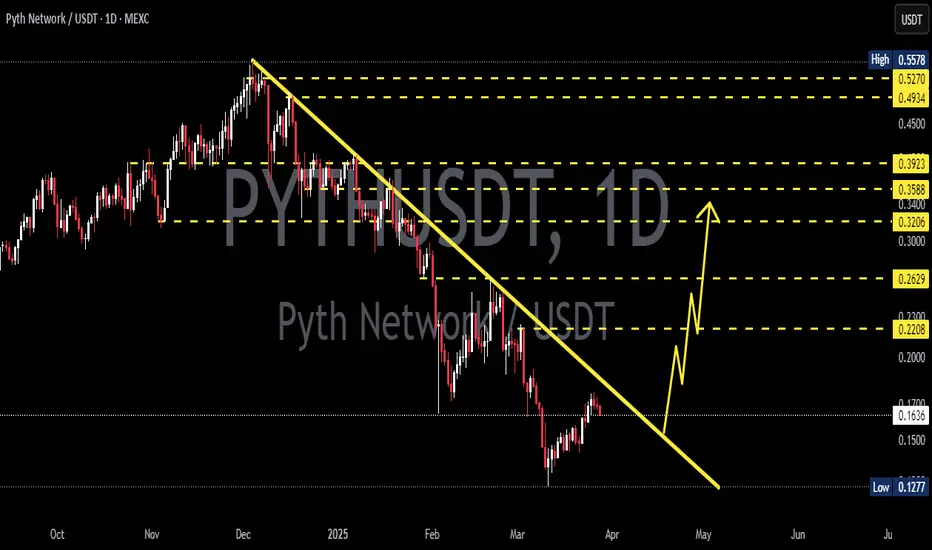
PYTHUSDT 1DPYTH ~ 1D Analysis
#PYTH Buy gradually after successfully penetrating this resistant line with a short -term target of at least 10%+.
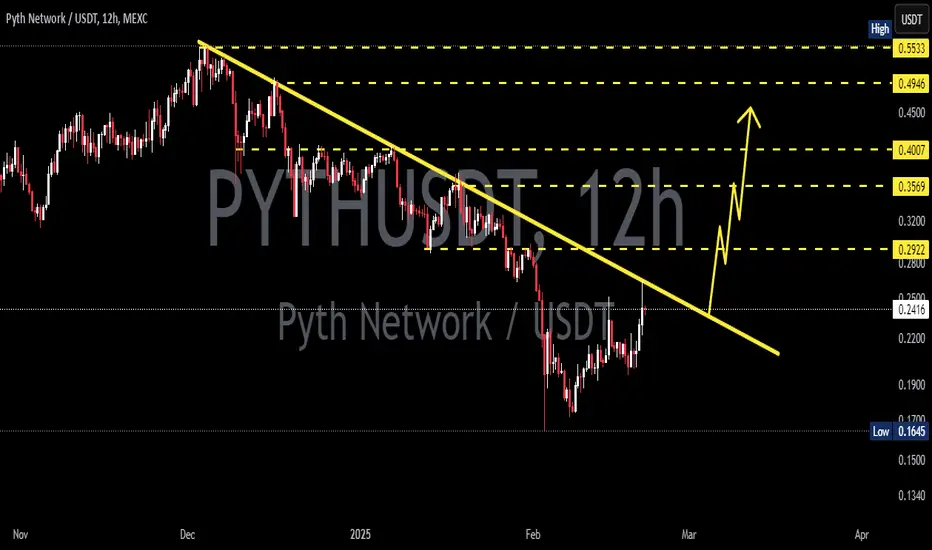
PYTHUSDT 12HPYTH ~ 12H Analysis
#PYTH Pay attention to this coin. Buy after successfully penetrating this resistant line with a short -term target of at least 10%+.
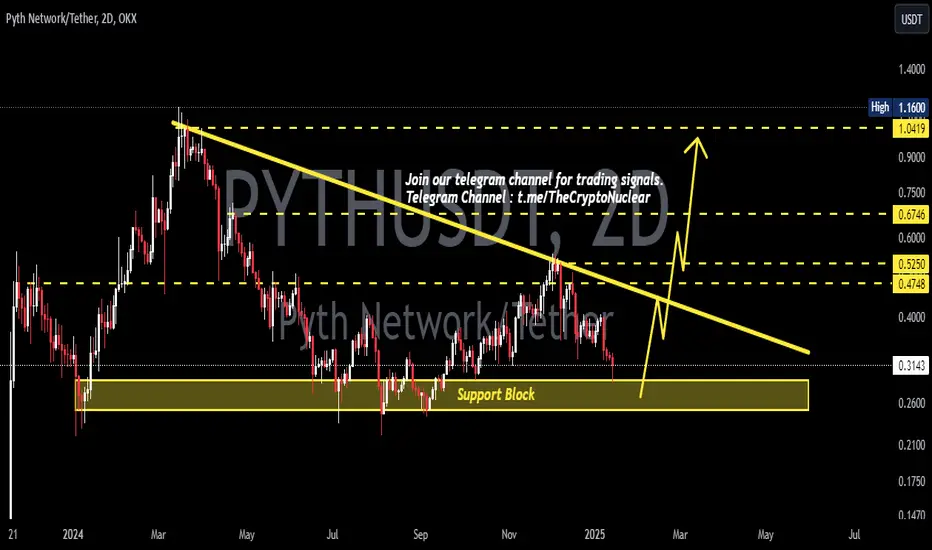
PYTHUSDT 2DPYTH ~ 2D
#PYTH So far this support block continues to keep the price from dropping any lower. If you still have Conviction on this coin, buy it gradually with a target of 20%++
PYTHUSDT - Rounding bottom patternBINANCE:PYTHUSDT stands out as a strong investment opportunity, often considered an improved version of $LINK.
While sharing similarities with LINK, it surpasses it in certain key areas. Being a new project with low market saturation, it offers significant potential for growth ✅️
The med-term targets are outlined in the chart.
Accumulation is recommended now up to 0.236 fibo level .
Best regards Ceciliones🎯

#PYTH/USDT#PYTH
The price is moving in a bearish channel on a 4-hour frame and is holding it strongly and is about to break it upward
We have a bounce from the green support area at 0.3400
We have a tendency to stabilize above the Moving Average 100
We have a downtrend on the RSI indicator that is about to break higher and supports the rise
Entry price is 0.3500
The first target is 0.3970
The second target is 0.4400
The third goal is 0.4855

PYTHUSDTPYTH ~ 3D
#PYTH So far the price is maintaining this Support Block. if you have Conviction on this coin,. Maybe now is a good time to make purchases in stages.

PYTH medium term is bearishBy examining the chart data, we found that PYTH has completed a large degree pattern. This pattern is related to wave A. This pattern has lasted for about 250 days.
It is expected that wave B is also a pattern of the same degree as wave A. It means about 200-250 days.
The supply range is the best range for sell/short positions.
Note that in order to take a position, one must have a trading setup and this is only a medium-term view for PYTH.
Closing a daily candle above the invalidation level will violate the analysis
For risk management, please don't forget stop loss and capital management
Comment if you have any questions
Thank You

PYTHUSDT 1DPYTH ~ 1D
#PYTH Very confusing
Whether to buy or worry.
we will give a conclusion.
in a bull market all bearish patterns may be easy to validate or fail structurally.
Losing this Support Block will make this bearish Pattern real, or if SEED_DONKEYDAN_MARKET_CAP:PYTH manages to defend this Support Block, We will say this bearish Pattern will fail.

PYTHUSDT 1DPYTH ~ 1D
#PYTH Looks like a Confirmed Double Bottom pattern.
Make purchases in stages within this support Block. short term target of at least 15%+

PYTH NEW UPDATENow that we have more data on the chart, the PYTH scenario is clearer.
It seems to be completing a descending triangle which is now in wave D of this triangle.
Wave D appears to be a diametric.
From the red box, we expect the price to move towards the green range and then react to the green box.
For risk management, please don't forget stop loss and capital management
Comment if you have any questions
Thank You

Pyth Network PYTH price prepares something interestingThe #PYTH price is probably tamping the bottom after a several-month correction.
🔼 To continue its growth, #PYTHUSDT needs to consolidate above $0.50
⚠️ The critical level from below is $0.44,
Fixing the price of the Pyth Network token below this level will indicate that the correction will continue for some time.
_____________________
Did you like our analysis? Leave a comment, like, and follow to get more

Pyth Network (PYTH)The Pyth Network is the largest and fastest-growing first-party oracle network. Pyth delivers real-time market data to financial dApps across 40+ blockchains and provides 380+ low-latency price feeds across cryptocurrencies, equities, ETFs, FX pairs, and commodities.
Anyway, Pyth is still young and few candles are availabel. However, it seems Pyth is moving in an ascending channel and recently Pyth broke the minor downtrend line. Let's see what happens.
