Adding QNTUSD for a short term bounceI'm looking to add to QNTUSD at the 110 - 113 level for a possible short term bounce. The lower time frames are now looking very oversold (1hr - 4hr). The Daily (see below) still looks like it has further to go on the downside. A bounce at 110-113 could see a restest of the breakdown at 120. I can see the downside resuming to the 98-100 area bigger picture.
QNT

QNT in a falling wedge! Keep an eye on this setup!Here's a quick Look at QNT 1 hr chart. As we can see, the price has been forming a falling wedge and a break to the upside could be around the corner. If BTC goes south, then this setup won't be relevant.
The best entry would be when the price breaks above 125.2$ with a good amount of volume. One to keep an eye on.
-------------------------------------------
The idea is: Buy when the price breaks above 125.2$ and take profits at the levels shown in the chart.
Targets:
1. 128$
2. 133$
3. 139$
-------------------------------------------
What are triangles when it comes to trading?
Key points:
"1. In technical analysis, a triangle is a continuation pattern on a chart that forms a triangle-like shape.
2. Triangles are similar to wedges and pennants and can be either a continuation pattern if validated or a powerful reversal pattern, in the event of failure.
3. three potential triangle variations can develop as price action carves out a holding pattern, namely ascending, descending, and symmetrical triangles."
-------------------------------------------
If you like the content, then make sure to comment and like the post :D
Follow me for daily profitable trading setups
BTC dictates the market. If BTC falls, then Alts will fall as well. Trade safe!

QNT USdt great risk reward shortthis is a great risk reward situation.
i will enter a short here at 129$
and i'm lookg for a take profit at 14.2$
that is a 11.5% and will use 3x leverage.
on the other hand,if a 4hour candle closes above 131.2$ i will cut losses and that is a 1.6% risk.
techincal supports it and qnt needs a small pullback.
for a safer bet you can take some profit at 120.3

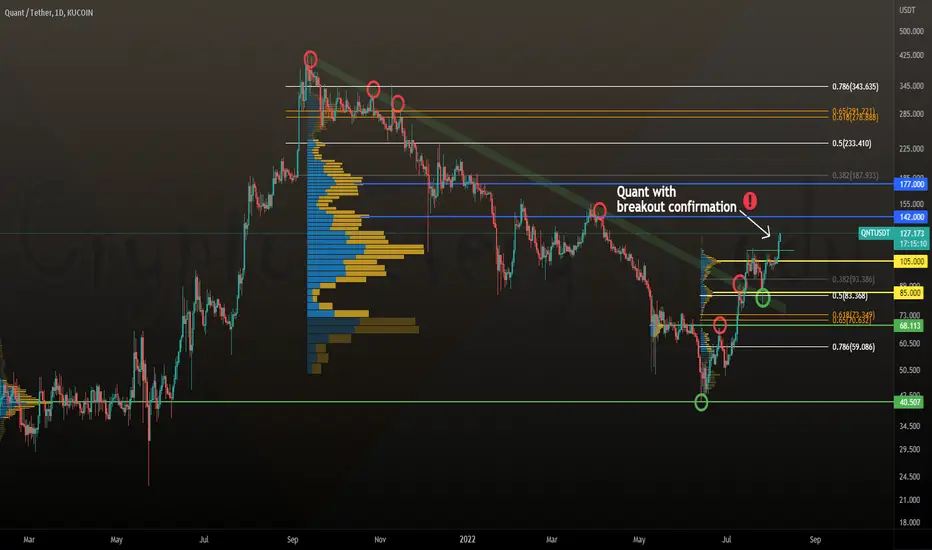
Quant QNT with a perfect breakout confirmationQuant with a perfect breakout confirmation since we closed yesterdays candle with a higher high as the breakout high
Next volume profile targets are $142 and $177 (blue lines)
Targets for a correction are $105 and $85 (yellow lines)
Who HODLs QNT dear Crypto Nation?
*not financial advice
do your own research before investing
QNTUSDT(Quant) Daily tf Range Updated till 06-08-22QNTUSDT(Quant) Daily timeframe range. if anyone notice it slowly retraced back to its old low, which is a one good prop. volume still is low and there is little retail interest into it. but breaking its lows and a slow bleeding always bring question about its quality. it had both. it would be safer if it picks up a little bit more retail interest and volume to make things more stable for price action. it do have a decent fundamental quality to it. but days like these we need more than that.

QNT - On The RiseGreat potential here and already ranked in the Top-50
The Quant project encompasses the Overledger blockchain operating system and QNT token, both tasked with ensuring interoperability between multiple blockchains and enabling linking between global networks and chains with more flexibility.
What is Quant?
The heart of the Quant project is the Quant Network as a technology which automates the trust functions between multiple blockchains with the help of the Overledger operating system. The system is billed as the first OS to be built for blockchains, with the goal to connect blockchains and networks (such as those for the provision of financial services, healthcare and others) on a global scale, yet without hampering their interoperability.
The Overledger represents the core around which a future digital economy ecosystem is supposed to be built, allowing the developers and businesses in it to build decentralized multi-chain applications (known as MApps) for their customers. Becoming part of the Overledger, however, will be secured only with the use of QUANT ( QNT ) tokens which are utilized to pay for the platform use fees or annual licenses.
What is Quant Trying to Achieve?
The idea for the creation of the Overledger/Quant was birthed in the head of the project’s CEO and founder Gilbert Verdian while he was working in the healthcare sector. Back then, he identified the key role of interoperability in ensuring coverage for patients registered on diverse networks and featured across multiple datasets. With that in mind, the team led by Verdian set on resolving a set of issues in order to bring about a future concept called the “Internet of Trust”
Potential competitors for the Quant platform include WAN, Cosmos, Polkadot and similar projects.
i seem to be liking QUANT better than anyone else in it's category.
One Love,
the FXPROFESSOR

Quant: Climber 🧗♂️Quant has continued to climb upwards, even making up for some countermovement. Now, the altcoin should press on to reach the upper orange zone between $132.40 and $169.81, where it should complete wave (i) in blue. Afterwards, we expect Quant to start a noticeable countermovement, thus dropping into the blue zone between $90.07 and $51.44. This could provide a new opportunity for market entry, as the altcoin should rise again after finishing wave (ii) in blue. So, no need to worry about missed chances!

Stockload QNT I hope you guys are getting as much Quant as you can before the swing from bear market to bull market! I believe the bottom has been and gone its up only up from here. I wont be shorting anymore and ill be buying as much as I can, only trading on the climb! as you can see it keeps breaking the bear flags with pumps afterwards! it tests the support for a little while and takes off again. Here we come $1000 USD a token! good luck to everybody and I hope you make mega profit.
thanks for taking the time to read my idea! feel free to leave a comment! id love to have a chat!

Quant flirting with a inverse h&s breakoutNo confirmation yet and its always imperative to wait for confirmation…should it confirm the breakout, the target is $90. Waiting for not just a candle close above the white neckline, but also a follow up confirmation candle to show us a bullish impulse.

QUANT - Real World SolutionsGreat potential here and already ranked at #40
The Quant project encompasses the Overledger blockchain operating system and QNT token, both tasked with ensuring interoperability between multiple blockchains and enabling linking between global networks and chains with more flexibility.
What is Quant?
The heart of the Quant project is the Quant Network as a technology which automates the trust functions between multiple blockchains with the help of the Overledger operating system. The system is billed as the first OS to be built for blockchains, with the goal to connect blockchains and networks (such as those for the provision of financial services, healthcare and others) on a global scale, yet without hampering their interoperability.
The Overledger represents the core around which a future digital economy ecosystem is supposed to be built, allowing the developers and businesses in it to build decentralized multi-chain applications (known as MApps) for their customers. Becoming part of the Overledger, however, will be secured only with the use of QUANT (QNT) tokens which are utilized to pay for the platform use fees or annual licenses.
What is Quant Trying to Achieve?
The idea for the creation of the Overledger/Quant was birthed in the head of the project’s CEO and founder Gilbert Verdian while he was working in the healthcare sector. Back then, he identified the key role of interoperability in ensuring coverage for patients registered on diverse networks and featured across multiple datasets. With that in mind, the team led by Verdian set on resolving a set of issues in order to bring about a future concept called the “Internet of Trust”
Potential competitors for the Quant platform include WAN, Cosmos, Polkadot and similar projects.
i seem to be liking QUANT better than anyone else in it's category.
One Love,
the FXPROFESSOR

Waiting for breakoutQNT & Matic are definitely standing out in the market right now. Quant is inside of an ascending triangle and should break out within a few 4H candles. My first target is $110 and the next at $130. RSI is matching the price action and MACD looks ready to run.


QNT: time your short entryI've been eyeing QNT for 2 days now, I think it's almost time to enter the short but to be fair I'm not sure yet what it'd be the best entry.
At 15 min volume looks like it should push a bit more, maybe even touch the daily EMA 200 although this is already a bounce upward so it's more challenging to foresee when it'll stop the run
On the other side RSI and OBV shows momentum is decreasing and this is the last push up before dumping.
My targets can still change because I'm not sure I would enter now, I evaluating the idea of entering a bit late when it'll be sure this will go down even though I always try to enter at the top.
Check my updates just in case.

there might be a breakout on QNTUSDT the price got a rejection on 90$ from dynamic and static resistance. it is inside an ascending channel, if 74$ hold as the static support on midline of the channel to 64$ as the dynamic support, or have breakout on 90$ then we could set a nice long position.
this is not a buy or sell offer and is only educational.
if you liked this idea or if you have your own opinion about it, write in the comments for us. we will be glad
hoping for more profit for you ...

Quant QNT at exciting resistanceQuant QNT at exciting resistance
If QNT breaks and confirmes that breakout we can talk about much higher price targets
But consider how important this resistance channel was in the past
Will Quant breakout to the upside - let me know your thoughts
*not financial advice
do your own research before investing

$QNT retests the 200 MA After the quad bounce off of the 0.786 resistance line yesterday (Larger Circle), the $QNT market headed towards a retest of the 200 MA (Smaller Circle). It was beautifully executed, both the 200 MA and the ichimoku cloud were touched, retested and successfully held their ground. The $QNT market is on its way up again following the uptrend line I had drawn a few days prior of buying what seemed to be the bottom of this run. Hopefully we can see some very nice profit over the next couple of days!
Thanks all for taking the time to view this idea! feel free to leave a comment and let me know if you agree with it or of there is anything I should consider on top of this information. I wish you good luck! <3

$QNT bouncing off 0.786 Fib LineQuant went on a solid run as of yesterday and seems to be holding its support. it did bounce off the 0.786 Fib resistance line 3 times consecutively though.
not too sure on where to go from here if I sell and try get it cheaper or if I hold it to see if it does manage to break the resistance fib and continue on an uptrend. Ill keep you guys updated!
Thanks for reading! :)

$QNT - (Log chart) Getting down there soon. This is a follow up from my last (failed) idea on $QNT: It did not run independently this time. It failed to regain its EMA support and fell like the rest. But I do anticipate this coin will have one of the strongest runs in the next part of this cycle:
I see a WXY correction almost finishing and we can see there is some decent convergence support on the right side of the chart.
Let me know what you think.
Trade safe.
Quant shortQuant broke trough off the lower boundary of ascending channel. Asset broke trough the support level. Bearish movement to support level at 43 is expected to happen.

QNT could bounce off the $214 area (.618 fib level)"IF" QNT goes lower, it could bounce at the .618 fib level area around $214. This would be a great scale in buy opportunity.

Quant (QNT) formed bearish Cypher for upto 20% bearish moveHi dear friends, hope you are well and welcome to the new trade setup of Quant ( QNT ) with BTC pair.
Previously we had a nice trade of QNT:
Now on a 4-hr time frame, QNT has formed a bearish Cypher pattern.
Note: Above idea is for educational purpose only. It is advised to diversify and strictly follow the stop loss, and don't get stuck with trade.

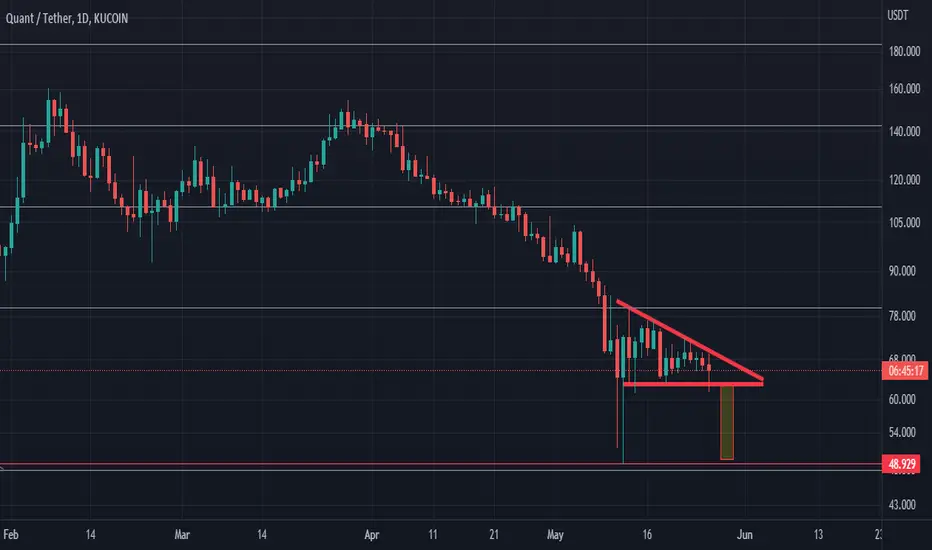
Quant descending triangle short term 2022We have a descending triangle that is a bearish pattern. If this plays out we could see QNT at $48-$49. It would make sense if QNT plays out on a drop in price thus respecting this descending triangle pattern and we drop to the previous low, this would give us a double bottom and a healthy position for a rebound.
CRYPTO BACK TO $900 BILLION- As you can see the market could potentially go up for a little run, then gas out and break below the SUPPORT!
- What could cause the crash down to $900 BILLION? CRYPTO REGULATIONS!!!
RETAIL INVESTORS: 'OH NO A BEAR MARKET' ..............create extreme fear and disbelief then consolidate for a very long time, everyone gets bored and forgets about crypto, then 2023 we start to pick up and trigger a BULLRUN!
