$QNTUSDT Breakout – 120% Move Ahead?GETTEX:QNT just broke out of a major triangle pattern that’s been building for months.
With this breakout above $121, the chart hints at a strong move ahead, possibly up to $260.
If it holds above the $108 zone, this could be the start of a big rally. One to watch closely.
DYOR, NFA
Qntlong

#QNT/USDT#QNT
The price is moving in a descending channel on the 1-hour frame and is expected to continue upwards
We have a trend to stabilize above the moving average 100 again
We have a descending trend on the RSI indicator that supports the rise by breaking it upwards
We have a support area at the lower limit of the channel at a price of 86
Entry price 92
First target 98
Second target 103
Third target 110

QNTUSDT 2D AnalysisQNT ~ 2D Analysis
#QNT Buy on retesting this support block or buy after successfully breaking this resistance line with a short term target of at least 10%+.

QNTUSDT 1WQNT ~ 1W Analysis
#QNT Buy gradually from here if you still have a Conviction on this coin with a short -term target of at least 15%+.
Quant (QNT): Entering a Bullish ScenarioStrong Upside Potential
Quant (QNT) has officially entered a bullish phase, as the price refused to drop below $84, signaling a strong buying zone and market confidence. Currently trading at $106, QNT is showing momentum to easily break through key resistance levels at $130 and $170 in the coming months.
If the bullish trend continues, QNT could be on track to challenge its all-time high and potentially set a new record by the end of 2025.
Key Levels to Watch
Support Zone: $84 (strong rejection area, confirming bullish sentiment).
Short-Term Resistance: $130 (first breakout level).
Mid-Term Target: $170 (key area before testing new highs).
Long-Term Potential: New all-time high by late 2025, depending on market conditions and demand for QNT’s blockchain solutions.
Conclusion: QNT Positioned for a Major Breakout
With solid support at $84 and a strong push above $106, QNT is poised for a significant rally. The next major moves include breaking $130 and $170, which would set the stage for a new all-time high by the end of 2025.

#QNT/USDT#QNT
The price is moving in a descending channel on the 1-hour frame and is adhering to it well and is heading to break it strongly upwards and retest it
We have a bounce from the lower limit of the descending channel, this support is at a price of 92
We have a downtrend on the RSI indicator that is about to break and retest, which supports the rise
We have a trend to stabilize above the moving average 100
Entry price 43
First target 95
Second target 97
Third target 99

QNTUSDT 1WQNT ~ 1W Analysis
#QNT Buy gradually from here if you still have a Conviction on this Coin with a minimum target of 20%+.

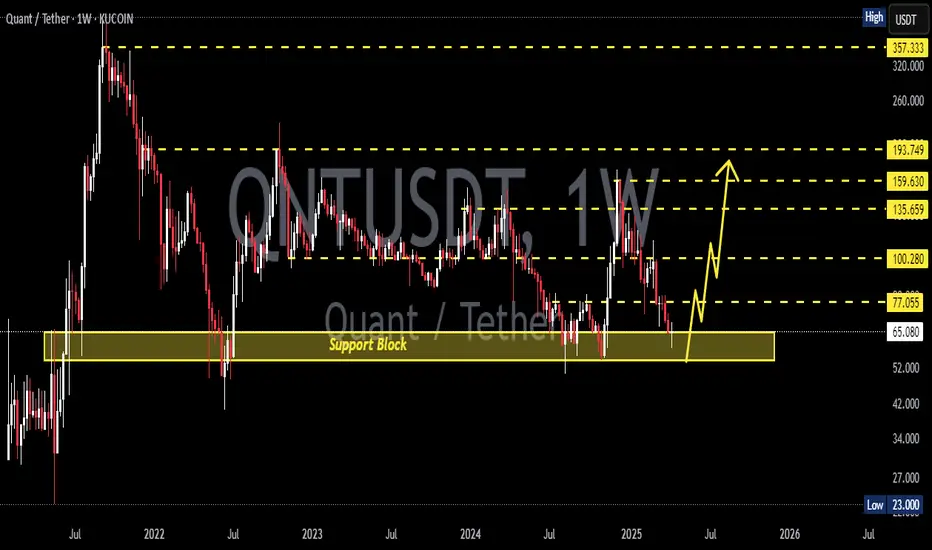
QNTUSDT 1WQNT Update ~ 1W
#QNT If you still have Conviction on this coin,. This support block would be a very good buying place for now. With a minimum target of 20%+

#QNT/USDT#QNT
The price is moving in a descending channel on the 4-hour frame and it was broken upwards
We have a trend to stabilize above the moving average 100
We have a downtrend on the RSI indicator that supports the rise by breaking it upwards
We have a major support area in green at a price of 58.00
Entry price 63.90
First target 71.60
Second target 76.50
Third target 82.90

QNTUSDTQNT ~ 1W
#QNT This is the lowest support block for now. if you still have Conviction on this coin,. Buy gradually on this support block,. With a minimum target of 20%++

QNTUSDT 1WQNT ~ 1W
#QNT Getting the lowest price is extremely rare.
now is the right time to buy COINBASE:QNTUSD , This is the lowest price so far.

QNT USDTQNT/USDT Setup. After a confirmed breakout from the marked zone in green, we could take an entry at 83.8 Remember stop loss is your friend. Everything is on the chart.
Entry 83.8
S.L 79.5
T.P 1 87.7
T.P 2 92.8
T.P 3 99

#QNT/USDT#QNT
The price is moving within a bearish channel pattern on the 12-hour frame, which is a strong retracement pattern
We have a bounce from a major support area in the color EUR at 68.00
We have a tendency to stabilize above the Moving Average 100
We have a downtrend on the RSI indicator that supports the rise and gives greater momentum and the price is based on it
Entry price is 75.00
The first target is 86.00
The second goal is 94.30
The third goal is 102.90

#QNT/USDT LONG#QNT
Since July 2022, the price has been moving in a descending triangle pattern
The pattern was broken upward, and the Moving Average 100 was broken
Current price 110.70
First goal 131.20
Second goal 159.80
Please pay attention to the correction areas on the chart

#QNT/USDT#QNT
It is moving in a bullish flag for 1 day and the price has committed to the green support area at the 98 level
We have a higher stability moving average of 100
We have bullish momentum on the RSI and an uptrend
We have a current breakout of the channel to the upside
Entry price is 121.30
The first goal is 131.00
The second goal is 141.00
The third goal is 149.00

QNTUSD 1WQNT ~ 1W 📈
#QNT It's only a matter of time until this resistance line is broken through, make purchases gradually from here, with a target of at least 20%++ 🚀🚀

QUANTWhat Is Quant (QNT)?
- Quant launched in June 2018 with the goal of connecting blockchains and networks on a global scale, without reducing the efficiency and interoperability of the network. It is the first project to solve the interoperability problem through the creation of the first blockchain operating system.
- Strong Project.
------------------------------------
Trading Part
------------------------------------
- Bullish Weekly Divergence.
- In contact with Lower BB.
------------------------------------
- Buy Zones :
- Buy 100$ ish ( 25% invest )
- Rebuy 50$ ish ( 75% invest )
- TP : 148$
SL : No need
------------------------------------
-- Follow BTC Movements.
-- Never go all in.
-- always keep juice to rebuy.
-- manage your risks.
Happy Tr4Ding!

QNT and Bull flag formingQNT is forming beautiful bull flag, with volume it can go higher in next days...
Always manage your risk and use stoploss. Not a financial advice

QNT CORRECTION In the analysis below we said that we are waiting for a correction.
VAL (99.5$) if we keep this zone, the chances for going long are high
Next zone for long 91$
link since the last analysis

QNT/USDTGPW:QNT is just starting the good journey in the bull market. We mentioned the perfect entry for the QNT and now it is 28% above the entry point. We are making this trading journey super easy for you.
Trust
@TheCryptoCity1
$ANALOS Luna #JASMY #MEXC Matic SIX:FREN

#QNT/USDT#QNT
Since the beginning of the year, the price has been trading in a large bearish channel.
This descending channel was penetrated, and the downtrend was broken strongly.
Supported by the rise of Bitcoin.
Entry areas from 93 $ to 97$
It is expected that the rise will continue, targeting levels of 133, which is approximately 130% of the current price.
All this caused me to be oversold at the daily frame level.

QNT coiling up for a run at ATHThis trading plan is based on the long-term POC consolidation, and the imbalances up near the ATH. Could net a cool unlevered 3x return.

