QNTUSD could validate the symmetrical triangle breakout here. Nice sized candle currently above the yellow symmetrical triangle..it has grown a mild bull wick since testing the thickerwhite line above the triangle which is the neckline to a bigger inverse head and shoulders pattern. It could come back down to retest the top trendline of the yellow symmetrical triangle…the most important thing is where the current daily candle closes and how the follow up candle behaves afterwards. As long as we close above the yellow trendline on the current candle probability favors the breakout…however breaking above the white neckline by the follow up candle and flipping it to support will really seal the deal. If we do validate the breakout I would not be shocked if price action came back down to retest the white neckline as support after reaching the triangles full breakout target at $166. If it can hold the white neckline as support after that its a good sign that the inverse head and shoulders pattern will be validating as well taking us even higher. Of course it doesnt have to retest the neckline to validate the inv h&s so wise to anticipate that outcome as well. One last thing to add is there is also a current smaller inv h&s we are breaking up from at the same time as the symmetrical. I forgot to put that patterns target on the chart but the smaller inv h&s target is $137. There’s always a possibility price action corrects after reaching 137 too. *not financial advice*
QNTUSD

#QNT is one of the best performing #crypto's of 2022Robust performance post bottom
Retested early launch price action
4X in price and on verge of breaking out
This may only appeal to large funded speculators, due to having a high token price. Driving away smaller speculator's.
But much like the stock market , if this token achieves a four figure sum in the next bull market who cares if you have ten tokens or a thousand.

QNT : A Little up Then down...QNT Seems to be trading inside a huge rising wedge and we will be touching the resistance soon...
Just trading the charts and keeping emotions out here...

QNT, strong resistance, can we break out?Support line very strong, is it possible to break out?
Bitcoin continues to sink. Gets more and more difficult.

QNTNot financial advice. The essence of investing & trading is the intelligent and patient preying on the greed, fear, impatience, addiction and ignorance of the majority. It's definitionally Darwinian.

Quant: Blue Skies 🎼Blue skies
Smiling at me,
Nothing but blue skies
Do I see.
Bluebirds
Singing a song,
Nothing but bluebirds
All day long.
If Quant would be singing this famous jazz song by Irving Berlin from 1926, it would probably rather go like this:
Blue zones
Beckoning me,
Nothing but blue zones
Do I see…
From the end of wave (ii) in blue at the upper edge of the lower blue zone between $86.77 and $50.69, Quant has steadily been climbing upwards and should soon cross the resistance at $161.52. Afterwards, it should rise into the upper blue zone between $236.77 and $294.39 to finish wave (iii) in blue. There is a 40% chance, though, that the altcoin could drop below the support at $85.93 and take a detour through the lower blue zone before moving upwards effectively.


Party people... QNT is in DA HOUZE!Check it, all QNT needs is a second to wreck it... ;-) You know the drill: inverse H&S on da hill. Looking nice, just check the target price What do you see, the bones of a CBDC :-)

Quant QNT - The most bullish high cap is breaking out!
This altcoin is on fire right now because the bearish market structure is breaking out!
On the daily chart , we can spot an inverse head and shoulders ( bullish reversal pattern) and a descending parallel channel . Both of these patterns have been destroyed by the bulls recently!
This altcoin can definitely survive an upcoming crash on Bitcoin , so if you are pumped, then you should buy QNT right now!
As per my Elliott Wave analysis, the new uptrend started with a strong impulse wave (1) and we have also successfully finished an ABC zigzag wave (2). Now wave 3 is in progress, and this wave you really don't want to miss.
The previous all-time high is indeed a strong resistance, so you can take profit exactly at this level or slightly below to make sure you will get filled.
QNT is currently one of the most bullish altcoins in the TOP30 category, and you really want to sell ETH if you haven't already.
This altcoin is tremendous, and a 187% profit is really nice, isn't it? The bulls are right here right now!
95% of altcoins looks terrible, but this is definitely an expection. This trade provides a pretty good risk-to-reward ratio.
For more analysis, hit "Like" and "Follow"!


#QNT/USDT 1DAY UPDATE !!Hello dear traders, we here new so we ask you to support our ideas with your LIKE and COMMENT, also be free to ask any question in the comments, and we will try to answer for all, thank you, guys.
QNT UPDATE:-Quant (QNT)
Quant (QNT) rose to a six-month high on Wednesday, despite crypto markets mostly hovering in the red.
Following a low of $122.08 on Tuesday, QNT/USD rallied to a hump-day high of $143.26 earlier in the day.
The move came as prices raced past a key resistance point of $133.00, hitting their highest point since March 29 in the process.
Shortly after the breakout, we saw bears reenter the market, likely as a result of uncertainty spurred by earlier bulls who opted to close positions.
As of writing, quant is currently trading below the aforementioned resistance point, with the 14-day relative strength index (RSI) also hitting a ceiling.
Currently, the index is deep in overbought territory and tracking at 70.47. Should bulls aim to take the price higher, the ceiling of 71.00 on the RSI will need to be broken.
Sorry for my English it is not my native language.
Hit the like button if you like it and share your charts in the comments section.
Thank you

QNT, Quant. Inverse head and shoulder.we will go higher and higher, provided bitcoin remains stable!

Inverse Head and Shoulders Pattern Spotted on the Daily!Traders,
Heads up on this Inverse H&S pattern I spotted on Quant. If it breaks that neckline, we're in for a nice ride up!
Stew

QNT to 2025QNT General idea on the run up. FIrst run up to retest the break of structure the midpoint of the drop zone. to pullback for consolidation and build a run up towards the end of 2024 for the 2025 bull run . What the March halving will do we should see where it sits. Just an idea dont take it to heart just enjoy it and watch it from the start

Quant QNT big picture still goodIf Qnt breaks the $88 price range we may see $69 in the short term but long term we are still likly heading to the 0.382 or higher by mid 2023

Quant #QNT may reach about $180Quant #QNT may reach about $180, possibly even as high as $280 by mid 2023

QNTAssuming that the decline in cryptos will deepen with the interest increase to be taken at the fed meeting this week, I think that if it sags under the yellow trend in qnt, a classic obo formation will occur. I think that the current chart reflects this.

Quant: TrampolineWhoever thinks trampolining was just for children has clearly never tried it properly! It’s not only an Olympic discipline but also a tough workout for back, bottom and legs! Quant is just giving it a shot by pushing itself off the support at $85.93, aiming for the upper blue zone between $236.77 and $294.39, where it should finish wave (iii) in blue. There is a 40% chance, though, that Quant must take a detour through the lower blue zone between $86.77 and $50.69 first before rising effectively.

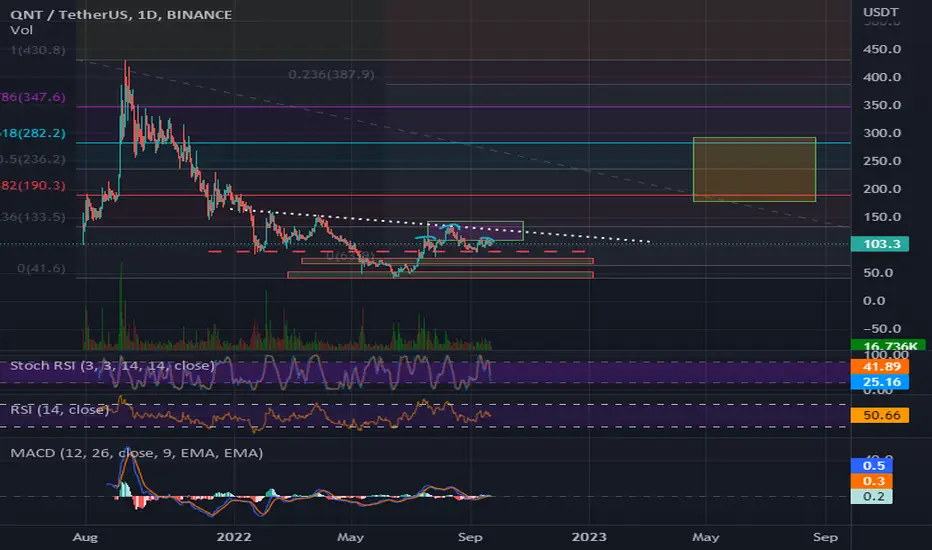
Quant testing the top trendline of the 1day symmetrical triangleWe can see that priceaction is currently attempting to both test the top trendline of the symmetrical triangle (in chartreuse) as well as trying to climb back above the 1 day 50ma(in orange). If price action can flip the 1 day 50ma back to solidified support then it can validate the bullish breakout from this symmetrical triangle. The breakout target from that symmetrical triangle will take price action far above this white line which is actually the neckline of an even bigger inverse head and shoulders pattern. If we are to hit 100% of the breakout target for the triangle ($165), this will greatly increase the probability of it also triggering the breakout of the inverse head and shoulders pattern as well which can send it considerably higher afterwards($224). Of course for now the 1 day 50ma is still resistance so we want to see a couple daily candle closes above that and any confirmation candles after that that retest it, testing it as strong support. Flipping tat 1day 50ma back to strong support will also confirm that the golden cross that recently happened will be sustained instead of flipping back into a deathcross and confirming a golden cross fake out. *not financial advice*

QNT I created this drop wedge setup for QNT after the trend reversal from that double top. When it fails to make the final leg in an elliot wave usually comes into an accumulation zone which is usually formed in a cup formation for the double top retrace . So far since first drop is following thru. Expect lower highs it may not touch the top of wedge. But with this chart you can see when it is breaking the trend for a reversal warning. This is just my personal notes not to be taken to heart. But as a guideline

Adding QNTUSD for a short term bounceI'm looking to add to QNTUSD at the 110 - 113 level for a possible short term bounce. The lower time frames are now looking very oversold (1hr - 4hr). The Daily (see below) still looks like it has further to go on the downside. A bounce at 110-113 could see a restest of the breakdown at 120. I can see the downside resuming to the 98-100 area bigger picture.
