QNT BREAK OUT VERY SOON..This is my QNT set up for the next month Good Luck!
Not A financial Advice , just my idea!
Love yall :)
Qntusdt

🤠 QNT QNT soon has enormous potential.
Minimum 60%
QNT has been in a downward channel for a long time.
I estimate that it will be launched in December

Long QNT - there is nothing more to say...With QNT/ETH pair already in accumulation modei expect only more downside here if the whole market (+ETH) sells off!
Daily RSI at 35 - lowest it ever was!

QNT - Setup Quant One of the best fundamentals out there. Even with shakeout, it bled only -5% compared to other alts. Definitely, this is a must-buy. I expect it to perform well longterm wise

Consolidation over for QNTThe low has been broken forming an ABC, with price rejected on high volume. We can expect a reversal here.

QNT is fighting Im seeing QNT respecting these rays flip red we might move up break green we retest the bigger ray white
would love your thoughts as I am still learning

QNTUSDT$QNT looks slow, but exchanges are rapidly running out of coins.
Hence, once we are out of the wedge, we are to see a huge, quick move UP towards $500.

QNT USDT ez profit150% expected in 2/3 months ig, ez moni.
2022 ez year for us, trust the process !!

Brush the weak hands $QNT I refuse to believe that QNT will nuke
It is a SOLID project.
What i think:-
I think this will happen, either fake out from here or down with a little deviation and double bottom then up.
Stop loss would be a little below these fake outs OR if it stayed there for very long, then get over it.
Dollar cost averaging here could make sense.
Cheers!

Important SupportThis is 4h Chart of Qnt/Usdt . It is at support line and should pump from here to the moon.
Watch out!!!!!!!

QNT one of the most underrated projects in the marketQuant is an extremely fundamentally sound project that connects various ledgers and blockchains together using overledger. Multiple patents that guarantee no competition. Been in this since it was in the $30 dollar range, currently a few bucks under $300 and this thing is going MUCH higher. Good entry at anytime, but in terms of technicals, expecting a MAJOR push up once we break this price squeeze.
- Price will push to previous ATH
- Test it
- Then expecting a break thru and push past 1.0 fib level up to the 1.618 level with minor retracement and profit taking on the way up
*THIS THING IS A GEM*

qnt/usdtTesting/tracking elliot wave theory. Please do not trade off idea without S/L. Not financial advice.
We are either completing the ABC wave or working towards the 5th eillot wave. There's two separate wave count that is possible and since the 5th wave looks more possible due to the chart looking kinda weird for an ABC wave, but this is crypto lol anything goes. I will update after whichever one plays out.

QNT PotentialFlag Pattern (Pennant), the price is about to breakout the dynamic resistance, and the RSI crossed 50, there's possibility of price growth to the specified targets.

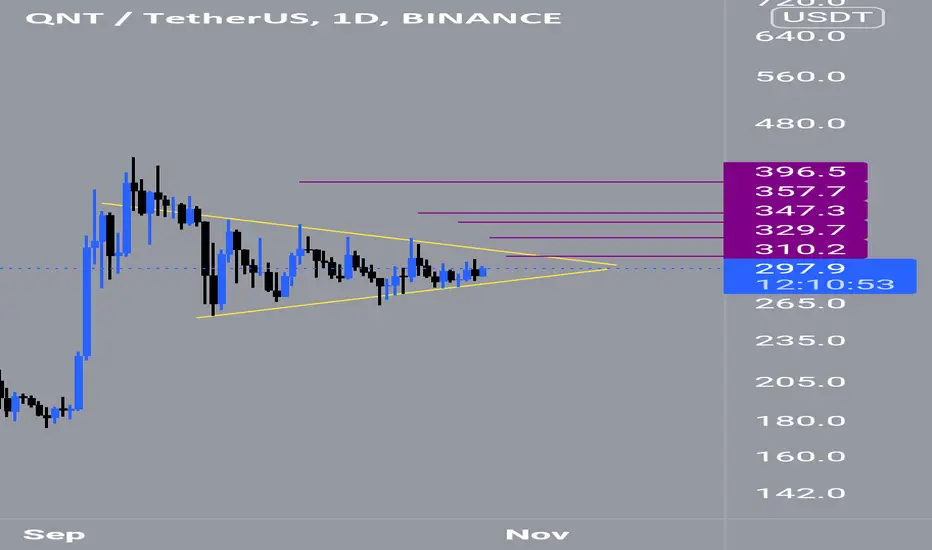
LongHi guys, we seem to be in a triangular pattern and can be checked to the detriment of losing the pattern
#QNT
#QNTUSDT
Spot( Midterm)🌟
Enter :280$/298$
Targets :
Target : 310$
Target : 329$
Target : 347$
Target : 357$
Target : 396$
Stop loss : 270$
Daily Close In 270$
Qnt is ready to explode But the breakout and enjoy the ride. Quant is looking really strong with an amazing support at the bottom. Get ready for another massive rally.

QUANT PUMP FINALLY?As we can see the fib bollinger bands are contracting, similar to price action during its consolidation phase after previous pumps.
Anticipating another QUANT pump any day now. Could play it safe and wait for a retest of breakout but note last time QUANT pumped we never looked back.
Not financial advice and always use SLs, happy trading friends.

QNT with a fake out.QNT will fake a breakdown from the triangle and then will reach new highs. This happened in the first triangle in July. RSI will touch the bottom of the channel and then from then, it UP only.
NOT FINANCIAL ADVICE


QNTUSDT - Consolidation And Keep RisingHello there,
Check it out for QNTUSDT, look great for next waves.
Limit Maximum conins ~300 000 000.
Good partnerships and all,
Sustained investments.
Thank you,
Not a trading advice,
St.Gex

QNTUSD - Correction Waves IncomingHello everyone,
Regarding the lately moves of the Quant, I ad to take a look also, considering that I've researched it in the past also: Check Related Ides below.
Fibb retracement can get us down to ~$94 zone in a decent scenario.
The minimum reachable for medium term would be $57.
Thank you for your time,
St.Gex


QNT with a perfect breakout and retestQNT has broken out of its 4hr downward trend and has retested the trend as support. The next targets are 500$ and 588$.
