Qnt Breaking Bullish Flag Qntusdt
Breaking Bullish Flag Incase Of Successful Breakout Expecting 20%-30% Bullish Move
Qntusdt

Qnt Looks Promising Over All Moving Upward & Breaking Bulish Flag In h4 Timeframe
Incase Of Successful Breakout expecting 25 To 30% Bulish Move

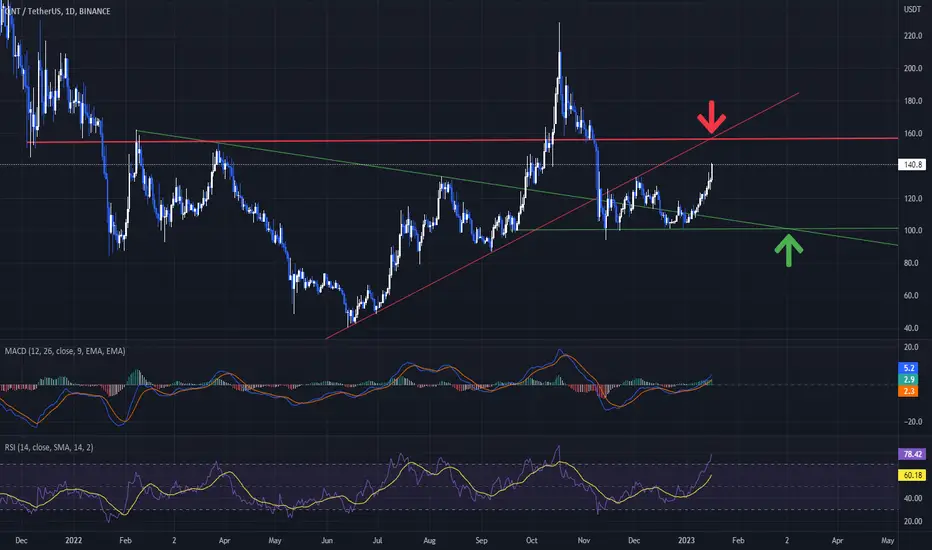
QNT Trade ideaThis one is making a Triangle
Well expecting to bonus from red marked region for continuation and third push.
Green lines are my targets for long position.

QNT/USDT Elliott Wave count DailyQuant price rejection into 0.5 fib retracement of the last move to the downside, that may signal an end of the B wave.
Price may go to the downside with first strong support at the 0.618 fib extension zone where also we have 0.764 fib retracement of the first abc (black count).
If we claim back above 0.382 (price 145.2) fib retracement than we may continue to the upside and still has this chance for this move to the upside (blue abc) to be an impulse(red count). The chance will go if the price will break below red line (125.8) and we may see an acceleration of the price to the downside from this level.

QNTUSDT POTENTIALLY 200% Expecting #QNTUSDT to potentially move to the upside up to 200% May even go higher as we know market is circling, And can also go lower
DYOR

QNTUSDT Analysis - 3 FEBRUARY 2023Hello Guys, Today's Analysis is on the QNTUSDT Symbol in a 15M Time frame, I Hope it Will be Useful for You, Don't Forget to Like, Follow, Comment

QNTUSD: Daily VCPVCP: 21W 59/7 4T
The posted chart contains a VCP (volatility contraction pattern). The first label "W" stands for weekly and shows the duration of the entire consolidation. In the middle label, the percentage of contractions is indicated (for example, "15/4"), with 15 representing the -15% depth of the base and 4 representing -4% of the last contraction. The last part "T" represents the number of contractions. The light blue lines in the chart correspond to the contractions. A more detailed description can be found in Mark Minervini's books.
RS stands for relative strength and measures the strength of the stock compared to the overall market. The value range is 1-99 with 99 being the highest value. The rank was generated by fyntrade.

QNT/USDT Elliott Wave count 1H TFExpended flat correction to the upside for Quant that may have been ended and it will turn to the downside.
I will trade short with entry below 147 and stop lose 166.
I will post updates when I will see more price action.
Good luck!

Quant ABC to POCAfter a sustained rise, a small bearish divergence seems to be on the rise to bring some cooling down.
This along with the ABC I have in there could bring the price to the current point of control (taken over the major uptrend).
In case the Bulls have a taste for it and push through to break the resistance line of the triangle of the bigger picture it is important to gain that level to set their sights on the #ATH.
Note if a level like $94.3 is broken then a new Low will be made which will be a bearish signal and may result in a decline towards the $63 ~ $7
be free to leave a comment

QNT : DAY TRADE VOLUMEQNT showing volume view for day trading.
We will follow the coin to see the last price actions.
Exactly since 147, this coin did enter into the important zone, 147 is an important support, which could bring this point new target of $188 USD.

QNT update - we do best TAQNT crypto is the native token of the project, which lives on the Ethereum blockchain. This guide explains what Quant is, how it works, and how it could change the way data, information, and assets move across the digital financial ecosystem. Quant's native token, QNT crypto, provides access to various services and apps on the Quant platform

LONG QNT/USDT
LONG QNT/USDT AT : 106
TP: 121
TP2: 133
TP3:153
SL: CLOSE BELOW 99
Once TP1 reached move stop to BE.
NOTE : 🚨 Not financial advices 🚨
The content provided on this channel is not a manual for any financial activity.
It only represents my personal market and financial view.

28 % profit opportunity In phase D of the Wyckoff scheme. I would buy ONLY after the price passes the High of SOW. The TP would be based on the volume profile of a higher timeframe.
Good luck.
-m

Quant (QNT) formed a bullish Gartley for upto 12% pumpHi dear friends, hope you are well and welcome to the new trade setup of Quant ( QNT )
Our last successful trade of QNT was below:
Now on a 4-hr time frame, QNT with BTC pair has formed a bullish Gartley move for another pump.
Note: Above idea is for educational purpose only. It is advised to diversify and strictly follow the stop loss, and don't get stuck with trade

Ichimoku Analysis for QuantIf you are in $QNT then use these levels as your support and resistance.
Supp: 134
Res: 161

Quant (QNT) Short positionWhile the market of crypto goes up, it also must come down for a correction of the market. Here's my point of view

Quant longQuant is bouncing off the Fibonacci 0.618 retracement zone which is also in line with the support level. Bullish movement to resistance level at 148 is expected to happen.

QNT : AT BREAKOUT POINTSince most markets are stable, QNT shows a trend where it's able to break out if it confirms the next view on the chart.
The point we did add is an important volume point and the same time a breakout point.
It's interesting to see if QNT is able to gain the breakout point.
At this moment QNT is still not at the point of breakout.

General levels to watch for key price action!Set your alerts because both of these levels will offer up some great opportunities in the coming weeks.
BarendsCrypto #Best #QNT TAQuant launched in June 2018 with the goal of connecting blockchains and networks on a global scale, without reducing the efficiency and interoperability of the network. It is the first project to solve the interoperability problem through the creation of the first blockchain operating system.

QNTUSDT - Short - Broadening WedgeQNT is currently forming an ascending broadening wedge pattern on daily timeframe. An ascending broadening wedge is a bearish reversal chart pattern. Where the upper line is the resistance line and the lower line is the support line. As we can see in the chart that it´s moves increase with higher magnitudes. This pattern should be traded when the price breaks out of the support line.
Looking at the pattern combined with the three indicators we can conclude it´s currently in an overbought condition. So it´s likely for the price to retrace. The three indicators are Bollinger Bands, RSI 14 and Stochastic.
In our opinion it´s more likely for the price to retrace and pump once more before it breaks out of the support line. So for now Target 1 in prioritized. Before targeting the other two targets we have to wait what happens after Target 1!
All the details are shown on the chart.
Goodluck!

Quant #QNT ideaWho Are the Founders of Quant?
Gilbert Verdian, one of the founders of the Quant network, had the idea for the blockchain project while he was working in the healthcare sector. Verdian identified the importance of interoperability in ensuring that patients registered on different platforms are covered.

QNTUSDT #DYOR i hope this pattern work this time very well. but don't expect 100% QNT will drop if BTC and market goes to bullish mode than pattern work as bullish pattern and pump to upper side so #DYOR
