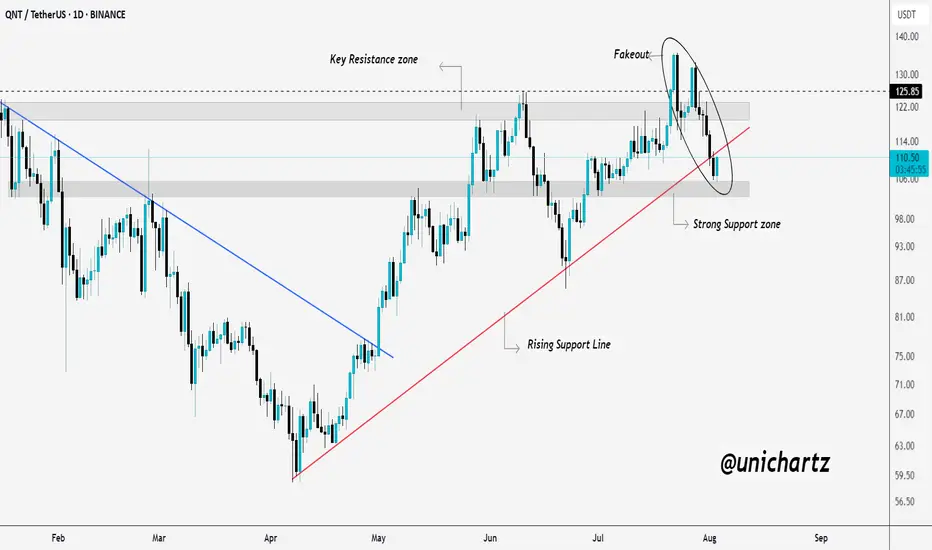
QNT Price Action Heating Up at Critical ZoneGETTEX:QNT attempted to break above its key resistance zone but ended up creating a fakeout, trapping late buyers at the top.
The sharp rejection dragged the price back down toward a strong support zone, which also aligns with the rising trendline.
This area is now a key decision point, if the price holds, a bullish reversal could follow. But if it breaks below, further downside is likely. This level will define QNT’s next major move.
DYOR, NFA
Qntusdtlong
$QNTUSDT Breakout – 120% Move Ahead?GETTEX:QNT just broke out of a major triangle pattern that’s been building for months.
With this breakout above $121, the chart hints at a strong move ahead, possibly up to $260.
If it holds above the $108 zone, this could be the start of a big rally. One to watch closely.
DYOR, NFA

QNT Accumulating Under Resistance — Big Move Ahead?QNT is showing strength, but a key test lies ahead.
After breaking out of its previous downtrend (red line), QNT has formed a strong rising structure supported by the blue trendline.
The price is currently consolidating just below the key resistance zone, attempting to gather momentum. This is a classic sign of healthy price action — retesting higher levels while maintaining support.
As long as QNT holds the strong rising support line and the lower support zone, the bullish structure remains intact. A clear breakout above the resistance zone could trigger the next leg higher.
However, if price breaks below the rising support, we could see a pullback toward the lower zone for re-accumulation.
For now — it’s a wait and watch at the resistance. Bulls need to prove their strength.
DYOR, NFA

#QNT/USDT#QNT
The price is moving in a descending channel on the 1-hour frame and is expected to continue upwards
We have a trend to stabilize above the moving average 100 again
We have a descending trend on the RSI indicator that supports the rise by breaking it upwards
We have a support area at the lower limit of the channel at a price of 86
Entry price 92
First target 98
Second target 103
Third target 110

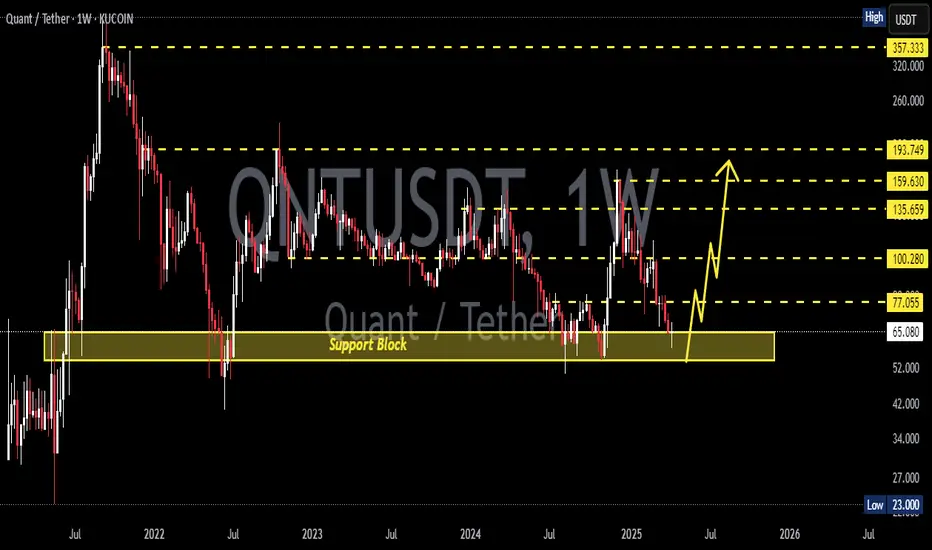
QNTUSDT 2D AnalysisQNT ~ 2D Analysis
#QNT Buy on retesting this support block or buy after successfully breaking this resistance line with a short term target of at least 10%+.

QNTUSDT 1WQNT ~ 1W Analysis
#QNT Buy gradually from here if you still have a Conviction on this coin with a short -term target of at least 15%+.
Quant (QNT): Entering a Bullish ScenarioStrong Upside Potential
Quant (QNT) has officially entered a bullish phase, as the price refused to drop below $84, signaling a strong buying zone and market confidence. Currently trading at $106, QNT is showing momentum to easily break through key resistance levels at $130 and $170 in the coming months.
If the bullish trend continues, QNT could be on track to challenge its all-time high and potentially set a new record by the end of 2025.
Key Levels to Watch
Support Zone: $84 (strong rejection area, confirming bullish sentiment).
Short-Term Resistance: $130 (first breakout level).
Mid-Term Target: $170 (key area before testing new highs).
Long-Term Potential: New all-time high by late 2025, depending on market conditions and demand for QNT’s blockchain solutions.
Conclusion: QNT Positioned for a Major Breakout
With solid support at $84 and a strong push above $106, QNT is poised for a significant rally. The next major moves include breaking $130 and $170, which would set the stage for a new all-time high by the end of 2025.

#QNT/USDT#QNT
The price is moving in a descending channel on the 1-hour frame and is adhering to it well and is heading to break it strongly upwards and retest it
We have a bounce from the lower limit of the descending channel, this support is at a price of 92
We have a downtrend on the RSI indicator that is about to break and retest, which supports the rise
We have a trend to stabilize above the moving average 100
Entry price 43
First target 95
Second target 97
Third target 99

QNTUSDT 1WQNT ~ 1W Analysis
#QNT Buy gradually from here if you still have a Conviction on this Coin with a minimum target of 20%+.

QNTUSDT 1WQNT Update ~ 1W
#QNT If you still have Conviction on this coin,. This support block would be a very good buying place for now. With a minimum target of 20%+

QNT Breaks Out! Is a 64% Rally on the Horizon?QNT/USDT has broken out of a descending triangle, signaling a potential bullish move. If the breakout holds, the price could target a 64% upside, as projected by the measured move.
Watch for a retest of the breakout level and triangle support for confirmation.

#QNT/USDT#QNT
The price is moving in a descending channel on the 4-hour frame and it was broken upwards
We have a trend to stabilize above the moving average 100
We have a downtrend on the RSI indicator that supports the rise by breaking it upwards
We have a major support area in green at a price of 58.00
Entry price 63.90
First target 71.60
Second target 76.50
Third target 82.90

QNTUSDT Is a Bullish Breakout or Bearish Fakeout—What’s Next?Yello, Paradisers! Is #QNTUSDT gearing up for a powerful rally, or could we be on the brink of a deeper pullback? Here's what you need to know:
💎#QNT has shown signs of bullish strength by breaking above a key resistance level, which has now been retested as support. If the price continues to respect this support, it could signal a bullish continuation. The next critical step for confirmation is a break above $95.6, followed by a daily candle close above this level. If this happens, we could see QNT pushing toward its major resistance target in the next leg upward.
💎If the support fails to hold, there’s a risk of a fakeout, with QNT potentially dropping toward the $70 demand zone. This level is crucial for sustaining any bullish momentum. A rebound from here would be necessary to reclaim the support at $82, allowing the bullish scenario to remain in play.
💎Should QNT break below the $70 demand zone and close beneath it on the daily chart, it would invalidate the bullish outlook. This could lead to further downward pressure and a deeper correction in the coming sessions.
Remember, Paradisers, the market is a game of probabilities, not certainties. Always trade with clear confirmations, and never let emotions dictate your strategy. Play it smart and stay disciplined!
MyCryptoParadise
iFeel the success🌴

QNTUSDTQNT ~ 1W
#QNT This is the lowest support block for now. if you still have Conviction on this coin,. Buy gradually on this support block,. With a minimum target of 20%++

QNTUSDT 1WQNT ~ 1W
#QNT Getting the lowest price is extremely rare.
now is the right time to buy COINBASE:QNTUSD , This is the lowest price so far.

#QNT/USDT#QNT
The price is moving within a bearish channel pattern on the 12-hour frame, which is a strong retracement pattern
We have a bounce from a major support area in the color EUR at 68.00
We have a tendency to stabilize above the Moving Average 100
We have a downtrend on the RSI indicator that supports the rise and gives greater momentum and the price is based on it
Entry price is 75.00
The first target is 86.00
The second goal is 94.30
The third goal is 102.90

QNTUSD 1WQNT ~ 1W 📈
#QNT It is very interesting to make purchases in this Support zone. We will make purchases in stages with a minimum target of 20% of this Support Zone.

#QNT/USDT LONG#QNT
Since July 2022, the price has been moving in a descending triangle pattern
The pattern was broken upward, and the Moving Average 100 was broken
Current price 110.70
First goal 131.20
Second goal 159.80
Please pay attention to the correction areas on the chart

#QNT/USDT#QNT
It is moving in a bullish flag for 1 day and the price has committed to the green support area at the 98 level
We have a higher stability moving average of 100
We have bullish momentum on the RSI and an uptrend
We have a current breakout of the channel to the upside
Entry price is 121.30
The first goal is 131.00
The second goal is 141.00
The third goal is 149.00

QNT/USDT IDEAOn the weekly timeframe, the QNT/USDT trading pair has formed a triangle pattern. This pattern typically indicates a period of consolidation and often precedes a significant price movement. Traders and investors are currently awaiting a breakout from this pattern. If the breakout is successful, it is anticipated that the price of QNT will experience a substantial increase.
Considering the technical analysis, there is a bullish sentiment regarding this breakout. In the event of a successful breakout from the triangle pattern, there is a strong possibility that the price of QNT could soar. It is speculated that a bullish move of 100-200% could potentially occur once the price breaks out of this triangle pattern.
It should be noted that this analysis is purely based on technical indicators and speculation. It is crucial for individuals interested in trading QNT/USDT to conduct their own research (DYOR) and not solely rely on this information for making financial decisions.

QNTUSDT - BUY OPPORTUNITYHOLDING QNT to swing area and beyond - This coin is one of my top favs - If you want to understand its project - I highly advise you read its whitepaper.
I believe this coin can MC to 100B and beyond as cryptos take off, Web3 becomes more advanced and in play, Future will be tokenised with blockchain! Your IDs, Photos, anything digital you own etc
If you understand blockchain, you will understand what I mean. You can't dupe a FAKE photo, clone it etc from its original makers as blockchain will help protect its authenticity, originality and ownership. This has nothing to do with Quant, just in general my own opinion and view on the future of Blockchain in our daily life.
Trade Safe Habibis - The future is Blockchain!

QNTUSD 1WQNT ~ 1W 📈
#QNT It's only a matter of time until this resistance line is broken through, make purchases gradually from here, with a target of at least 20%++ 🚀🚀

QNTUSDTQNTUSDT is trading in range bound with 10% range.
some time ranges are the best things to play just buy the support and sell the resistance.
as this one is 10% range which can deliver fine risk to reward.
currently the price is at support level and being rejected due to buying pressure.
will the pair head back to resistance area ?
what you guys think of this idea ?
