$QQQ Looks to Be in a Do or Die AreaNASDAQ:QQQ For a bull case, I need to see this get above both the horizontal area of resistance and the downtrend line on this 65 minute chart.
It looks like it could be forming yet another bear flag. All TBD. If it breaks the flag down, I would expect another leg lower.
So what we have here is a case of do or die. Hope this helps
QQQ

AMD IS A MUST BUY 12 MARCH 2025Amd at current price is a mist buy for investment. It is technically looking super strong. I have ready explained the price action on AMD ontrading view.

SPY/QQQ Plan Your Trade for 3-12-25 : Rally111 PatternToday's Rally pattern in Carryover mode may prompt a powerful base/bottom move in the SPY/QQQ.
In today's video, I explain in great detail how I read these charts and why the Excess Phase Peak (EPP) patterns are so important.
We are moving into the Consolidation Phase of the EPP patterns for the SPY/QQQ.
We are already into the Consolidation Phase of an EPP pattern for Bitcoin
Gold and Silver are a bit mixed. Yet Silver has already broken above the upper EPP Peak, rallying into a new EPP Peak level. Meanwhile, Gold is still struggling to find momentum for a bullish breakout.
While I don't believe the US markets are poised for a big downward price move, today's video shows you what may be likely 4 to 12+ months into the future.
So, pay attention to today's video. It clearly illustrates how to use the EPP patterns with Fibonacci and shows you what I believe could happen over the next 6 to 12+ months.
If the SPY/I continues to try to rally higher today, it will be interesting. This means we have potentially found our consolidation base and are now moving into a very volatile sideways consolidation phase.
Get some.
#trading #research #investing #tradingalgos #tradingsignals #cycles #fibonacci #elliotwave #modelingsystems #stocks #bitcoin #btcusd #cryptos #spy #gold #nq #investing #trading #spytrading #spymarket #tradingmarket #stockmarket #silver

Bearish & Boring? Maybe. Profitable? Definitely.Bearish & Boring? Maybe. Profitable? Definitely. | SPX Market Analysis 12 Mar 2025
You know that feeling when you wake up and wonder if you’re stuck in a time loop? Yeah, me too.
For what feels like the hundredth time, I’m reporting that the bear move is grinding lower. The difference? The profits keep stacking up—so I’m not complaining.
Yesterday’s rally was supposedly triggered by Canada pausing tariffs, but let’s be real—this market is looking for any excuse to bounce. Yet, the overall trend remains the same: a slow, stair-stepping drop. Based on this drop-pause-drop rhythm, I suspect we’re entering the next pause before another leg down.
My bear boots are full, my trade allocations are set, and I’m waiting for two tranches to exit profitably before considering any new plays. Until SPX clears 5850, the bullish setups stay on the shelf.
This is the good kind of waiting—the kind where the market moves for me instead of me chasing it.
---
Deeper Dive Analysis:
If it feels like Groundhog Day, you’re not alone. The bearish grind continues, slowly pushing lower, delivering small but steady wins. Unlike a panic-driven crash, this move is unfolding in slow motion, keeping traders on edge, wondering if a rally is lurking around the corner.
📌 A Market Looking for an Excuse to Bounce
Yesterday’s rally attempt was supposedly fueled by news that Canadian tariffs were being paused, but let’s be honest—this market is desperate for any reason to move higher. The reality? The larger bearish structure remains intact.
Every bounce so far has been short-lived.
The market keeps following a drop-pause-drop pattern.
We’re likely entering the next "pause" phase before another move down.
📌 My Trading Approach—Locked, Loaded, and Waiting
Right now, my bear boots are full, meaning I’m not adding new positions until my current tranches exit profitably.
Two tranches are set to exit with profits by the end of the week.
If we push lower or continue sideways, I’ll take my exits and reassess.
Until SPX clears 5850, I won’t even think about bullish setups.
📌 What’s Next? The Good Kind of Waiting
There’s no need to chase trades or force new entries. I’m simply letting my plan play out. If the market continues its slow-motion decline, I’ll collect my wins, reload selectively, and wait for the next prime setup.
For now, I sit back and enjoy the show—because this time, the market is working for me, not against me.
---
Fun Fact
📢 Did you know? In 2008, Porsche trapped hedge funds in one of the greatest short squeezes in history, briefly making it the most valuable company in the world—all thanks to a secretive stock manoeuvre.
💡 The Lesson? Markets don’t just move up and down—they can also turn traders inside out. The wrong bet at the wrong time can be devastating… unless, of course, you have a system that keeps you on the right side of the trade. 🚀

QQQ .618 I have now moved to a FULL LONG CALLS The low has dropped into the crash cycle due the week of 3/10 to 3/13 .We now have a large ABC decline down to .618 At the low .I will now look for a min of three weeks of Upside MIN . Time to be LONG is NOW . best of trades WAVETIMER

SPY/QQQ Plan Your Trade For 3-11-25: BreakAway PatternToday's Breakaway pattern offers a fairly strong potential the SPY/QQQ will attempt to find support today. I know I've been telling everyone the markets should find support and are seeking support for the past 3+ trading days. But, the SPY has recently crossed the 50% Fibonacci pullback level and the QQQ has recently crossed the 61.8% pullback level.
These levels will act as moderate support. So, I'm urging traders to patiently wait out the early morning volatility. Today could be incredibly volatile while the markets attempt to hammer out critical support.
BTCUSD has moved to consolidation lows and will likely attempt a moderate rally up to consolidation highs.
This is another reason I believe the SPY/QQQ are attempting to base/bottom near current lows.
Gold and silver have recovered from recent lows very aggressively and are moving into a CRUSH pattern. I believe that the CRUSH pattern will resolve to the upside for metals.
At this point, I believe the markets are relatively well exhausted to the downside. But, we must let price be the ultimate dictator of trending and opportunity.
Thus, it is essential to let the markets FLUSH OUT this potential base/bottom in early trading today before getting aggressive with any trades.
Ultimately, we need to see the markets identify support in this downtrend. If we don't find any support before the end of this week, then we are going to see a very large downward price move that will invalidate many of my expectations, potentially leading to a very large breakdown in US/global markets.
Buckle up. The markets are nearing the DO or DIE phase due to how these Excess Phase Peak patterns are playing out.
I see support setting up and a base/bottom building. If I'm wrong, we'll see a continued downward price trend.
Get some.
#trading #research #investing #tradingalgos #tradingsignals #cycles #fibonacci #elliotwave #modelingsystems #stocks #bitcoin #btcusd #cryptos #spy #gold #nq #investing #trading #spytrading #spymarket #tradingmarket #stockmarket #silver


$SPY Short Term Bullish atm.. idea for BullsWell... seeing is we hit my target, I thought I might bless the Bulls with a little bit of Eye Candy.... This is what you want...
The Fib breakdown of the Golden Pocket above at the 1.61... we hit the retracement... and now back to the .78
We hold here and it can get bullish quick.
Bearish Path in Next post... otherwise we make a lower high and fall to $525 and fast.

QQQ long term trend is down with short-term relief rallyI am guessing a bit more downside before we see a relief rally. The AI bubble is starting to unwind, and that falling knife is sharp. I am patiently waiting for some version of a short-term bottom. You can see in the chart that price is has several key support lines within near reach. I would expect testing and hopefully finding some support in the coming days. If it is like the COVID bubble unwind, then we could see a strong reverse rally out of this range. However, I think it is pretty clear QQQ is in correction with a convincing loss of the 200 day SMA.

NASDAQ: Correction or Crash?!If this Monthly Chart for March holds then the NASDAQ:QQQ is COOKED!
Next Level: $450
Crash level: $370-$400 🥶
- Breaking out of WCB Trend
- Volume is WAY less than 202 Market Crash (Can get worse)
- Breaking out of Bullish Channel
- Topping tail wicks
Not financial advice

$1.51 to $3.25 casually DOUBLED while rest of the market crashes$1.51 to $3.25 casually DOUBLED today after being mentioned in chat many times
Sweet catch on NASDAQ:HMR 👏🤑
All while the rest of the market continues to hits new lows on a big red day NASDAQ:TSLA NASDAQ:NVDA AMEX:SPY NASDAQ:QQQ AMEX:DIA NASDAQ:META NASDAQ:AMZN NASDAQ:GOOG
Got to love these type of stocks
AEON 1.26 - 1.33 (+5.5%)
HMR 3.02 - 3.16 (+4.6%)
Total profit today: +10.1%
Nice profit today again while the rest of the market goes into deeper red.
Bulletproof strategy delivers again, no matter the overall market conditions.
Congrats!
See you in the morning!

QQQ ShortBroke the weekly parallel channel with a bearish divergence in the weekly chart, confirming the down momentum. Could see a potential 380 ish range.

SPY/QQQ Plan Your Trade For 3-10-25: Gap/BreakawayToday's Gap Breakaway pattern suggests the markets will attempt to gap at the open, then move into a breakaway trending phase.
Given the downward price trend currently in place, I believe the markets will gap downward, then possibly attempt to move higher as we pause above the 568 (pre-election) support level.
Ultimately, I see the markets entering a brief pause/sideways price trend (maybe 2 to 5 days) before rolling downward again into the April 14 and May 2 base/bottom patterns.
I see very little support in the markets right now - other than a potential BOUNCE setup this week and into early next week.
I'm not suggesting this bounce will be a very big bullish price reversion. My upper levels are still in the 590 to 600 area for the SPY. But I do believe the markets are likely to try to find support near the 565-575 level.
Gold and silver will move into a Harami Pattern today (sideways consolidation). I don't expect much related to a big move in metals today.
Bitcoin is still consolidating in a very wide range. I expect the next move for Bitcoin to be a bit higher over the next 3-5+ days, so I believe the SPY/QQQ may trend a bit higher for about 3-5 days.
Overall, I suggest traders stay very cautious of volatility this week. Obviously, the trend is still bearish and the current EPP phase setups suggests we are consolidating into a sideways channel before moving downward seeking the Ultimate Low patterns.
Therefore, any bounce/pause in price will be very short-lived.
Get some.
#trading #research #investing #tradingalgos #tradingsignals #cycles #fibonacci #elliotwave #modelingsystems #stocks #bitcoin #btcusd #cryptos #spy #gold #nq #investing #trading #spytrading #spymarket #tradingmarket #stockmarket #silver

Stock Market Forecast | TSLA NVDA AAPL AMZN META MSFTStock Market Forecast | NASDAQ:QQQ AMEX:SPY
Mag 7 Forecast | NASDAQ:TSLA NASDAQ:NVDA AAPL AMZN META MSFT GOOGL

QQQ Trading Opportunity! BUY!
My dear friends,
QQQ looks like it will make a good move, and here are the details:
The market is trading on 491.81 pivot level.
Bias - Bullish
Technical Indicators: Supper Trend generates a clear long signal while Pivot Point HL is currently determining the overall Bullish trend of the market.
Goal - 509.46
About Used Indicators:
Pivot points are a great way to identify areas of support and resistance, but they work best when combined with other kinds of technical analysis
———————————
WISH YOU ALL LUCK

SPY - support & resistant areas for today March 7, 2025The key support and resistance levels for SPY today are provided above.
Understanding these levels in trading can offer valuable insights into potential market movements. They often indicate where prices may reverse or consolidate, serving as important signals for traders considering long (buy) or short (sell) positions.
These levels are calculated using complex mathematical models and are specifically tailored for today’s trading session. They may change as market conditions evolve.
If you find this information helpful and would like to receive these insights every morning at 9:30 AM, I invite you to support me by boosting this post and following me @OnePunchMan91. Your engagement is greatly appreciated! However, please note that if this post does not receive more than 10 boosts, I will have to reconsider providing these daily updates. Thank you for your support!

SPY/QQQ Plan Your Trade For 3-7-24 : Rally PatternAs many of you know, I've been expecting the SPY/QQQ to find support (seeking a base/bottom) for the past 3+ days. The amount of selling has been somewhat extreme. We are currently in a downtrend.
So, my expectation of a base/bottom is related to the breakdown of the Excess Phase Peak pattern and the previous support levels (pre-election and recent lows) that suggest price will attempt to hold/base/bottom near recent support.
As of yesterday's close, price had broken downward, still within the support range.
So, again, I urge caution as I believe price will be very volatile while attempting "hammer out a base/bottom" (if it happens).
Overall, my bias is to the downside because of the current trend. Yet, The RALLY pattern today suggests we may see a recovery above 577 on the SPY which may lead to a rally targeting 580+.
Gold and Silver are holding up well and should setup a base/bottom today on the Counter-Trend Top/Resistance Pattern. I don't expect Gold and Silver to rally very strong today. I expect more of a melt-up in trend for metals.
Bitcoin is still consolidating and moving into a very tight Flag Apex range. As I pointed out in today's video, a shorter-term Flag apex will be reached on Sunday (3-9). I believe Bitcoin will become very volatile over the next 3+ days - attempting to break away from a GETTEX:13K consolidation range.
This apex volatility could drive the SPY/QQQ into extreme volatility as well.
Unless you are very skilled at targeting short-term price swings - stay very cautious of this volatility as it could end up turning and biting back.
It's Friday. I'm planning on watching and only trading when I believe there is a very clear opportunity for profits.
I got dinged around (took some lumps yesterday) trying to trade while driving and handling family issues. Lesson learned - don't force it.
The markets will settle into a trend next week. So, be prepared to sit and watch if you don't like what you see on the charts today.
Get some.
#trading #research #investing #tradingalgos #tradingsignals #cycles #fibonacci #elliotwave #modelingsystems #stocks #bitcoin #btcusd #cryptos #spy #es #nq #gold

TSLA Weekly Chart Analysis- NFATSLA Weekly Chart Analysis- NFA
-4Hour chart showing Bullish RSI Divergence
- Expecting another bearish day to sweep Sellside ($238)
-Great place to buy longs here
-Weekly iFVG(Green rectangle) can act as support zone
-Also approaching Weekly 200 SMA(Support)

+405% day from $0.35 to $1.77 for $PSTV WOW 🔥 +405% from $0.35 to $1.75 NASDAQ:PSTV 🚀 What market sell off 🤷🏻♂️ we don't know anything about that, our strategy is getting us paid no matter the overall market circumstances 💪 It's been like this for over a decade
P.S. AMEX:SPY is at 200 moving average, if it cracks below it we could see NASDAQ:TSLA NASDAQ:NVDA NASDAQ:AMZN NASDAQ:GOOG NASDAQ:META and many others go way lower.

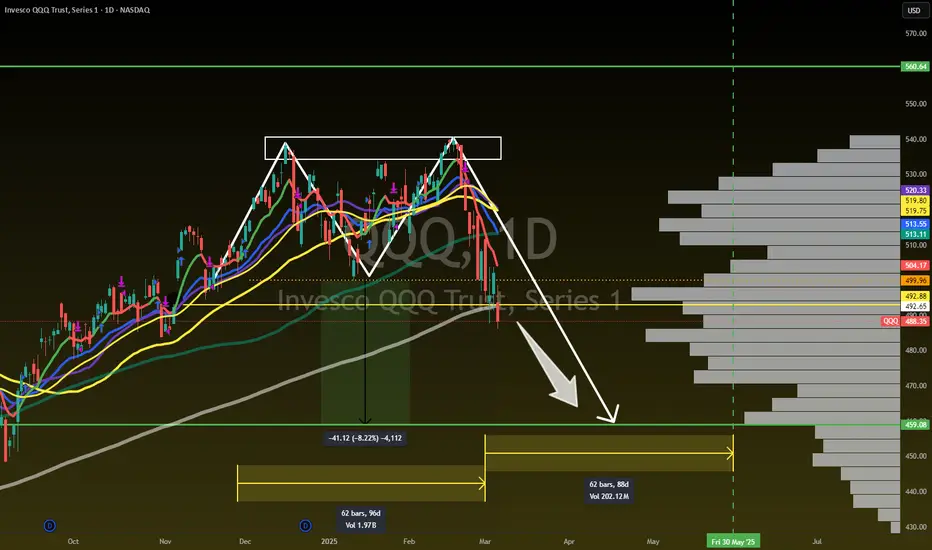
The Double Top is in on QQQNASDAQ:QQQ - DOUBLE TOP 🗻🗻
No Denying it NOW!
Measured Move is $459 by 30May
Not financial advice
NVIDIA Stock Goes Diving-Dressed ahead of Dotcom Crash RepeatingNvidia’s stock recently experienced a significant decline, tanked to 6-month low reflecting a mix of investor sentiment shifts, market dynamics, and company-specific concerns.
Here’s our @PandorraResearch Team ̶M̶u̶m̶b̶o̶ ̶j̶u̶m̶b̶o̶ fundamental and technical breakdown of what is going on with Nvidia stock NASDAQ:NVDA and why:
1. Cooling AI Enthusiasm
Nvidia has been at the forefront of the AI boom, with its chips powering advanced AI platforms. However, investor optimism about AI-related stocks has begun to wane. While Nvidia reported impressive revenue growth (122% in recent earnings), its future guidance failed to meet sky-high expectations. Investors are increasingly concerned that the returns from AI investments may take longer to materialize than initially anticipated. This cooling enthusiasm has led to a reassessment of Nvidia’s valuation, contributing to the stock's decline.
2. High Valuation Concerns
Nvidia’s price-to-earnings (P/E) ratio had soared to levels significantly higher than industry averages, reflecting lofty expectations for its future growth. At its peak, Nvidia was trading at 45 times expected earnings, compared to the S&P 500’s average of 22 times. Such high valuations often make stocks vulnerable to corrections when market sentiment changes or growth slows. The recent sell-off suggests that some investors are beginning to view Nvidia’s stock as overvalued.
3. DOJ Antitrust Investigation
Another factor weighing on Nvidia’s stock is news of a U.S. Department of Justice (DOJ) subpoena investigating potential antitrust violations. The probe reportedly focuses on whether Nvidia’s business practices limit customer options or stifle competition. While no formal charges have been filed, such investigations create uncertainty and make investors jittery about regulatory risks.
4. Broader Market Pressures
The decline in Nvidia’s stock also coincides with broader market challenges. Rising interest rates and concerns about the U.S. economy have led many investors to shift away from high-growth tech stocks like Nvidia toward more stable, rate-sensitive investments. Additionally, a general downturn in the Nasdaq Composite index has amplified the pressure on Nvidia shares.
5. Profit-Taking After a Massive Rally
Before its recent drop, Nvidia had seen meteoric gains—its stock surged over 120% in one year and briefly became the world’s most valuable company. Such rapid growth often attracts profit-taking as traders sell off shares to lock in gains. Analysts described this as a "routine selloff" after an extraordinary rally.
Technical challenge
The main technical 3-month log scaled graph for Nvidia's stock indicates on unattainable highs never seen before since Dotcom crash, reached through a massive long term path inside upside channel.
Conclusion
Nvidia’s stock decline is driven by a combination of factors: tempered AI optimism, valuation concerns, regulatory uncertainty, broader economic pressures, and profit-taking after an exceptional run-up. While some analysts remain bullish on Nvidia due to its dominance in AI hardware, others see the pullback as a natural correction in response to overextended valuations and shifting market conditions.
--
Best schadenfreude wishes,
@PandorraResearch Team 😎

QQQ - NASDAQ Has Never Been This ExpensiveQQQ relative to money supply reveals that markets have never been this expensive in history, despite all the money that was pumped in over covid.
Tulips!
Caution is in order despite what "experts" may tell you.

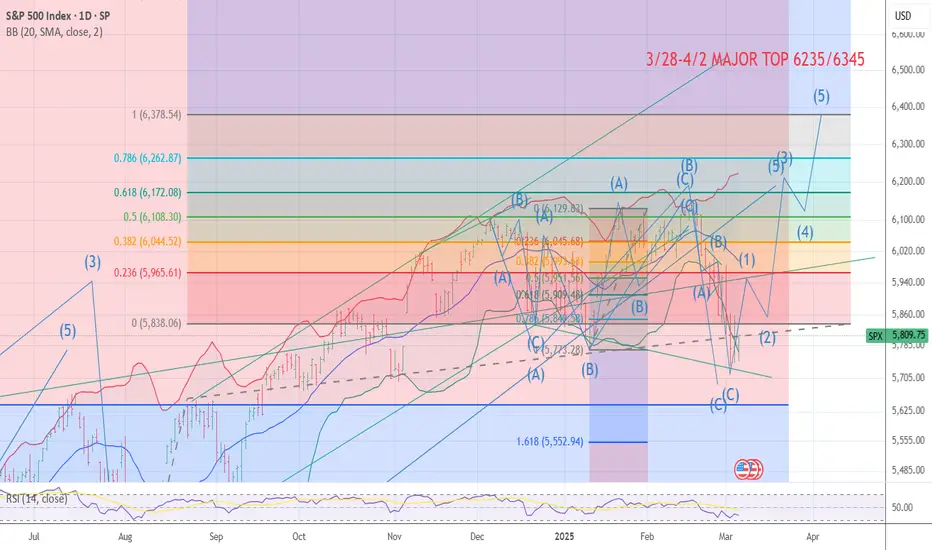
NEW BULL MOVE IS NEAR Wave 4 cycle low SETUPI am coming into the major and minor spiral cycle Low is has been due into 3/8 3/13 focus on the 10th for sometime . But the Crash cycle is in day 10 today and over the last 112 years data back to 1902 the crash cycle has been from 8 to 12 days long we are in day 10 Now .I have taken up a 75 % long deep in the money Calls into this morning drop I this give the market a chance of 30 % to drop to the lower target of 5644 But Put Call models are bell ringing now .I will move to 100 % long calls at 5723/5713 and move to 110 % long at 5644 MIT . after the low print and we break above 5909 on a close I have a confirmed LOW and we short see a major 5th wave blow off it should take 26 TD and the target min is 6183 and max to 6430 with 6235 being focus in the math In the QQQ 552 is a focus with 545 as the min max based on the Math 564 Tight range for the QQQ as it should be The DJI will see a minor new new above 45040 best of trades WAVETIMER