QQQ

TSLA has room on the daily chart for continuation.NASDAQ:TSLA has been on a strong run since the daily 50 SMA reclaim last week. If TSLA continues to build above $222 and takes out today's highs, there is room on the daily chart to $230 and $240 in subsequent days.

S&p 5400 coming Ai bubble popping as we speak 9/5 2024 NVDA books reflect sales to companies that now are under scrutiny geopolitics hot oil choppy avgo missed earnings rate cut drama the cooks at the BLS continue to chef it up with wild swings in reports and revisions all with the last US election in the rear view mirror

CRWD potential pop?Reclaiming 260 and breaking 263.40 I like it long possibly back to 300. Closing below 257.00 more lows on 24HR timeframe

QQQ forms horizontal support line QQQ has sold off quite a bit over the past 2 weeks. We are now starting to see consolidation as selling pressure reduces
Horizontal support line starts to form after sell off
Still within downward trading range
Could be stock is taking a breather before more selling continues
September and at times October are notably bad months of the year
We are seeing a settling right now, but we still are in a downtrend and the beginning of a historically bad month.

SPY/QQQ Plan Your Trade For 9-5 : Top-Resistance PatternToday's Top Resistance pattern should reflect a moderate price rally, leading to a peak in price, then followed by a roll-over in price before the close of trading today.
Follow my research. Remember we are using my SPY cycle patterns to help guide our future and current trades related to price action.
These patterns are not 100% accurate all the time - but I find them very helpful in understanding how to prepare/trade related to potential future price swings.
Again, outside news events, central banks/governments, wars and other massive events can disrupt these patterns for 3 to 10+ days. But, price always seems to return to the patterns over time. These disruptions are temporary.
Get ready for next week's big rally phase.
Get some.
#trading #research #investing #tradingalgos #tradingsignals #cycles #fibonacci #elliotwave #modelingsystems #stocks #bitcoin #btcusd #cryptos #spy #es #nq #gold

FED Rate Cut Sept. 19: Market ImplicationsFed expected to cut rates ~0.5% on Sept. 19
Short-term outlook:
• Likely market correction before/during the event
• "Sell the news" expected
• Traders may capitalize on retail investors' optimism around the FED rate cut
Why? Historical patterns show corrections often precede rate cuts. this time might be no exception.
FED rate cut market dynamics:
• Institutional investors take profits around the rate cut
• Potential liquidity squeeze as positions unwind
• Volatility and TVC:VIX will increase
Long-term:
• Rate cuts generally bullish over time
• Lower rates can stimulate economic growth
• But full effects may take months to materialize
Strategic considerations:
• Market dip can be a buying opportunities
• Consider index ETFs like SP:SPX and NASDAQ:QQQ and stocks with fundamentals or even Bitcoin. Personally, I will also add the leveraged ETFs AMEX:SSO and AMEX:QLD
• Consider dollar-cost averaging during volatility
Markets are complex. This analysis isn't financial advice. Always do thorough research and consider your risk tolerance.

QQQ in correction - How low will it go?QQQ lost the 20 day SMA yesterday. History shows that there is a very strong probability that it will go lower. Today say it hold at the support of the AI-based rally over the last year or so. It broke through that the other week, but then we say the strong rally. I noted back then that it felt like a dead cat bounce counter rally to me. Looks like it is proving to be true. It is going to be tricky knowing where this one will stop. I previous posts I noted that red trend line a critical level and that is where we saw the dramatic bounce start from. I am sure where this one will stop. QQQ is usually very bullish and the second of two corrections can often be less than that first. I am looking at that red trend line again, the 200 day SMA, as well as the center of the trading channel.

Bear Pressure Remains (Key Levels to Watch - SPX, NDX)Tuesday - Bear Candle breaking support
Wednesday - weak re-test of the support (now becoming resistance)
Bearish pressure remains firm with key levels lower on the major indexes.
Near-term bearish until price proves otherwise. Taking stops, protecting profits and managing hedges.
JPY "unwinding" is also back on the radar. I'll be watching the JPY strength and Nikkei correlation. I still hold long FXY through 2026 (call options)
Thanks for watching!!!

TSLA daily chart shows clean channels for trading this week.NASDAQ:TSLA has clean channels on the daily chart, both to the upside and downside, for trading this week. TSLA closed just below the daily 10 SMA, which is the next key supply it must reclaim before going higher and potentially testing the daily 325 SMA and daily 50 SMA just above that. If it can reclaim the daily 50 SMA, along with NASDAQ:QQQ building a strong base above its own daily 50 SMA, then TSLA will be in a strong position to push higher to the daily upper Bollinger Band, while continuing higher on the C to D leg of the Gartley harmonic discussed previously.
Alternatively, if QQQ continues to reject the daily 10 SMA and loses the daily 50 SMA demand, TSLA may lose its daily 200 SMA. This would invalidate the Gartley harmonic and TSLA would trade down to the next daily demand, which is the rising daily 100 SMA. I continue to be positioned long into next week, because I believe the upside potential is stronger on this name; however, it is important to always be prepared for both bullish and bearish scenarios in order to execute with confidence during the trading day.

ARM Short . US Stock122 below weak , already tl break
if yesterday low below sustain then very weak
121/119/116/114/112 target


AMZN Short , US Stock174 below weak
172.50/171/170 can test easily
170 below 164 will be next level where it can go

SE Short . US Stock76.50 below weak
75.50/74.50/73/70/67 can test
support break then it will be weak

SPY/QQQ Plan Your Trade For 9-4 : CRUSH Blends Into Rev-RallyYesterday's price move was clearly a CRUSH pattern I expected on Monday. Because of the holiday trading schedule this week, I believe the CRUSH pattern blended into Tuesday's trading - resulting in today's pattern being a blend of the Rev-Rally pattern on Tuesday and the Up-Down-Up pattern for Wednesday.
Overall, I believe the CRUSH pattern removed a lot of downward price pressure and set the markets up for a bigger upward move starting on September 9-11.
At this point, I believe the US markets will attempt to find a base/support and transition into the end of this week by "looking for support—then rallying away from support."
So, I expect the US markets to find a critical support level today or tomorrow, then begin to form a base and rally away from that support level.
Let's play what is in front of us on the charts and Get Some.
#trading #research #investing #tradingalgos #tradingsignals #cycles #fibonacci #elliotwave #modelingsystems #stocks #bitcoin #btcusd #cryptos #spy #es #nq #gold

QQQ falls back into bearish territoryQQQ past breakouts above shows it was false by selling off in a massive way with strong volume
Failed to hold above new support downward trend
Failed to hold above major horizontal support line
closed with hammer candle on high volume. This last item we dont expect to be a major turned around point back to bull. It should just be rise back up horizontal resistance before selling off again
Comparing with SPY we see that it has now for the first time broke its flat trading today and break below key support with strength. The confirmation between the indicates the bears are back in control

Is SMCI a buy? SMCI has lagged NVDA and many other semis.
Were now approaching a critical area...its make or break!
positive Daily divergence provides some hopes that were close to a near term bounce however after today semiconductor selloff the whole complex was shattered.
The fact that SMCI remained green while NVDA was down 10% should be a small win in itself...
The question is can it hold and build on this?
I do think its better positioned for a long than most semis.
No confirmed technical breakdown has occurred yet

Members Daily Analysis Markets get bludgeoned!
Commodities under pressure / Nat gas strong
Yield curve still inverted.
Vix flying!
Long Bonds sniffing out recession

SPY/QQQ Plan Your Trade For 9-3 : Reversal Rally Today.Today's SPY Cycle Pattern is a Reversal Rally.
After yesterday's CRUSH pattern (on the Labor Day holiday), we should expect the indexes to persist in a moderate rally phase (or melt-up) today.
I believe yesterday's CRUSH pattern played out very nicely on the ES.
Today's Reversal Rally pattern should result in the ES attempt to move back to 5653-5660.
For the SPY, that will be a move back to 563.00 to 563.40.
Overall, I believe today will show a solid attempt to move higher (melting upward) as the price slides into the end of this week very sideways/flat.
Starting on Sept 9-10, we should start to move into a rally phase for the SPY/QQQ.
Sit tight until then. These intra-day swings are perfect for day trading Gunslingers.
Get some.
#trading #research #investing #tradingalgos #tradingsignals #cycles #fibonacci #elliotwave #modelingsystems #stocks #bitcoin #btcusd #cryptos #spy #es #nq #gold

September Effect - Up/Down/Sideways - How I'm Trading ItSummer trading is officially done and the market will be news sensitive leading up to the big bad FOMC Rate Decision on September 18.
August's monthly candle is a wild one with a massive wick to the south and the bulls pushed the SPY within a whisker of all-time highs, Dow to several all-time highs, Nasdaq into a nice bullish recovery posture, and Russell the same (higher lows).
6 Central Bank Rate Decisions in September
US News on Employment and Inflation all rolling out before the FOMC
I'd like to see a seasonal dip or pullback to offer more accumulation opportunities before a run higher. Let's see how it plays out.

Stock Market | TSLA NVDA AAPL AMZN META GOOG MSFT AnalysisQQQ Forecast
Sp500 ETF analysis
Nvidia Stock NVDA Forecast Technical Analysis
Apple Stock AAPL Forecast Technical Analysis
Microsoft Stock MSFT Forecast Technical Analysis
Google Stock GOOGL Forecast Technical Analysis
Amazon Stock AMZN Forecast Technical Analysis
Meta Forecast Technical Analysis
Tesla Stock TSLA Forecast Technical Analysis

QQQ gives more strength to its bullish turn aroundToday QQQ started with another gap up breakout for the 2cd day in a row. Stock retraced then rallied again in the late day.
Stock gapped up again doing another breakout weakening the week long sell off trend.
Retracement that was expected sold off less and at slower pass than the day before
Late day smart money jumped in and pushed the stock to higher highs
Volume experienced a massive spike in last moments of trading which can be indication of price exhaustion. This should cause a temporary pull back next trading day
Overall the bull thesis for QQQ is getting stronger each day.

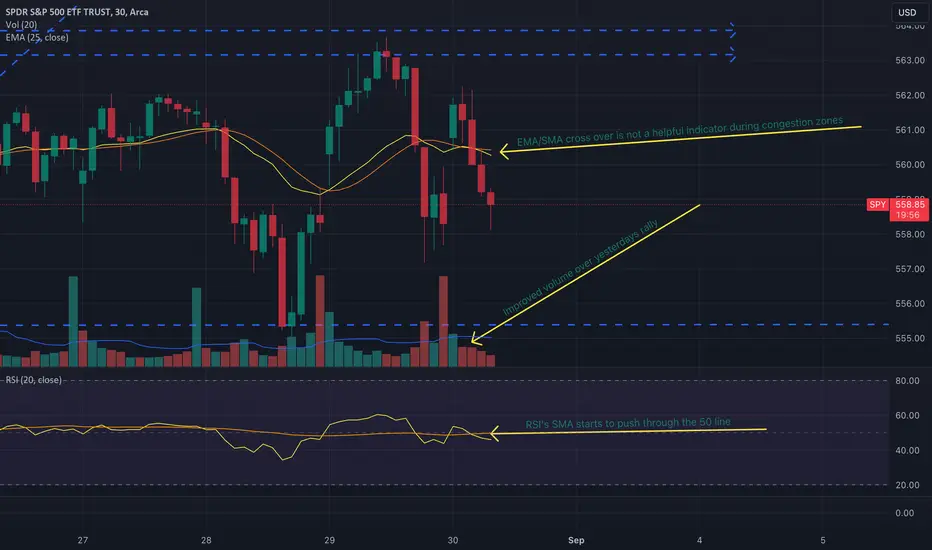
SPY shows more interest in rallying than beforeSPY is starting to show more signs that a breakout above the flat trading its in is coming
We see increased volume over peaks of previous rallies indicating agreement with pushing up prices
RSI's SMA starts to break through the 50 line
comparing to the QQQ, its experiences another false breakout above for the second day in a row. Showing the tech sector is attempting to turn around to the upside
SPY continues to still trade flat but show more confidence in its small rallies than previously