SPY/QQQ Plan Your Trade For 5-28 : Inside Breakaway PatternToday's Inside-Breakaway pattern suggests the markets may attempt to rally above yesterday's close on strong news or earnings. Today is the NVDA earnings day (after the close). I suspect trading will be somewhat flat ahead of these highly anticipated earnings.
Traders would be smart to position into a HEDGE ahead of the NVDA earnings this afternoon.
Obviously, if the earnings are good, the markets will react to the upside. If they are poor/weak, the markets could easily move aggressively downward.
All I know is the tariff moves over the past few weeks pushed gamers and others into buying high-end graphics cards back in April/May because everyone thought prices would skyrocket 30-50% or more. So, maybe NVDA will report strong revenue while costs increase.
It should be an interesting day after the close. Until then, I believe the markets will stay somewhat FLAT - anticipating NVDA data/comments.
Gold and Silver are still working through the FLAG APEX. Silver is already beyond the FLAG APEX and could make a big move higher at any moment. Gold still has one small downward price move to complete before the FLAGGING pattern is complete.
Overall, I believe Gold and Silver are forming a solid base near $3300/$33 for a strong rally in the future.
BTCUSD is stalling. In fact, the SPY/QQQ/BTCUSD are all stalling near the 0.75% Fib level (as shown on my charts). We may be setting up for that big breakdown I've been warning about. But, until we actually SEE price break out of the upward EPP Flagging channel - don't get overly confident of a BIG BREAKDOWN move.
My advice would be to HEDGE any aggressive trades you are trying to take right now. If you believe the markets are going to rally substantially, try to hedge that trade with some risk protection (longer-dated PUTS).
Today could be a catalyst day. We may get a breakout/breakdown move after NVDA's earnings/data.
Buckle up.
Get some.
#trading #research #investing #tradingalgos #tradingsignals #cycles #fibonacci #elliotwave #modelingsystems #stocks #bitcoin #btcusd #cryptos #spy #gold #nq #investing #trading #spytrading #spymarket #tradingmarket #stockmarket #silver
QQQ

TSLA: Break-out above bull flag, possible cup and handle?So, a few days ago, I posted about a bull flag forming on the daily chart for Tesla. This flag pattern was a period of consolidation following an incredibly whooping rally from the $270 mark to around $350 (around a 30% or so gain).
Today, we have a new break-out from this consolidation period, and as of writing right now, Tesla is up 7%. It has now breached the $350 resistance level.
If you look more closely, the chart pattern resembles something close to a cup and handle pattern. You have the cup base going from the 20th of Feb 2025 all the way to the 14th of May 2025. Our bull flag which lasted between the 14th of May until the 23rd of May (last Friday), could as well be a handle for the cup base.
A break-out from not only the bull flag but the cup and handle could signal a massive move towards $400, however $375 and $390 could be points of resistance, and it would be wise to watch for a cooldown in the short-term.
Upcoming this week, it might worth mentioning that NASDAQ:NVDA earnings could have a strong impact on tech and affect Tesla - even if Tesla isn't much exposed to AI as the semiconductors.
To conclude, target is $390-$400 however as we all know, nothing is guaranteed :)
Note: Not financial advice. My analysis is not advice, rather just an idea. Please do your DD as well.

SPY/QQQ Plan Your Trade For 5-27-25 : Blank PatternToday's SPY Cycle Pattern is BLANK. This suggests the market will trend similarly to what we've seen over the past few days - likely melting upward.
A BLANK pattern is a price structure I have not identified as some type of price structure yet. I will check the data to see if I can find anything that correlates with this pattern throughout today.
Generally, we are rolling into a consolidation phase that may attempt to break higher or continue consolidating and roll downward.
Overall, the alignment with the Fibonacci trigger levels suggests the markets will continue to struggle near the ranges I've shown on my charts.
Gold and Silver are rolling downward - likely as a result of the EU tariff pause. That move to pause EU tariffs takes quite a bit of pressure off the metals markets.
I do believe the Gold/Silver will continue to try to rocket higher - but this week metals may stay somewhat flat and trend downward a bit.
BTCUSD is setting up a MASSIVE Excess Phase Peak pattern. This is a very big price rotation that could either INVALIDATE (upward) or CONFIRM (downward). If we get confirmation, BTCUSD could fall back below $75k very easily. If we get invalidation, the sky is the limit to the upside.
Ultimately, I believe the global markets need another 60-90+ days to settle with all the global trade/tariff and other issues before moving into a more bullish price trend.
We'll see if I'm right or not over the next 60-90+ days.
Get some.
#trading #research #investing #tradingalgos #tradingsignals #cycles #fibonacci #elliotwave #modelingsystems #stocks #bitcoin #btcusd #cryptos #spy #gold #nq #investing #trading #spytrading #spymarket #tradingmarket #stockmarket #silver

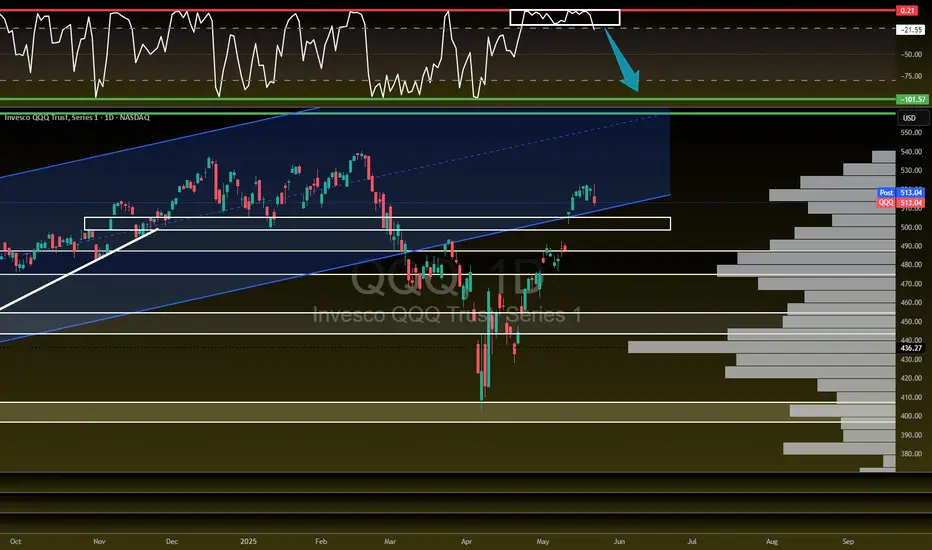
QQQ To Be DeterminedUsing the Potterbox strategy, we can see that we successfully bounced off the 4HR cost basis, or median at about $505.60 and closed above the top of the box at about $507.77.
I believe that to continue to the upside, we'll have to first secure the floor above at $511.50 with a 4 hour candle close. At that point, we'll have a chance to punchback with a candle close above cost basis at about $513.84. With that, we can look to head to the upside and use $522 as a price target.
On the other hand, if we drop below the top of the box that we closed above, we could retest cost basis at about $505.60 and if we get a candle close at that end, then we can look to continue downwards towards a $497 price target.

05-25-25 Risk Containment & Trading Strategy ExamplesSkilled Traders have learned to manage risk levels using techniques that allow them to preserve capital and move their assets towards future successful traders.
Some beginner traders get stuck trying to swing for the fences.
In this video, I try to share a common Fibonacci price/strategy technique where traders can attempt to limit risks while learning to identify efficient successful trade triggers.
Remember, taking a trade is the easy part. Protecting and growing your capital is much more difficult.
Please use the techniques in this video to learn how to protect and manage your capital.
Get some.
Happy Memorial Day.
#trading #research #investing #tradingalgos #tradingsignals #cycles #fibonacci #elliotwave #modelingsystems #stocks #bitcoin #btcusd #cryptos #spy #gold #nq #investing #trading #spytrading #spymarket #tradingmarket #stockmarket #silver

QQQ Trading Opportunity! BUY!
My dear friends,
QQQ looks like it will make a good move, and here are the details:
The market is trading on 509.27 pivot level.
Bias - Bullish
Technical Indicators: Supper Trend generates a clear long signal while Pivot Point HL is currently determining the overall Bullish trend of the market.
Goal - 514.96
About Used Indicators:
Pivot points are a great way to identify areas of support and resistance, but they work best when combined with other kinds of technical analysis
Disclosure: I am part of Trade Nation's Influencer program and receive a monthly fee for using their TradingView charts in my analysis.
———————————
WISH YOU ALL LUCK

#202521 - priceactiontds - weekly update - nasdaq futuresGood Day and I hope you are well.
comment: Not as bearish as I am on dax but I think market should not go above 21200 again and continue down. For that to happen, bears need to leave a strong bear gap somewhere. Gap down on Monday or Tuesday will likely do the trick. If the bull trend line holds and the current bear trend line breaks, There is the small possibility of another leg up but for now I can’t see that happening.
current market cycle: trading range
key levels for next week: 19000 - 21000
bull case: Bulls need to stop the selling and reverse to above 21000 fast or bears will push this much lower. If they manage to stay around 21000, more bears could doubt the strength of this selling but it’s a weak argument as of now. If bulls go only sideways around 21000 and close Monday above it, that would change a lot to the better for them. They have support from the daily 20ema until clearly broken.
Invalidation is below 20600.
bear case: Bears see a clear topping pattern with at least 3 decent tries of going above 21350 and now we have the strong selling on Friday with a total escalation of the trade war with the EU. Bears were given a gift and they need follow-through and leave a big gap that has to stay open, like the bulls did with the 3 current open gaps. Targets for the bears in order are the breakout retest 20277, 20000 and then the prior support around 19300/19400 which is around the 50% retracement.
Invalidation is above 21200.
short term: Neutral until we clearly have follow-through selling by the bears. I want to lean max bearish but need more confirmation.
medium-long term - Update from 2024-05-24: Will update this section more after the coming week but in general the thesis is as for dax. Down over the summer and sideways to up into year end. I don’t think the lows for this year are in.

Stock Market Forecast | TSLA NVDA AAPL AMZN META MSFT GOOGLStock Market Forecast | CME_MINI:NQ1! CME_MINI:ES1! SPY QQQ
Mag 7 Forecast | NASDAQ:TSLA NASDAQ:NVDA AAPL AMZN META MSFT GOOG

Apple losing $3Trillion clubNASDAQ:AAPL lost a fair amount of market share this week.
Coming under pressure from comments by Trump and tarrif news.
Apple seems to be a target for the president despite him answering a call on live TV today using an Iphone...kinda ironic.
Apple could easily chop in this 9% range before it makes a definitive move.
I lean more bullish since we're testing the lows of the trade range.
If Apple holds here it could be forming a right shoulder for a very bul,ish inverse head and shoulder pattern.

QQQ What Next? SELL!
My dear followers,
I analysed this chart on QQQ and concluded the following:
The market is trading on 521.53 pivot level.
Bias - Bearish
Technical Indicators: Both Super Trend & Pivot HL indicate a highly probable Bearish continuation.
Target - 492.15
Safe Stop Loss - 535.10
About Used Indicators:
A super-trend indicator is plotted on either above or below the closing price to signal a buy or sell. The indicator changes color, based on whether or not you should be buying. If the super-trend indicator moves below the closing price, the indicator turns green, and it signals an entry point or points to buy.
Disclosure: I am part of Trade Nation's Influencer program and receive a monthly fee for using their TradingView charts in my analysis.
———————————
WISH YOU ALL LUCK

XYZ breakout imminent? Block NYSE:XYZ looks like it's getting ready to breakout.
It was impressive to see this stock holding relative strength today as the markets were under pressure and selling off.
The OANDA:SPX500USD & NASDAQ:QQQ sold off and this stock closed green.
2 bullish patterns can be observed on the daily chart. A bull flag and and inverse head and shoulders.
The major indices broke key ranges to the downside and this stock has traded in a tight range.

SPY/QQQ Plan Your Trade EOD Update : Memorial Weekend RisksThis EOD update is to help you try to position for the risks associated with a further breakdown in price trends over the lone Memorial Day weekend.
I know this video will be posted late in the day - but I want you to learn how to hedge against risks and try to learn to take your profits when they are THERE.
This is a really quick video.
Stay safe this weekend and thank you to all our VETS for your service and sacrifices.
We honor you this weekend.
GET SOME.
#trading #research #investing #tradingalgos #tradingsignals #cycles #fibonacci #elliotwave #modelingsystems #stocks #bitcoin #btcusd #cryptos #spy #gold #nq #investing #trading #spytrading #spymarket #tradingmarket #stockmarket #silver

$DASH Ready to Breakout?NASDAQ:DASH looks like it is getting ready to break out. It is only $11 off, its 52-week high. Recent upgrades increased price targets to $235 and $240.
One could look at the chart pattern and say it is a complex reverse head and shoulders, and today’s bar found support right at the neckline. I have been in this name for about 2 weeks as it recovered the 50 DMA (red). I will be looking to add to my position if it can clearly break above the area of resistance at the horizontal line, around $207.
This is a trade I am already in, and it is my idea. If you like the thought, please make it your trade that fits your trading plan.

$KTOS Looks Ready to Breakout!NASDAQ:KTOS is a small cap stock with the potential for big gains. They are in the Defense and Security sector and could benefit from U.S. military spending. It is also very liquid with over a million shares traded daily.
This stock is sitting near all-time highs here and looks like it is ready to break out. But it could be a double top as well.
I have been in this trade for a few days and added yesterday when it looked to me to reverse the down day. It needs to clear $36.85 - $37.00 to be a clear breakout. Over that level everyone is in the money.
This is my idea and my trade. If you like the idea, please make it your own and honor your trading rules.

$QQQ Needs this pullback to happen!NASDAQ:QQQ a healthy pullback to fill the GAP and retest the 100/200DMA here going into next week.
A break through these MA's would be very bearish.

$QQQ to $538 then one more leg down?Despite the bearish move in QQQ today, I still think there's another move higher.
I think it's likely that we go and retest the ATHs at $538 (so another 5% or so up) and then we find resistance there and start one last move down to $318-$383.
Only after we see another leg down, do we see new highs. Marked off support levels to the downside.
Invalidation of the idea would be flipping $538 as support.

SPY/QQQ Plan Your Trade for 5-23 : Carryover PatternLooking at the charts today, I want to say that it certainly looks like the SPY Cycle Patterns are blending into a consolidated CRUSH/BOTTOM pattern (see the weekend patterns) today and possibly "carrying over" into the early trading next week.
I have been warning of a pending rollover/breakdown in this uptrend for weeks. Today's breakdown seems a bit aggressive, but it is what it is.
If the patterns are consolidating/blending into a bigger breakdown over the Memorial Day weekend, then we could be looking at a very big downward/rotational move in the SPY/QQQ/Bitcoin over the next 5+ trading days while Gold/Silver continue to rally.
Silver is lagging Gold right now, but I don't think that lasts. Once Gold gets back above $3400, I believe Silver will start to make a big move higher.
The big question in my mind is - how does this carry into Monday's holiday trading schedule and into Tuesday's OPEN?
I'll have to see how things play out today - but it certainly looks like I'll be adding some SPREADS to potentially catch any big move over this weekend.
GET SOME.
This could play out exceptionally well for skilled traders.
#trading #research #investing #tradingalgos #tradingsignals #cycles #fibonacci #elliotwave #modelingsystems #stocks #bitcoin #btcusd #cryptos #spy #gold #nq #investing #trading #spytrading #spymarket #tradingmarket #stockmarket #silver

Tesla (TSLA): Daily uptrend support and potential bull flagHey guys/gals,
Today, I am showing you the daily chart of Tesla ( NASDAQ:TSLA ), which provides an idea of where this stock may be heading next.
As you can see, the support trendline from the 21st April low is still well intact. Currently, Tesla is holding this line very well and over the past few days, it's clear that it has also been in consolidation mode. Taking a deeper look, the consolidation period seems to be forming a potential bull flag pattern. Minus the upper wick which could be a price anomaly due to a fake-out, a real actual breakout from the bull flag in combination with a bounce from the support trendline could help Tesla reach $365 as the next resistance point.
On the contrary, and it does depend strongly on what the broader market does next (as Tesla is a high beta stock), its flag pattern may not play out and a break below the support line could send the stock all the way to first support at £325.
This wholly depends on the wider market. On my other posts, I've made it clear that S&P 500 AMEX:SPY is also forming a flag pattern, with many other indices following suit.
Note: Not financial advice.

$YOU – Wedging with Confluence of MA’s & AVWAPNYSE:YOU is a name I have “thought” could move higher. It is the Clear System at select airports. They continue to expand to other busy airports, and it is an IPO from 2021, so it has had time to squeeze out pure speculation.
To be sure this type of wedging pattern can resolve either way. It is more of a consolidation type pattern. I like the fact that it is above the shorter-term Moving Averages but is stuck just below the All Time High AVWAP and the 50 DMA which also coincides with the upper downtrend line (DTL) of the wedging pattern.
For me to take a trade it either needs to move up through the AVWAP, the 50 DMA and the DTL, in which case I will go long with a stop under the most recent higher low. If it breaks down, I will consider a short trade.
If you like this idea, make it your own and make sure it fits with your trading plan.

SPY/QQQ Plan Your Trade For 5-22 : Inside Breakaway CountertrendToday's Inside Breakaway in Countertrend mode suggests the markets may attempt to move downward - away from the recent highs.
I believe the SPY/QQQ will move into a sideways/consolidation range over the next 3-5+ trading days before attempting to make any big moves. We have a holiday-shortened trading week next week, and I believe the markets are moving into the Summer doldrums.
Overall, I would ask traders to stay cautious of this transition in the markets over the next 5--10+ days and prepare for volatility to increase after June 1st.
You all know what I believe is the most likely outcome - a rollover topping pattern followed by a breakdown in price targeting the 525-535 level on the SPY. We'll see what happens going forward.
Gold and Silver pullback back overnight which suggests the metals markets were a bit overheated to the upside. I still believe Metals will continue to push higher.
BTCUSD is trading up above $111k. Here we go.
BTCUSD is moving up into the potential rejection level that I suggested in my 5-20 video as a MASSIVE WARNING setup.
This is where we'll see how BTCUSD plays out - if we continue to push higher or if we REJECT and move into a broad downtrend.
I didn't expect it to happen only TWO DAYS after my video - but here we are.
Time to get muddy and play what price puts in front of us.
Get some.
#trading #research #investing #tradingalgos #tradingsignals #cycles #fibonacci #elliotwave #modelingsystems #stocks #bitcoin #btcusd #cryptos #spy #gold #nq #investing #trading #spytrading #spymarket #tradingmarket #stockmarket #silver

TSLA PRICE ACTION 21st MAY 2025This is the updated price action of Tesla. I have clearly discussed the new buying levels & have also discussed why I sold it.
If you have any questions, feel free to leave a comment or DM me.
NOTE: AVOID OPTIONS IN TESLA

Going short on the Nasdaq 100CAPITALCOM:US100
The Nasdaq 100 has moved up impulsively on a 5-wave move over the past 6 weeks, which is very bullish long term. However, in the short term, it is overextended, with the RSI indicator over the 70 level.
I expect it to decline over the next couple of weeks to the area marked in the green rectangle, between the 50% and the 78.6% Fibonacci Retracement level.
I hope you find this interesting.
Good luck to you

QQQ about to FLUSH?! Let's talk about it!I'm not saying it's over but you have to admit it does feel like we are going to see a decent size pullback...2-6% over the next few weeks on the NASDAQ:QQQ AMEX:SPY
- TVC:VIX back over 20
- US20Y hit 52 week high
- USDJPY starting to creep towards April lows
- $491.54 GAP to fill on NASDAQ:QQQ
- $447.58 Bigger GAP to fill on NASDAQ:QQQ
- Credit starting to become and issue
- Banks/ Credit companies tanked today
There is bullish pieces as well but we do look extended here and a healthy 2-6% would be welcomed...A break of $475 level spells trouble on QQQ.