QQQ: MAX PAIN!Q's looking weak going into this week and max pain presenting itself. Ideally would like to create a higher low on the macro level to find a generational buy and bounce back to last weeks highs. Traders gonna trade and levels are in the video! Good Luck!
Qqqlong

2022 | The Year Of Wild Swings but a BIG Payoff? QQQ/SPYHey Everyone, in this video we discuss the large swings we expect for 2022 and what might be setting up for the next few quarters on the stock market.

QQQ: Major Levels and Money to Be Made This Week!QQQ is looking like a nice range is developing with pretty clear levels. These levels will help you if you choose to use them. We know we will!

QQQ: Fade every rally until further notice IMOLooking to Fade 361/364 as its the bearish retest going into tomorrow. We will see where QQQ opens up, and if we can get that high to try a fade.

How low will QQQ go?Having broken below the 200 day Moving Average for the first time since March 11th, 2020, after the the COVID outbreak news, the next real support for the QQQ us at the Daily Demand level between $350 and $352. I am expecting it to test that level before the FOMC meeting concludes on Wednesday, Jan 26th and then, hopefully if the Fed Report is not terrible in terms of interest rate hikes, then we can expect a rally up to the $388 to $390 level by the end of next week, January 28th.

$SPY / $QQQ / $ES1! to correct soonIn lieu of causing max pain, it seems the controllers of the market have decided to stick another major knife into retailers the past few weeks.
Looking for a reversal in the short term.
Bull PT: 476 short term
Bear PT: We have another 5-10% drop (highly unlikely)

Bullish Bat harmonic on QQQI'm new to harmonics so posting this more for my research to see if it plays out. It meets the rules to be a bat if it hits the PCZ which also would be the 50MA on the weekly with hidden bullish div on MacD. Idk, I think this has a high probability of playing out boys. Lmk what you think down below please!

SKEW Indicator and NASDAQ - point of reversal interest?SKEW is probably a little less known in the world of volatility than for example the VIX, but essentially it is a measure of the implied volatility of OUT of the money options, as opposed to AT the money options on the market like the VIX.
I suppose it may be a better comparison to check SKEW vs the SPY, but I'm a NASDAQ guy so I wanted to have a look at this in particular.
Basically the lower the SKEW is, the lower the market's expectation that the market price will move MORE than 2 standard deviations from the current price.
It's difficult to ever draw perfect correlations or conclusions, however, it does seem that once the SKEW "looks like" and this is more of an opinion of how you think the chart of the SKEW looks, but when the SKEW looks like it's made at least an interim bottom and is reversing upwards, this seems to correlate with the market/NASDAQ getting at least an interim reversal. (some instances indicated by the vertical green lines)
Difficult to put into text this kind of idea, but kind of consider, if the SKEW is a measurement of the market's expectation to get a move from current price more than 2 standard deviations in the next month, then once the SKEW "bottoms out", it means that the market isn't really expecting a big move to happen in the next 30 days (this includes bearish and bullish moves btw); but when SKEW looks like it's made an interim bottom, and looks like its starting to creep back upwards, this is the point at which market sentiment is starting to shift slowly, showing as the SKEW moves back up that there is more and more expectation of a move in price more than 2 standard deviations from the current market price.
It's at this point (the point of looking like a reversal off of an interim bottom in the SKEW) that I think could correlate to at least interim bottoms in the market; because we're precisely at the point at which SKEW shows us the market doesn't think we're about to get a big bearish OR bullish movement in price; and the fact we're at the point which it's just starting to creep upward again; shows us that the market is expecting SOME movement in price; but if it were going to be a sharp correction of some kind you would see the SKEW at a much higher level already, not just reversing off of what looks like a bottom.
Again, correlation maybe, opinion maybe, trying to get a sense of how something like the SKEW communicates what the market itself is thinking.
Food for thought.

QQQ: Look in the Boxes QQQ I'm looking for a trade to go long in the green box or short in the red. Watch tech for a bounce and see if it takes SPX up with it even though banks may be a bummer.
NQ equivalent is 15500. Above look to long, below look to short.

First attempt at a QQQ chart NQ moves very sporadically in my opinion but I believe we are past all the news to destroy tech stocks until the fed speaks again about tapering. I believe also institutions are trying to make us leave our technical so we enter shorts.

QQQ: ATH or bustQQQ daily close over 398.71 sets up a run back to ATH and should lead a breakout in SPY. Would think since we are tapping upper supply a day pullback is in order to reset some chartist's indicators. 4 days in a row green. My thoughts are we end back at ATH then make a decision from there. Would create a double top looking idea if it doesn't have a daily close above 408.67 this week.

we did buy some $QQQ vs todays lowwe like the 2b setup in QQQ we did get our intraday long signal from day trading algo, lets see if this low can hold

QQQ: Get through 401.19QQQ has a lot of supply until 401.19. Daily close or confirmation above can run it back to ATH quick. Might be choppy around 400, but could be a good same day lotto if over 400 for a tag to 401.19.
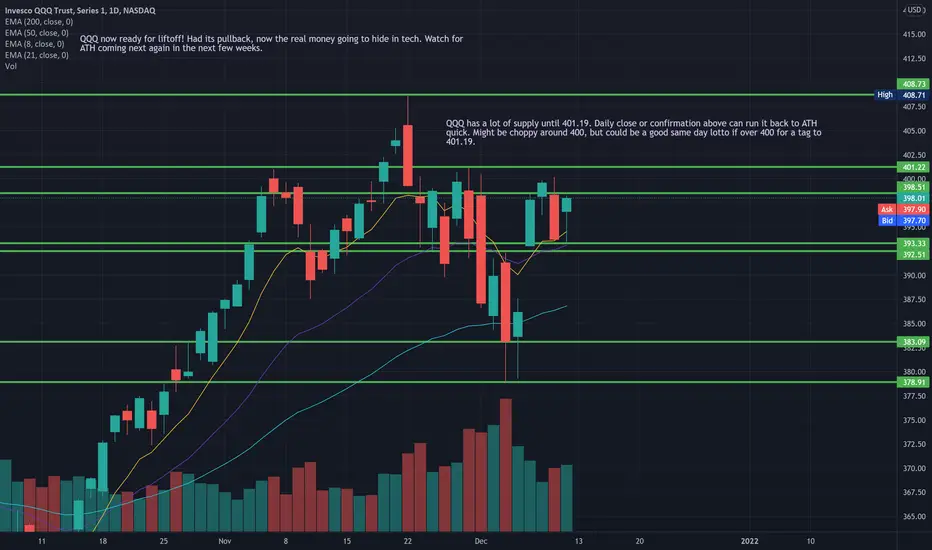
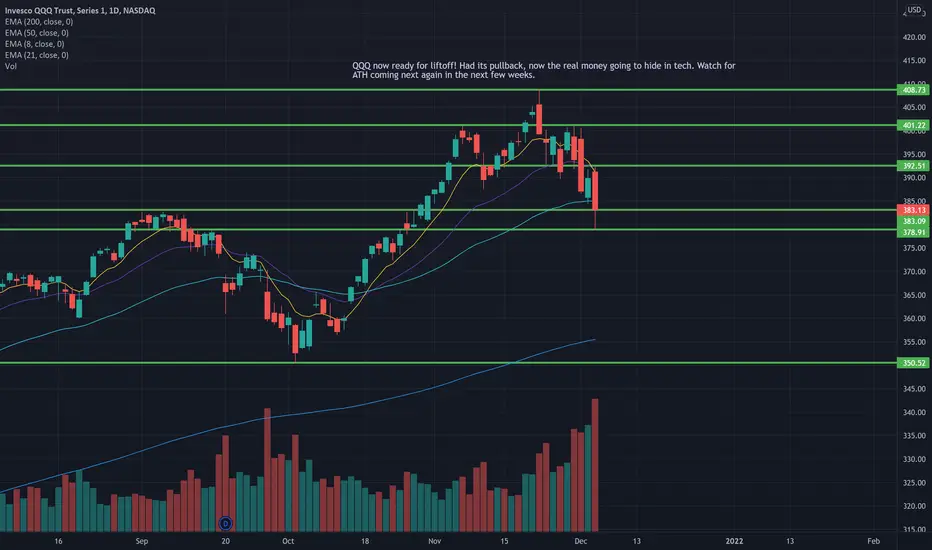
QQQ: Stay above Friday's low and we have liftoffQQQ now ready for liftoff! Had its pullback, now the real money going to hide in tech. Watch for ATH coming next again in the next few weeks.
QQQ Thoughts about a big price dropThese are my thoughts for QQQ
In yellow is the structure that is common in two places
In green is the extension from that structure
Both are very similar in length (time wise)
Using this we can apply it to the second "structure"
If we apply a big price drop (bars pattern) it shows a large wedge structure with three bottoms along the wedge.
Short / medium term this would be very Bearish. However, long term a formation like this is setting up price for big times.
The ultimate entry point if this plays out is along the bottom of the wedge (dotted line)

NASADQ US100 We are still in an uptrend but for the day the steam will lower to the entry point to fetch some orders from the LONDON OFF session then we rise.


$QQQInvesco QQQ is an exchange-traded fund that tracks the Nasdaq-100 Index™.
The Index includes the 100 largest non-financial companies listed on the Nasdaq based on market cap.
The Invesco QQQ Trust has been delivering superior returns for several years, easily outperforming SPY and other S&P 500 funds.
QQQ has been rising high for so long that it's only natural to wonder if it's due for a correction. Unless you count the very brief correction of 2020, tech stocks have been in a raging bull market for over a decade. QQQ - which tracks the NASDAQ-100 - has been a main beneficiary of that trend.
According to Invesco, the average bull market lasts 4.83 years.
QQQ has been mostly rising for more than twice that time.
History would tend to suggest that it's in for a possible correction.
So, lets take a look at the technicals.
QQQ is currently sitting in a upwards channel which ended up bouncing off support on the daily.
It’s a good idea to keep your eyes on this chart especially if price ends up breaking support or resistance which can give you a good idea of where the future will lie.
RSI recently out of oversold territory
MACD curling w/ a expectation of a continuation up.
Watchlist this.


LONG $QQQ to start Q4im liking this candle flushing out and reclaiming 100ema and looking strong into the close

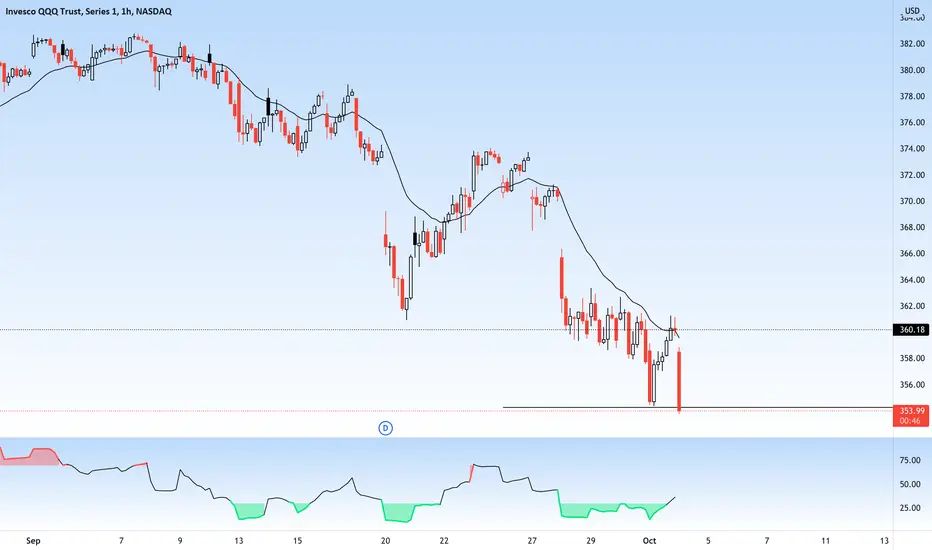
QQQ testing the $360 final support levelAs I had mentioned 8 days back on September 20th, QQQ closed almost exactly at $360 today (see the related post ). This is a very important level for the bulls to defend as it is the last level of long-term support for the QQQ based on the trend lines I have been tracking. A close of this week on Friday, October 1st below this lower support line could mean a larger and more extrapolated pullback to come in the weeks following.
However, based on my technical analysis, I see this market as over-sold and a short-term recovery is expected by the end of this week. In other words, I expect the QQQ will close above this $360 level by the end of this week.

risk back on in $qqq for q4 rallysee chart, I will always follow my sell rules and take risk off if we close below a previous day low and be on toes to re enter if reclaim these levels
