Qtum Long Opportunity !Watchout the Qtum chart !!!
I think it will give an upward confirmation and breakout. Just look at the Volume ;)
If breakout is approved, you can enter as setup, it can touch $ 3 to $ 5 in the long term.
QTUMUSD

XLM On Fire !! 🔥Stellar Pumped to 20 Cent :)
15 % Profit ✅🔥
Was the analysis useful? Tell us your opinion .

QTUMUSDT - Weekly analysis QTUMUSDT is printing the inverse head and shoulders reversal pattern on the weekly timeframe.
RSI is printing a bullish divergence signal.
Bullish ⬆️ - breakout above the inverse head and shoulders neckline resistance.
Target 🎯 - resistance levels.


QTUMUSD Buy ideaQTUMUSD is in a downtrend but recent rejection on support trendline suggest that the pair could potentially go up.
Disclaimer -Disclaimer -Trading foreign exchange on margin carries a high level of risk, and may not be suitable for all investors. Past performance is not indicative of future results. The high degree of leverage can work against you as well as for you. Before deciding to invest in foreign exchange you should carefully consider your investment objectives, level of experience, and risk appetite. The possibility exists that you could sustain a loss of some or all of your initial investment and therefore you should not invest money that you cannot afford to lose. You should be aware of all the risks associated with foreign exchange trading, and seek advice from an independent financial advisor if you have any doubts.

QTUMUSDT - Descending triangleQTUMUSDT is printing a descending triangle pattern.
Price is testing the pattern support.
Possible price actions are indicated on the chart.

Qtum / Usdt - Fib Retracement DShort in short term
long at 1.555 for long term according to fib retracement


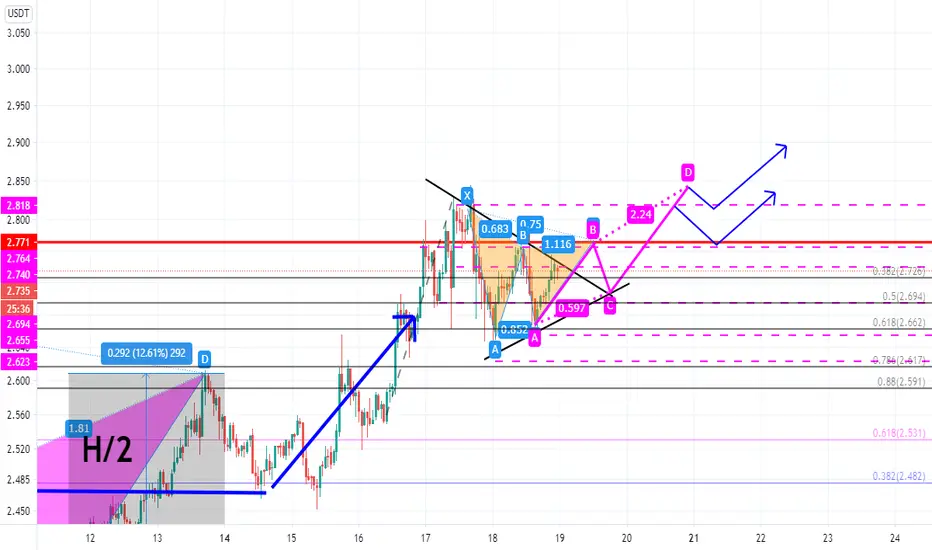
✳️Qtum/USDT (12/11) View + Trading Plan #QTUM $QTUMQTUM has conquered the 2$ zone and made it becom a strong support zone for QTUM.
QTUM is heading to 2.6$ zone and 3.5$ zone
The risk only occurs when the QTUM falls out of the 2$ zone, but the probability is not high.
📈BUY- LONG
-Buy: 2-2.1$, stoploss if B
📉SELL-SHORT
-Sell: 2.6-2.7$, stoploss if A
-Sell: 3.4-3.5$, stoploss if A
♻️BACK-UP
-Sell close to 2-2.1$ if B, stoploss if A
-Buy: 1.6-1.7$, stoploss if B
❓Details:
Condition A : "If 1D candle closes ABOVE this zone"
Condition B : "If 1D candle closes BELOW this zone"

Qtum Breakout Setupprice close above trend line also following the EMA's perfectly
Buy : 1320 - 1330
Stop : 6%
Target : 1420 , 1500 , 1600
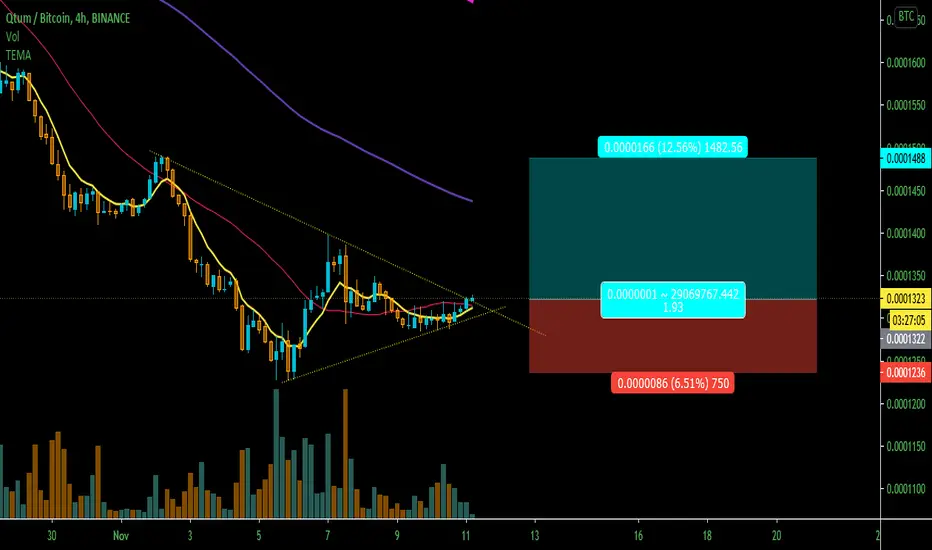
QTUM/BTC 166% Potential From here with Tight Stop Loss#QTUM/BTC TA Update:-
#QTUM currently trading at 1300 Satoshi level.
I am buying here around 1300 Satoshi.
Why ..?
According to Chart I drawn chart so looks bullish.
I personally can expect bounce from here.
Small stop loss with high rewards.
Entry:- 1250-1320 Satoshi
Targets:- 1983/2523/3437 Satoshi
Stop Loss:- 1220 Satoshi
Please Click LIKE button and Appreciate my hard work.
Must follow me for latest crypto real time updates.
Thank you.


QTUM Descending Triangle *** Stops need to be re-adjusted and R:R reassessed at point of entry. As a guide, I usually count 6-8 candles back from my entry point on the timeframe I’m trading on and place my stop just below the lowest wick within those 8 candles in the case of a short, or above the highest wick of the last 8 candles in the case of the long. If this rule means your R:R to target one is not good, don’t take the trade. ***
QTUM
Probable
- Long term descending triangle on daily - bearish pattern
- EMA’s bearish on daily, 12hr & 4hr
- Looking for BCR of yellow box zone
- 2 short targets
Possible
- Look to see if we create a HL within the triangle for a heads up trend may change
- Wait for EMA’s to turn up and cross bullish
- Wait for break out of the long term down trend line
- Wait for retest of the new support
- 2 long targets

QTUM USDT | 1D chart | Long Position | Possible 50% gainBINANCE:QTUMUSDT
Entry Price: 2.120
Take profit: 3.179
Possible gain: 50%
What do you think about this strategy, share your comments below;
Make sure to subscribe!
If you enjoyed this Idea hit the Like button and support us!

QTUM/BTC (Testing Key Level of Support)💎Technical Analysis Summary💎
BINANCE: QTUMBTC
-QTUM is now testing the key level of support
-This area is a confluence of previous resistance and support
-If QTUM can break above the trendline resistance
-It will give us a strong bias that the downtrend is over
-And we can see a potential test up to 2800s sat
``````````````````````````````````````````````
Trading Involves High Risk
Not Financial Advice
Please Exercise Risk Management
``````````````````````````````````````````````
If You Like My Daily Published Ideas
A little Help By Supporting My Channel
Through Leaving A Thumbs Up, Comment & Follow
Happy Trading! --> Thank You! :)
``````````````````````````````````````````````

QTUM/BTC - ATS SCALP BACKTESTScript settings for 4H timeframe:
· Signal calculation type - "open"
-TP for Long - 4%
-SL for Long - none
-TP for Short - 5%
-SL for Short - none


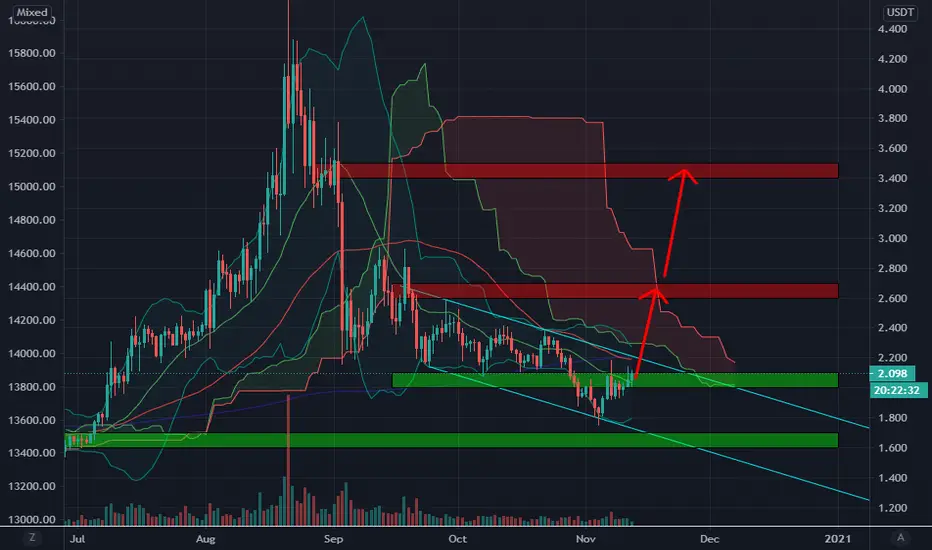
#QTUM BTC UPDATE> QTUM Making Double Bottom Form
> QTUM Making ' W ' Chart Pattern
> QTUM If Day Candle Will Close Above 2600 Then You Can See Positive move very Soon
````````````````````````````
Trading Involves High Risk
Not Financial Advice
Please Exercise Risk Management
````````````````````````````
If You Like My Daily Published Ideas
A little Help By Supporting My Channel
Through Leaving A Thumbs Up, Comment & Follow
Happy Trading! --> Thank You! :)
````````````````````````````

QTUMBTC best time to buy is right hereNow is time to setup buy orders on QTUM ... very nice project
We want to see soon 6 - 10 $ price
Very nice setup is about to arrive
Purple line is EMA 200
Enjoy!!!

QTUM LongLemme try this one boi,
Was looking on CT and saw this coin,
Dont forget i dont make any profit with my tradings
