QTUMUSDTPERPQTUM is in a ranging area and shows the signals of being bullish again and when it reaches its last high 2 things can happen which is go for higher values or make a A&E pattern
Qtumusdt


QTUMUSDT______qtumusdt way in daily timeframe...(green arrow)
we must ensuring that daily candle break with strenght resistance line

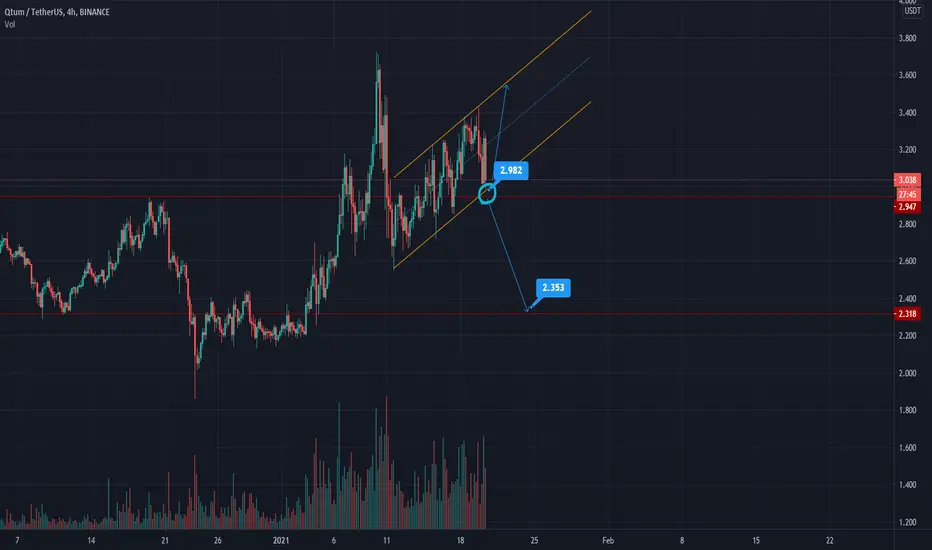
#19 - QTUM/USDTTrade opened today @3.30.
5 previous closed cryptotrades :
#12 : ZEC/USDT : 1st half position return : + 12.11 %.
2nd half position return : +0.12 %.
#13 : IOTA/USDT : 1st half position return : + 28.74 %.
2nd half position return : + 5.43 %.
#14 : GVT/BTC : 1st half position return : + 25.4 %.
2nd half position return : flat.
#16 : TRX/USDT : Position return : flat.
#18 : ATOM/USDT : Position return : - 14.62 %.
Don’t forget to follow the idea if you want to get updates.
If you win on the markets by following this idea, let me know it by commenting.


Qtum Price At Resistance S/R FlipQtum Price at the resistance breakout above the resistance will send price higher.
watch this level closely and wait for price to make breakout above the resistance
flip of the resistance will send price higher


QTUMUSDT - Inverse head and shoulders trend reversal pattern 🔼Analysis 🔎: QTUMUSDT is printing the inverse head and shoulders trend reversal pattern on the weekly timeframe. This is a bullish pattern.
RSI is printing a bullish divergence signal.
Potential breakout.
Buy entry ⬆️ - breakout above the inverse head and shoulders neckline resistance.
Targets 🎯 - horizontal resistance levels.
Setup invalidation ❌ - breakdown below the right shoulder support level.

QTUMUSDTlet QTUM hit 2.83 and then you can enter with high scalp for long terms and tons of profit
this sentence is confirmed IF the BTC dominance stays at this range or become lower to 65% (which is even better)
where can you check the btc dominance? coin360.com


Qtum Weekly Technical AnalysisDear Traders
A descending trendline has been broken, one can buy long or invest in this pair once the weekly breakout zone and conquered and retested!
Our targets are shown by blue levels.
#StayRoyal #StayProfitable
Happy Trading.

Oh QTUM analysis more than 40% profit in 5 days😉Well, my friends, this is from qtum analysis, which reached its two targets and got very close to its third target. I put qtum analysis in 5JAN. If you want to use the analysis I do, be sure to follow me


QTUMUSDT CREATE HEAD & SHOLDERSMother currency bitcoin weekly time frame RSI almost 96! in 4 h create strong bearish divergence, so BTC will correction. & Alt also, QTUM create weekly head & shoulder.

QTUM : BUY TradeQTUM is looking very good ...from so many days its in strong accumulation zone . also gave very niece rectangle breakout.


Qtum Long Opportunity !Watchout the Qtum chart !!!
I think it will give an upward confirmation and breakout. Just look at the Volume ;)
If breakout is approved, you can enter as setup, it can touch $ 3 to $ 5 in the long term.

XLM On Fire !! 🔥Stellar Pumped to 20 Cent :)
15 % Profit ✅🔥
Was the analysis useful? Tell us your opinion .

Qtum/usdtEverything is clear in the picture ...
You friends must be patient and make smart purchases ...
Good friends ... ✌✌
Please like and comment ♥️✏

QTUMUSDT - Weekly analysis QTUMUSDT is printing the inverse head and shoulders reversal pattern on the weekly timeframe.
RSI is printing a bullish divergence signal.
Bullish ⬆️ - breakout above the inverse head and shoulders neckline resistance.
Target 🎯 - resistance levels.
