SPX UPTREND ALL TIMEFRAMES BULLISH. TARGETS 3588The SPX has resumed its UPTREND on ALL timeframes.
Target 3585.
Short term support at 3428.
The SPX must trade above the SSSA line on the day charts to maintain uptrend.
A break below 3428 will test 3378.
Quantstrategic

STI BUY SIGNAL 091020 TARGETS 2547The STI has generated a buy signal at 2520 on 091020.
Immediate target is 2547.
A close above 2547 and hold will generate a ST/MT uptrend towards 2717
Failure to break above 2547 will retest 2510 and resume its MT/LT downtrend.
The STI is in a persistent MT/LT downtrend till otherwise indicated.

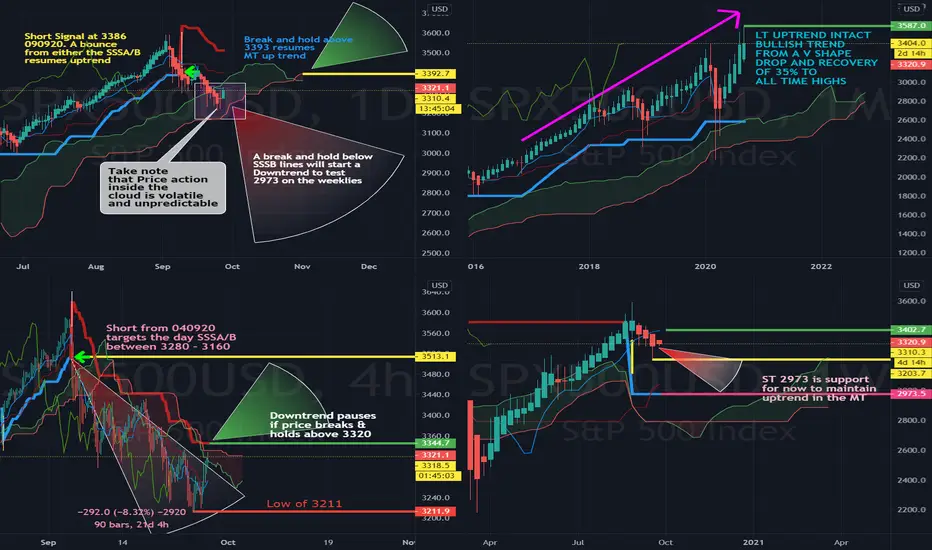
US SPX relieves selling pressure above 3345Short term buy signal issued on 280920.
A close above 3393 resumes the uptrend on all time frames.
Support is at 3288. A close below 3288 will retest the lows of 3211.

STI downtrend intact. Tries to stay above 2500. 031020.The STI has tried multiple times to hold the 2500 level in the last trading week.
A break and hold above 2510 will relieve the selling pressure.
A range within the downtrend has develop between 2450 and 2510 in the ST
A test of 2450 is still imminent.

STI Venture V03 pivot at $19.54 for uptrend to continueVenture had resumed its uptrend with a sharp parabolic ascent to $29.50 from Aug 2016 to Mar 2018.
Pivot : $19.54
Buy on a break and close above $19.54
Target $29.50
Stop Loss : $18.92

STI Wilmar F34 seeks $4.54 to resume uptrendWilmar resumed its uptrend LT in July 2019.
Multiple buy signals MT and ST were issued on 270720 and 250920 @$4.41-$4.46
PIVOT : $4.54
Buy at the break and hold above $4.54
Target ATH of $7.29
Stop Loss $4.36
A break of $4.36 will negate the ST buy signal and test $4.04

Mapletree Ind Trust ME8U watch $3.19The uptrend of ME8U is impressive since 2011.
Price is expected to trade between $3.04 and $3.34 in the ST
A break upside of $3.34 will resume its uptrend.
Pivot : $3.19
A break of $3.19 will lead to ST weakness to to test $3.04
A break of $3.04 will see a MT correction to $2.17

STI downtrend struggles to break above 2500The STI is into its downtrend for 15th weeks now since the 24th of July 2020.
2500 level needs to be reclaimed and a close above 2520 will negate the correction.
The downside target of 2200 in the MT/LT remains a viable target if a sustained recovery above 2520 and 2551 fails to materialize.

SPX pivot at 3344 to pause Correction The SPX attempts to make a break above 3344 to pause the recent 10% correction from its recent highs of 3591 early Sep.
A close above 3344 on the 4hr charts will confirm the end of the correction and may test 3392 to resume the uptrend in the M/L term timeframes
Alternative, a sustained close below 3344 will retest the lows of 3211.