Quantum Race: Who Will Become the “NVIDIA” of the Quantum Era?Quantum Computing Race: Who Will Become the “NVIDIA” of the Quantum Era?
As the quantum computing sector accelerates, companies like D-Wave Systems, Rigetti Computing, Quantum Computing Inc. (QUBT), and IonQ are emerging as key players—each competing to become the dominant force in what could be the next trillion-dollar tech frontier. The comparison to NVIDIA in the AI and GPU revolution is no longer far-fetched, as these firms race to define the future of computing.
Despite their different technological paths—D-Wave with quantum annealing, Rigetti with superconducting qubits, IonQ with trapped-ion systems, and QUBT with hybrid quantum-classical platforms—these companies are now tightly interlinked in market perception. A strong earnings report, product milestone, or government contract from one often fuels sector-wide hype, lifting stock prices and investor sentiment across the board.
This mutual influence is driven by the belief that success by one player helps validate the entire industry. In that sense, these firms are collaborative competitors, pushing the space forward while fighting for leadership. Quantum computing is still in a developmental phase, but the potential is massive—targeting breakthroughs in AI, cybersecurity, materials science, finance, and more.
With analysts forecasting the global quantum computing market to exceed $1 trillion by 2035, the question is no longer if the sector will explode, but who will lead it.
For now, no clear winner has emerged, but momentum is building. And in this space, a breakthrough by one can ignite a rally for all—making the quantum sector one of the most exciting and interconnected areas in tech today.
Quantumpatterns

Rigetti's Quantum Leap: Can RGTI Ride the Hype to $100?Rigetti Computing Inc. (RGTI) is a notable company in the quantum computing space, focused on developing superconducting qubit systems. As of late May 2025, the stock is trading around $14.19, marking a sharp rise from its earlier levels this year.
The stock has rallied more than 1,200% over the past six months, pushing RGTI toward the upper boundary of its current ascending channel. The $15.00–$15.50 range is acting as a psychological resistance area. After such a strong move, a technical pullback toward the $12.50 zone would be considered healthy, potentially allowing the stock to reset while remaining within its bullish structure. If $12.50 fails to hold, the next notable support sits near $7.59, a previous area of accumulation.
Rigetti’s growth outlook is supported by several key drivers:
Technological Innovation: The company is on track to roll out more advanced quantum systems, including a 36-qubit system by mid-2025 and a 100+ qubit system by year-end. These advances are built on its modular chip architecture, aimed at scaling performance.
Strategic Collaborations: Rigetti has been expanding its reach by partnering with leading cloud platforms, making its quantum systems more widely accessible and integrated with broader tech ecosystems.
Government Support: The company is also involved in government-backed quantum initiatives, strengthening its credibility and positioning in the national quantum strategy.
As the global quantum computing market continues to gain momentum, Rigetti is well-positioned to benefit. If the bullish trend persists, some forecasts suggest the stock could potentially reach the $100 level by the end of 2026.
Traders and investors should watch key levels: $12.50 and $7.59 on the downside as support, and $15.50 as the immediate resistance to confirm momentum or identify pullback opportunities.

Rigetti Computing (RGTI): Potential Buying OpportunityRigetti fails to hold the $9.80 support, it could continue its decline toward the $5.50 zone.
Till then we can see:
Rigetti Computing (RGTI) is at a pivotal moment, currently trading around $8.90 after a 56% drop from its $16 peak to a recent low of $7. The stock failed to hold the critical $9.80 support level, raising concerns about further downside pressure. However, this decline also presents a short-term buying opportunity before the next major move.
Short-Term Buying Scenario
If buying momentum picks up from $8.90, we could see a rebound toward $12–$13.
This level is a key resistance zone, and failing to break above $13 will confirm that the downtrend remains intact.
Bearish Breakdown Possibility
If RGTI struggles to hold $9.80 and fails to sustain the $12–$13 recovery, it would signal continued weakness.
This could trigger a further drop toward $5.50, and in a worst-case scenario, it could even reach $5.
Key Levels to Watch
$9.80 Support (Broken) → Previously a strong support, now acting as resistance.
$12–$13 Resistance → If RGTI fails here, it confirms further downside potential.
$5.50–$5.00 Support Zone → The next major target if bearish momentum continues.
Conclusion: Decision Point for RGTI
Rigetti Computing is at a critical turning point. A rebound from $8.90 toward $12–$13 is possible, but failure to break above this range will likely confirm the bearish trendline. If that happens, we could see another major drop to $5.50 or even $5. Investors should watch how the stock behaves around $12–$13, as this will determine the next big move.

Atos Reverse Stock Split – Another Round of Price Manipulation?Atos Confirms Bullish Continuation, Invalidating Consolidation and Bearish Retest
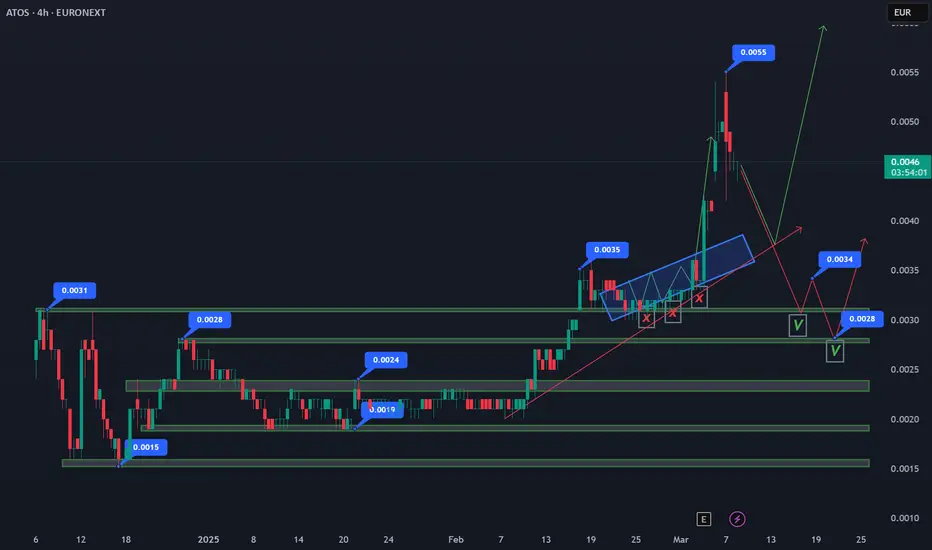
Atos has officially invalidated neutral consolidation and a bearish retest, choosing a bullish continuation as it currently trades at $0.0046.
Atos Needs a Pullback to $0.0028–$0.0034 After 84% Surge
Following a massive 84% rally from $0.0030 to $0.0055, Atos now requires a technical pullback to retest and confirm support.
Target Pullback Zone: $0.0028–$0.0034
A retracement into this range would provide a healthy consolidation, allowing bulls to regroup before another breakout.
Holding this zone would strengthen the bullish structure, preventing excessive volatility and reinforcing confidence in further upside.
If $0.0028 holds, the next bullish wave could see Atos push beyond $0.0055 and target new highs.
This pullback phase is crucial for maintaining trend stability and ensuring Atos builds a strong foundation for the next bullish leg. If buyers defend $0.0028–$0.0034, the stock could be positioned for another sharp upward move.
Atos SE Reverse Stock Split Analysis – March 2025
Atos SE has announced a reverse stock split at a 10,000-to-1 ratio, aiming to reduce the number of outstanding shares and stabilize stock price volatility. This move follows prior capital increases and a drastic decline in share value.
Key Impacts of the Reverse Split:
Structural Change, Not Value Addition:
The total market capitalization and shareholders' equity remain unchanged.
For example, a holder of 30,000 shares at €0.0049 each will receive 3 shares at €49 each, maintaining a €147 portfolio value.
Market Sentiment & Perception:
Large-scale reverse splits are often perceived negatively, as they may signal distress.
Atos must demonstrate financial stability and growth potential to prevent further investor sell-offs.
Liquidity & Trading Adjustments:
Shareholders with fractional holdings (<10,000 shares) will need to adjust positions before April 23, 2025, or risk forced liquidation.
The new shares will start trading under a new ISIN code (FR001400X2S4) from April 24, 2025.
Potential Post-Split Volatility:
If investor confidence remains weak, the stock could face renewed selling pressure despite the higher nominal share price.
However, if Atos improves its fundamentals and strategic outlook, the split could help attract institutional investors who prefer stocks with higher unit prices.
Final Take:
While the reverse split does not inherently add value, it aims to enhance trading conditions and market perception. The real impact depends on Atos' ability to execute a successful turnaround strategy beyond the technical stock adjustment.
Atos Reverse Stock Split – Another Round of Price Manipulation?
Atos SE has once again announced a massive reverse stock split (10,000-to-1), following a sharp decline in share value. While this move is framed as an effort to reduce volatility and stabilize trading conditions, history suggests a pattern of price manipulation that leaves retail investors at a loss.
A Look Back – The 2024 Split Manipulation
The last time Atos conducted a share split (13,497 new shares for every 24 old shares), the price artificially pumped from €0.15 to €1.70 right before the official announcement. This created a false sense of demand, trapping investors at high prices, only for the stock to collapse afterward. Many retail traders ended up buying high and losing money.
Current Manipulation – Selling Off Before the Split
Now, we see a similar pattern playing out again—Atos is trading at record-low levels below €0.0030 ahead of the reverse split. This suggests that once the new shares start trading at a higher nominal price, investors may again face forced sell-offs and further declines, leading to more financial losses for shareholders.
Key Takeaways:
The reverse split does not add value—it only reduces the number of shares outstanding, while total market capitalization remains unchanged.
Shareholders with less than 10,000 shares must adjust their positions before April 23, 2025, or risk forced liquidation.
Without strong fundamentals, the post-split price may drop again, just like last time.
Investors should remain cautious and consider the risks before making any decisions. Atos must prove its financial stability rather than relying on stock restructuring to create the illusion of recovery.
Short-Term Buy Position. 31$ - 40$IonQ (IONQ): Short-Term Buy Position with Bearish Confirmation Risks
IonQ is currently in a short-term buying zone after experiencing a long pullback from $44 to $31. The next key move is a rebound to at least $35, where the stock could face resistance at its November 2021 levels or attempt a rise toward $40 to create a bearish confirmation pattern.
If the bearish trend continues, IonQ could head toward $26, a critical support level where two key scenarios could unfold:
Consolidation between $20 and $26, signaling market uncertainty and potential range-bound trading.
Bullish channel formation between $26 and $35, which would suggest a gradual recovery and potential accumulation.
Long-Term Risk: A Steep Correction Like 2021
If IonQ fails to stabilize within these key price zones, it could trigger a major percentage drop of 80–85%, similar to its 2021 crash from $35 to $10.
Key downside levels to watch:
$26: Must hold to prevent deeper declines.
$20: Below this, the stock enters a high-risk phase.
$10: A worst-case scenario if bearish momentum intensifies.
Conclusion: Critical Levels to Watch
Short-Term Resistance: $35–$40 (needs to break for bullish momentum).
Long-Term Support Zones: $26 (major level) and $20 (critical risk point).
Failure to hold above $26 could result in a sharp decline, repeating the 2021 pattern with a potential 80–85% drop.
IonQ must stabilize above $26 to avoid a deeper correction, while a move past $40 could temporarily delay the bearish scenario. The next few months will be crucial in determining its long-term trajectory.

BITCOIN | BUY ScalpingClose sells in profits.
Let's scalp.
TP: 11k.
SL: 10.3K.
TP-time: 6 hours.
TP2-time: 12 hours.


BITCOIN | time for flying to 11500! Rinnengan-patternThis is a trade, close in profits/loss in 6 hours.
Risk: 0.01 by every 1k in your account.
Let's GO!
Thanks Kishimoto! Lol


BREAKING NEWS: GOLD is GOING to 1850-2300-1500 in NO TIME!Due to super high volatility, we will see this entertaining scene in no time.
This is a simple analysis, while I'm recovering. LOL.
—Do you want to bet?
—Better not, I don't want to win.
See you.
"If you don't understand my analysis, it is time to learn advanced calculation and frequency waves, I do these analyzes for entertainment, my trading style is time-trading, I don't have to look at prices, I see them in time, through fibonacci" .
—JB

GBPJPY is GOING to THE MOON | QFish-harmonic-patternRisk: 0.01 by every 1k in your account.
Let's go!

BITCOIN is GOING to REACH 22k!! Fibonacci-Advanced-Analysis! I have decided to do my analysis seriously. I will take longer to do them due to my health, but I am a little bit better.
Zone for buying: 10500.
SL: 8000.
TP1: 15000
Final TP: 22000.
Risk: 0.01 by every 1k in your account.
Let's GO!

GOLD | Quantum-longterm-Analysis +370k pipsAT THE BEGINNING OF THE MARKET:
SELL LIMIT: 1945
Final TP: 1400
BUY LIMIT: 1400
Final TP: 5200
SELL LIMIT: 5200
Final TP: 800
Guys, if you want to predict the future, you have to STUDY a lot...
"Dust off your study books, and STUDY". Just that!

GOLD is GOING to CRASH to 1.4K! Harmonic-Frequency-Analysis!I decided to leave the jokes with the market, and this time I am serious. LOL.
Forecast:
1800-1900-1400-3000
* It will happen.
* Do not use SL, but you have to use this risk management: lot 0.01 for every 1k in your account.
* Be patient.
* Study, that knowledge does not weigh.
GOAHEAD!

SILVER is GOING to REACH 15$! Quantum-Analysis [UPDATE]This time, I decided to stop doing my 1-5min analyzes, this means that this time I AM SERIOUSLY. ROFL!
Forecast: 23-28-15-50
* It will happen.
* Do not use SL, but you have to use this risk management: lot 0.01 for every 1k in your account.
* Be patient.
* Study, that knowledge does not weigh.
GOAHEAD!

ETHEREUM is GOING to REACH $300 | QSwingTradeI found this SWING opportunity.
* It will happen.
* Do not use SL, but you have to use this risk management: lot 0.01 for every 1k in your account.
* Be patient.
* Study, that knowledge does not weigh.
GOAHEAD!

GOLD will be REACHING 1700! Fish-pattern / Advanced-analysis** The central parallel channel was deduced mathematically.
I have decided to give another point of view about gold. Gold will follow these prices: 1700-2300-1950-2600-2100-3200.
Hope you enjoy it, this is art.
* It will happen.
* Risk management: 0.01 for every 1k in your account.
* If you use this risk management, do not use SL.
I'm just the best of all time. LOL.

BITCOIN will be REACHING 9k soon! QWAnalysisI've been a bit bored, but I remind you to study so you don't comment ignorantly. ROFL.
* It will happen.
* Do not use SL, if you use my risk management.
* Risk management 0.01 for every 1k in your account.

Gold will be REACHING 1700 in a FEW TIME! Elliot's wavesWell, I did this analysis out of boredom. LOL.
Next stop: 1700, then 3200.
See you! #QuantumTrader

TESLA will REACH 0 before SKYROCKETING to 5K! QuantumPATTERN!This is the first quantum-pattern (20+ in total, more or less):
FISH-PATTERN.
A word of advice: look at the analysis, NOT THE TITLE. I was very bored, and decided to surf the waves with TESLA.
I hope you like it, and that you STUDY. Laziness is more famous than effort and dedication, if you don't study, you only come to lose money in trading.
* It will happen.
* Manage your risk.
# Let'sGO!
----------------------------------------
** I'm just the best student of the best educators on the planet:
* Gianvictor Cuevas
* Jonathan Nuñez
* Carlos Valencia
* David Mojica
* Javier Vasquez Palacios (mod TradingView)
With them, I learned about market geometry, Elliot's waves, harmonic patterns ... And I just learned everything by drawing each pattern, and created my own style: Quantum-time-trading. Guys, I spent practically 18 hours (according to my father 22, lol) a day studying, the MARKET is a VIDEO-GAME when YOU STUDY. Unwrap your math books, and study...
Thanks to the haters for making me famous in my entertainment reviews, and everyone else, thanks for your encouragement.
I'm JB, TESLA / DaVinci from this generation and #NextBillGates. ROFL! I'm joking, but is TRUE. Hahaha.

EURUSD is GOING to CRASH DOWN to 1.13 | DaVinciArt-AnalysisI was somewhat bored, and decided to entertain myself for a while. I hope you enjoy the design, and comment what you think. Guys, understand, I have no comparison today, I am the best in the multiverse. LOL.
Be silent, and learn. Study, and you will understand, I wait for you in my classes about Quantum-time-trading.
SL: 1,186
TP: 1.13

SILVER is GOING to follow this combination: 22-27-19-40 QHARemember guys: "money goes, money comes, KNOWLEDGE NOT". Start studying and you will have results.
Stay quiet and learn, I'm the best by far, just that.

GOLD is GOING to 1800, then SKYROCKET to 2200! I was a bit bored, and decided to take this analysis from another point of view, soon, gold will reach 4000, but it needs to have several corrections before arriving. Please, STUDY, and stop talking nonsense. ROFL!
