QKCUSDT – Order Flow Confirmations Support a Short BiasIn my latest QKCUSDT analysis I gave you the best zone possible!
Following the current order flow and market data, my bias on QKCUSDT remains short. The analysis consistently shows that this coin is under selling pressure, and the ideal entry area for shorts is centered around the blue box. However, as always, I emphasize the importance of waiting for clear confirmations before executing any trade.
Key Insights:
Order Flow Analysis:
The order book indicates a strong presence of sell orders dominating the current market dynamic. This reinforces the bearish outlook and supports a short bias.
Blue Box – The Ideal Short Area:
The blue box has been identified as a key region for short entries. When the price reaches this level, it presents an opportunity for a short trade—but only if further confirmations are observed.
Confirmation is Critical:
I always wait for lower time frame breakdowns, along with CDV signals and other technical confirmations, to validate the short setup. No confirmation, no entry.
Trading Approach:
Short Bias Maintenance:
Stick to the short bias as the order flow consistently supports selling pressure.
Entry on Confirmation:
When the price enters the blue box, look for a clean breakdown on lower time frames backed by confirmation signals. This is the precise moment to execute a short trade.
Risk Management:
No trade will be taken unless the confirmations align perfectly. Discipline and patience are what separate professional traders from the rest.
Why Follow This Strategy:
I rely on data-driven decision-making and advanced order flow analysis. My approach is not based on guesswork but on clear, confirmed market signals. My high success rate is a result of trading with precision and discipline—qualities that are evident in every setup I share. If you want to trade with confidence and achieve results similar to mine, following these exact steps will ensure you’re always on the right side of the market.
Follow closely, and as always, trade smart and with confirmations.
📌I keep my charts clean and simple because I believe clarity leads to better decisions.
📌My approach is built on years of experience and a solid track record. I don’t claim to know it all but I’m confident in my ability to spot high-probability setups.
📌If you would like to learn how to use the heatmap, cumulative volume delta and volume footprint techniques that I use below to determine very accurate demand regions, you can send me a private message. I help anyone who wants it completely free of charge.
🔑I have a long list of my proven technique below:
🎯 ZENUSDT.P: Patience & Profitability | %230 Reaction from the Sniper Entry
🐶 DOGEUSDT.P: Next Move
🎨 RENDERUSDT.P: Opportunity of the Month
💎 ETHUSDT.P: Where to Retrace
🟢 BNBUSDT.P: Potential Surge
📊 BTC Dominance: Reaction Zone
🌊 WAVESUSDT.P: Demand Zone Potential
🟣 UNIUSDT.P: Long-Term Trade
🔵 XRPUSDT.P: Entry Zones
🔗 LINKUSDT.P: Follow The River
📈 BTCUSDT.P: Two Key Demand Zones
🟩 POLUSDT: Bullish Momentum
🌟 PENDLEUSDT.P: Where Opportunity Meets Precision
🔥 BTCUSDT.P: Liquidation of Highly Leveraged Longs
🌊 SOLUSDT.P: SOL's Dip - Your Opportunity
🐸 1000PEPEUSDT.P: Prime Bounce Zone Unlocked
🚀 ETHUSDT.P: Set to Explode - Don't Miss This Game Changer
🤖 IQUSDT: Smart Plan
⚡️ PONDUSDT: A Trade Not Taken Is Better Than a Losing One
💼 STMXUSDT: 2 Buying Areas
🐢 TURBOUSDT: Buy Zones and Buyer Presence
🌍 ICPUSDT.P: Massive Upside Potential | Check the Trade Update For Seeing Results
🟠 IDEXUSDT: Spot Buy Area | %26 Profit if You Trade with MSB
📌 USUALUSDT: Buyers Are Active + %70 Profit in Total
🌟 FORTHUSDT: Sniper Entry +%26 Reaction
🐳 QKCUSDT: Sniper Entry +%57 Reaction
📊 BTC.D: Retest of Key Area Highly Likely
📊 XNOUSDT %80 Reaction with a Simple Blue Box!
📊 BELUSDT Amazing %120 Reaction!
I stopped adding to the list because it's kinda tiring to add 5-10 charts in every move but you can check my profile and see that it goes on..
Quarkchainbitcoin

QKC to 1000 sats? LikelyQuarkchain started to gain buying volume due to DeFI campaign, Staking, and Mainnet Upgrades. I think it is highly oversold, and we can see a bullish run to 1000 sats. You may aim for higher if you want, but mind the resistance.
As always, this is not a financial advice remember to do your own research.
Feel free to leave a comment below and let me know what you think.


Bullish Pullback on QKCHello, Traders,
The momentum is ultra Bullish for QKC... The price is testing an important support level and uptrend line and already find support at this level.
65 Sats area it is a dream place to buy this asset.
Push The like button and follow us on TradingView.

QKCBTC a bullish reversal pattern at the supportHi friends hope you are well in welcome to the new update on QuarkChain token. This token has surged more than 250% just in 2 month. So in today's article we will try to understand how the QKC token completed the bullish setup and what it can do next.
Formation of pennant:
Almost a year ago in July 2019 I posted an article on tradingview where I revlealed that the price action of QKC is moving within a pennant. And soon it can breakout this penant. Therefore I design my sell targets accordingly. The price action moved with the support of the pennant and somehow below the support as well and finally left the pennant directionless and after moving sideways started a bullish move in Feb 2020.
A wedge movement:
I tried to catch this pattern bit early. But in fact, the price action behaved like a falling wedge instead of pennant. Now if we watch the live chart then the movement of the price action and the pattern is as below:
Down channel, long term bullish signal by directional movement and breakout:
Now if we switch to the daily chart in order to take a closer look on the sideways movement after when the price action left the wedge pattern. Then price it can be observed that the priceline was moving in a down channel since September 2019 up to 22 May 2020. In the meanwhile the price action has made several attempts to break out this channel.
But after 14 Feb 2020 the movement of the price action should be noticed. That the priceline did not move down at support. And it was moving continuously very close to the resistance of this down channel. And if we observe the directional movement indicator then after 8th Feb 2020 the positive direction indicator crossed up the negative directional indicator that is very powerful bullish signal. And we receive a bear cross between these two indicators only from 6th to 12th May 2020 for some time. And the positive directional indicator again crossed up on 14th May 2020. Finally the price action followed this bullish signal that was appeared after 8th Feb and broke out the resistance of this channel.
From support of the channel up to the highest price level this move is more than 250%.
Formation of an up channel:
Now after breaking out the previous down channel. The price action has started its movement within an up channel. The priceline is moving within this channel very well by hitting the resistance and support. At this time the price action of quarkchain has again reached at the support and there are chances that the price action may start a movement to the resistance from here. However we can expect unless this support of the channel will be not broken down the bullish rally will be continued.
A bullish reversal pattern at the support:
Now if we switch to the more small-time 12 hour time period chart then it can be seen that the price action has formed a bullish BAT pattern at the support of the channel. The appearance of a bullish reversal pattern at the support of the channel is very positive signal. All the legs of this pattern are driven perfectly as required for the bullish BAT move, there is only a little bit different from A to B leg retracement level that I have ignored. Now as per Fibonacci sequence the potential reversal zone and the Fibonacci projection area of this A to D leg is as below:
Potential reversal zone 0.00000070 to 0.00000067 sats
Fibonacci projection: 0.00000076 to 0.00000086 sats
So if we buy at the potential reversal zone and sell in the Fibonacci projection area then it can be up to 28% move. However if the priceline will cross up the 0.786 Fib projection of A to D leg that is the maximum extent of Fibonacci projection then the price action can start more powerful bullish rally

#QKC/BTC (June 21)QKC looks strong and we can expect new highs for QKC. QKC can fully increase to 120sts or even 180sts in this rally. And this is the main trend
If you want to join this party, you can wait to buy it at 70-75sts
Holding a coin that has risen too high also has a lot of risks, so you should always prepare a stop loss if it falls below 60sts.

QuarkChain #QKCBTC Possible Bull RunInstructions are shown in the chart. Please follow them.
Good luck

QuarkChain/Bitcoin (Sept 13) #QKC $QKC #BTC $BTCBuy : 80
Sell : 90-100-110
Mid-Hold : 120-150
Stop : Under 75

QuarkChain/Bitcoin (Aug 14) #QKC $QKC #BTC $BTCQKC looks like a stable coin now. But I think it will make a big move in next day
Buy : Close to 150 as possible
Sell : 175-220
Mid-Hold : 315
Stop : Under 145

QKC Another Leg - Short Term The reason of QKC still bullish
- Formed triangle pattern
- ABCD bullish patern
Note : will be invalid if it break 185 support

QuarkChain/Bitcoin (24 May) #QKC $QKC #BTC $BTC#BUY
QKC is moving in the Big Bullish Flag pattern and target is quite high at 600, on the top line of this bullish flag. However, 470 area is a very strong resistance zone and I recommend selling here first and waiting for the opportunity to buy back and sell at 600 zone
Current Price : 358
Buyzone : Buy close to 320-325 as possible
Sellzone : 375-470-600
Stoploss if price is lower than 300 and consider buying back around 250

QKC - SAFE PROFITBuy Price: Green Zone
TP: Blue Zone
Support: Orange Line
Resistance: Purple Line
SL: Red Zone (I don't recommend to sell in loss.)
Invest Suggestion: 30 Percent
Profit Expectations: 40%
This is a safe trade, and a easy one. QKC looking very promising!
QKC has a mainnet on 30th and we have a reverse tendency happening on it!
See me previous analysis and how profitable the are!!!
Sell when you get some profit, according the way you trade.
Keep following us and please like this idea.
Any doubts? Send in the comments or in our telegram or Inbox here.
Thanks for visiting.

QKC mainnet approachingThinking about adding to my $QKC bag - mini triangle breakout and the hard awaited mainnet around the corner. No confirmation on the date yet, but should be here before the end of the month.

QUARKCHAIN - Ready for a 60% run!Quarkchain Mainnet 30th April!
medium.com
Buy: 850-900-950
Target: 1450 +
Strong support: 640
Duration: 3 weeks (30 April 2019)
- Dallas

Daily Bullish Signal $QKC #QKC #QKCBTC (18 March 2019)RED ARROW indicates the EXPECTED Time and Targets
Level Stoploss point up to maximize profit and reduce risk
I'm working all the time, even in Bearish Market

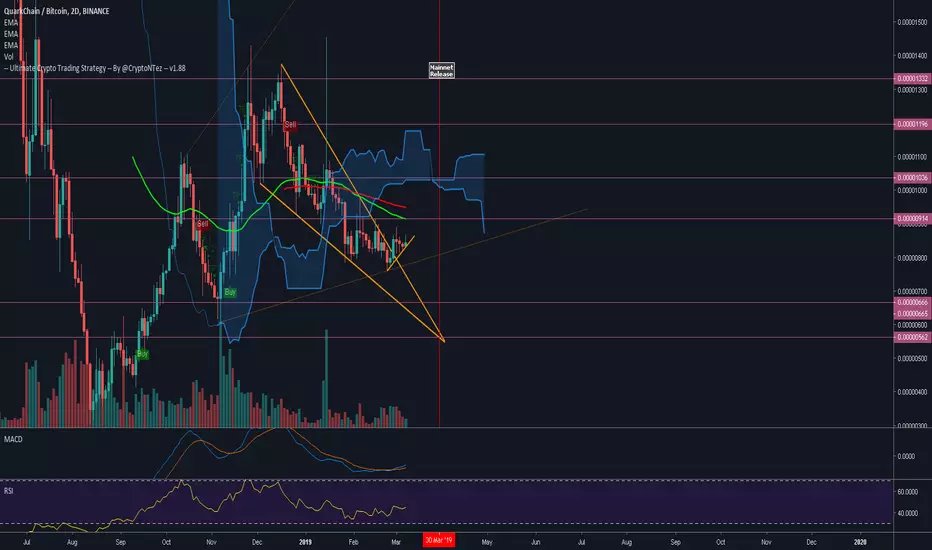
Trying to break the Falling wedge (volume is still missing so ca$QKC Trying to break the Falling wedge (volume is still missing so careful).
MACD did a soft bullcross on the daily & RSI is rising slowly. No Buy signal from the UCTS yet.
What keeps me bullish is the Mainnet release on March end.
Will update if something changes #QKC
QKC is Showing Strong Bullish SignalsBINANCE:QKCBTC is getting ready for a massive up trend we have seen positive indication from
-RSI
-Aroon
-EMA
and also have witnessed increasing volume and happy to mention that BINANCE:QKCUSD is expected to inflate in coming days as backed by studies.
Event updates on Quarkchain:
QKC has ended its Bounty program as promised rewards would be sent after the mainnet launch.
QKC Mainnet launch is taking place in Q1 2019.
Selling targets are mentioned in Text form just to differentiate :P

QKC – Quarkchain – 50% gain within a couple of daysHi Guys!
Here is another trading opportunity .
Check out the details .
This project is really awesome . They progress really quickly and they deliver
• As they promised they delivered the Testnet 2.0 . You can officially mine QKC
• They use innovative hybrid consensus which is called Proof of staked Work
• They are fully compatible with ETH smart contracts
• With 6450 nodes and 256shards and presented a live demo of 10K+ TPS which is about 500X Ethereum’s throughput .
• Their goal is to reach 1M+ TPS
Technical analysis details:
• The price chart touched the support line which is present since mid -August 2018 .
There is a big chance to go up from this point.
• The chart is right below the EMAs. One move up and they are all broken.
• Sentiment Zone Oscillator - The oscillator just touched the bottom . This is the lowest level since September 2017 .
• Weis Volume - it looks like the end of the supply . All we need is more demand now.
• The bounce up should happen within days .
• 50% gain possible .
• Set your stop-loss at 0.00000820
Happy trading!
Drop us a line in the comment section if you ready to take off.
MASSIVE Hugs!
WBM Team

QKC: QuarkChain Buying Opportunity 25% !!QKC are Showing Awesome Super Bullish Since Many times,
Let See !!
Can Trade Above Given Entry, Exit and Traget Point.
You Can Also Set Stop Loss own RR Ratio.
Warning- I m Not a Financial Advisor this idea Only For Educational Purpose Only.
Thank You !!

QKCBTC - BUY - Cup and Handle reversal pattern.QKCBTC - Buy Trade
Today's bullish breakout signals further move higher towards the previous high at 1053 and then target 1450 in the medium term.
Look to buy at 750 with stops below 700.
Cup & Handle reversal pattern formed.

Quarkchain Wave 3Hi there,
I believe that we are going on the wave 3.
QKC will be on the top 20 in the future!!
Cheers
Pedro

QKC – Quarkchain – one of few cryptos that riseHi Guys!
Today we have another bloodbath. It will pass. We know you might be extremely anxious. Don’t be.
Here is a cheer up.
QKC is one of the few cryptos that actually grow.
In the middle of October, we managed to achieve as high as 0.00001100
This will be our benchmark.
Technical analysis details:
• Over 20% growth within 24h (17/18.11)
• Above all EMAs (9, 21, 50, 100)
• Bullish pattern - pennant in an uptrend
• Ichimoku Cloud - the price chart over Tenkansen(red) which crossed KijunSen (blue)
• Weis Volume Waves - The supply is decreasing. Wait for more demand.
• MACD – still a positive divergence
• 1st target to reach is 0.00000968
• 2nd target to reach is 0.00001068
• 3rd target to reach is 0.00001105
• Stop-loss at 0.00000708
So this coin might be the only option to earn some money or at least not lose.
Are you in?
Thanks for all your messages and likes.
You are great!
MASSIVE Hugs!

QKC–Quarkchain–the only child that grows – over 40% profit soonHi Guys!
As the market plunged there is such token that actually grows.
Its name is Quarkchain.
It seems like the past correction is over and we have another 5th Elliots Wave.
Here are technical analysis details:
• The current uptrend with the angle of 78 degrees. This is even stronger than the one on the wave 3
• We can reach as high as 0.00001300 which is over 40% profit from now
• Ichimoku Cloud – the price chart has broken TenkanSen (red line) for good. The TenkanSen is about to break KijunSen (blue line) – very healthy
• MACD – bullish cross observed
• Weis Waves – lots on demand and no supply so far. Small correction exected.
• Observe 0.00001100 which is the max of the last wave. In order to fulfill the last wave we have to break it. It not we fall down. Time and our update will tell.
So guys. Even though the market is so weak we can still earn some money. QKC seems to be a perfect candidate for this.
If you like our job, please do give us a like.
If you don’t want to miss the update don’t forget to click follow button on our profile.
Stay tuned.
Massive Hugs!
WBM Team
