Quasimodo Pattern + Validator Support = Bullish Signal for ETHToday I want to analyze Ethereum ( BINANCE:ETHUSDT ) for you, many tokens are on the Ethereum network , and the increase or decrease of Ethereum directly affects most tokens.
So please stay with me.
Ethereum is trading in a Heavy Resistance zone($2,929_$2,652) near the Resistance lines and 200_SMA(Daily) . It is worth noting that Ethereum is preparing itself for a third attack on 200_SMA(Daily).
In terms of Price Action Analysis , Ethereum could start to rise with the help of the Bullish Quasimodo Pattern and break out of 200_SMA(Daily) and Resistance lines .
In terms of Elliott Wave theory , Ethereum appears to have completed a main wave 4 near Important Support lines . The structure of the main wave 4 is a Double Three Correction(WXY) . By breaking the 200_SMA(Daily) and Resistance lines , we can confirm the end of the main wave 4 .
The ETHBTC ( BINANCE:ETHBTC ) chart conditions are bullish , so it seems like investing in Ethereum could be better than Bitcoin . At least if the market falls , Ethereum is likely to be less likely to suffer a decline .
Note : Over 150,000 Ethereum validators, representing approximately 15% of the network, signaled support for increasing the gas limit from 36 million to 60 million units. This proposed change aims to enhance network capacity, reduce transaction fees, and improve scalability. While this development could positively impact ETH's price by making the network more efficient, it's essential to monitor potential technical risks and ensure that decentralization is maintained.
Note: If Ethereum touches $2,547 , we can expect further declines.
Please respect each other's ideas and express them politely if you agree or disagree.
Ethereum Analyze (ETHUSDT), 1-hour time frame.
Be sure to follow the updated ideas.
Do not forget to put a Stop loss for your positions (For every position you want to open).
Please follow your strategy and updates; this is just my Idea, and I will gladly see your ideas in this post.
Please do not forget the ✅' like '✅ button 🙏😊 & Share it with your friends; thanks, and Trade safe.
Quasimodo

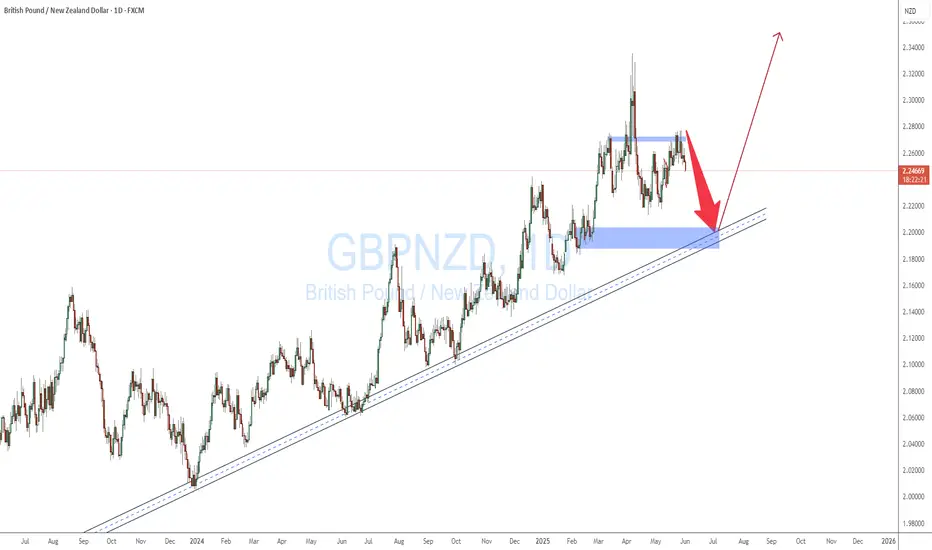
GBPNZD TANK BEFORE THE SURGEGBPNZD is expected to fall o the daily dynamic support before the surgeto break the next high.
the pair keeps tanking from a a dailt TF quasimodo LEVEL
ETHUSD – Bullish Quasimodo + iH&S Breakout | Upside Targets!Ethereum (ETHUSD) has completed a textbook bullish Quasimodo pattern in confluence with an Inverse Head & Shoulders (iH&S) on the 15-minute timeframe. Price has broken out with strong bullish momentum, and the structure suggests more upside ahead.
📊 Technical Breakdown
1. Quasimodo Pattern
A well-defined Quasimodo reversal formed at the swing low, providing early signs of a bullish trend shift.
This pattern combines a higher low and reclaimed structure—offering an excellent base for trend continuation.
2. Inverse Head & Shoulders
Left Shoulder, Head, and Right Shoulder clearly structured with neckline breakout confirmed.
Breakout above neckline resulted in a 5.38% rally into minor resistance.
3. Bull Flag Formation
A short consolidation just below the recent highs resembles a bull flag, typically a continuation signal.
Breakout from the flag would trigger the next leg toward the final target.
🎯 Targets
Minimum Target: 2,121.41 — aligns with neckline projection.
Final Target: 2,229.90 — 6.27% projected move based on iH&S measured move.
📌 Trade Idea
Entry Zone: On bull flag breakout above 2,093
Stop Loss: Below 2,060 (flag low support)
TP1: 2,121
TP2: 2,229
🔎 Key Confluences
Pattern Breakouts ✅
Strong Momentum ✅
Clean Structure & Price Geometry ✅
ETH bulls have reclaimed short-term control. If momentum sustains, the upside targets are well within reach.

Bullish Quasimodo in Play – Bitcoin’s Next Target: $84,500?Bitcoin ( BINANCE:BTCUSDT ) attacked the Resistance zone($84,130_$81,500) again as I expected yesterday . Has Bitcoin given up or is it gathering momentum to attack the resistance zone again? What do you think?
Bitcoin is moving near Yearly Pivot Point and Cumulative Long Liquidation Leverage($80,537_$78,390) .
From Elliott Wave theory , Bitcoin appears to be completing an Expanding Flat(ABC/5-3-5) corrective wave .
According to the Price Action , Bitcoin appears to be completing the Bullish Quasimodo Pattern .
Educational Note : The Bullish Quasimodo Pattern is a reversal pattern that signals a potential uptrend after a downtrend. It forms when the price creates a lower low followed by a higher high and a higher low, confirming a shift in market structure.
I expect Bitcoin will NOT leave the CME Gap($86,400_$84,650) unfilled and will rise to at least $84,500 .
What do you think, will Bitcoin leave this CME Gap($86,400_$84,650)?
Note: If Bitcoin falls below $78,800, we should expect further declines.
Please respect each other's ideas and express them politely if you agree or disagree.
Bitcoin Analyze (BTCUSDT), 1-hour time frame.
Be sure to follow the updated ideas.
Do not forget to put a Stop loss for your positions (For every position you want to open).
Please follow your strategy and updates; this is just my Idea, and I will gladly see your ideas in this post.
Please do not forget the ✅' like '✅ button 🙏😊 & Share it with your friends; thanks, and Trade safe.

Bearish Flag & Quasimodo Patterns—Is EURUSD Set to Drop?First, let's have a Fundamental Analysis of EURUSD ( FX:EURUSD ).
The EURUSD rate is influenced by several key fundamental factors :
1. Divergent Economic Indicators :
United States : Recent data indicates a robust labor market, with job growth maintaining momentum. This strength supports the U.S. dollar, as investors anticipate potential monetary policy tightening by the Federal Reserve to manage inflationary pressures.
Eurozone : Conversely, the Eurozone faces economic challenges, including unexpected inflation acceleration and declining industrial production, particularly in Germany. These factors may constrain the European Central Bank's (ECB) ability to adjust interest rates, potentially weakening the euro.
2. Central Bank Policies :
Federal Reserve (Fed) : The Fed's recent communications suggest a cautious approach to interest rate adjustments, balancing economic growth with inflation control. The prospect of maintaining or increasing rates could further bolster the U.S. dollar.
European Central Bank (ECB) : The ECB is grappling with rising inflation amidst a struggling economy. This scenario complicates policy decisions, as increasing rates to combat inflation might hinder economic recovery, thereby exerting downward pressure on the euro.
3. Geopolitical Developments :
The U.S. administration's recent tariff threats have introduced uncertainties in global trade. Such actions typically lead investors to seek safe-haven assets, benefiting the U.S. dollar due to its perceived stability.
In summary, the EURUSD is currently experiencing downward pressure , driven by stronger U.S. economic performance, proactive Federal Reserve policies, and geopolitical factors favoring the U.S. dollar. Conversely, the Eurozone's economic difficulties and the ECB's constrained policy options contribute to a weaker euro. These dynamics suggest a potential continuation of the EURUSD's bearish trend in the near term .
--------------------------------------
Now, let's analyze the EURUSD chart in terms of Technical Analysis .
EURUSD is moving near the Resistance zone($1.039-$1.033) , Potential Reversal Zone(PRZ) , 100_SMA(4-hour) , Monthly Pivot Point , and Resistance lines . Each of these items is considered a good resistance for EURUSD .
In terms of Price Action , if we look at the EURUSD chart in the 1-hour time frame , we can see the Bearish Quasimodo Pattern , which is one of the reasons for EURUSD's fall .
Educational Note : The Bearish Quasimodo Pattern is a price action reversal pattern that signals a potential downtrend. It forms when the price creates a higher high (HH) followed by a lower low (LL) and a lower high (LH), breaking the market structure.
From the point of view of Classical Technical Analysis , it seems that EURUSD has managed to form a Bearish Flag Continuation Pattern . It is a good sign for the continuation of the downward trend of EURUSD .
Educational Note : The Bearish Flag Pattern is a continuation pattern that signals the continuation of a downtrend. It consists of a sharp downward move (flagpole) followed by a consolidation phase in a small upward-sloping channel (flag). A breakdown from the flag confirms the pattern, indicating further price decline.
According to the theory of Elliott waves , according to the volume of the previous movement, it seems that EURUSD is completing wave 4 , and it is possible that we are still in the main wave 3 even with a further fall.
I expect EURUS D to fall to at least the Support zone($1.0285-$1.0255) after entering the PRZ or after breaking the lower line of the ascending channel of the bearish flag pattern, and if this zone is broken , we should expect to fall to the next Support zone($1.0222-$1.0175) and Monthly Support(1) .
Note: If EURUSD touches $1.03700, we can expect more dumps.
Please respect each other's ideas and express them politely if you agree or disagree.
Euro/U.S.Dollar Analyze (EURUSD), 1-hour time frame.
Be sure to follow the updated ideas.
Do not forget to put Stop loss for your positions (For every position you want to open).
Please follow your strategy and updates; this is just my Idea, and I will gladly see your ideas in this post.
Please do not forget the ✅' like '✅ button 🙏😊 & Share it with your friends; thanks, and Trade safe.

AUDCAD POISED FOR A SELLI’m looking at price sweeping liquidity ($$$)to the upside and begin the downtrend. Possible TP indicated.

BTCUSDT: QUICK 1:3 RR SET UPPrice could come down to mop up liquidity at the 61.8 - 50 % fib zone before a move upwards. A conservative 1:3 RR will be achieved with this.
Fingers crossed 🤞🏻

Gold is Ready to Fall Again==>>Short-term!!!As I expected , Gold ( OANDA:XAUUSD ) started to fall from Resistance zone($2,670-$2,653) , Potential Reversal Zone(PRZ) and 50_SMA(Daily) .
Gold is moving near the Support zone($2,639-$2,630) .
Educational Tip : Gold also fell in terms of Price Action with the help of a Bearish Quasimodo Pattern .
According to the theory of Elliott waves , gold seems to have completed the main wave C with the help of the Ending Expanding Diagonal at the Resistance zone($2,670-$2,653).
I expect Gold to break the Support zone($2,639-$2,630) and Support lines and fall again. Of course, the Long position around $2,634 can be attractive (for the short term) .
Overall, in my opinion, the best Stop Loss(SL) for a Gold short position can be $2,656.
⚠️Note: If Gold breaks the Resistance line and touches $2,656, we should expect Gold to rise further.⚠️
🔔Be sure to follow the updated ideas.🔔
Gold Analyze ( XAUUSD ), 15-minute time frame ⏰.
Do not forget to put Stop loss for your positions (For every position you want to open).
Please follow your strategy; this is just my idea, and I will gladly see your ideas in this post.
Please do not forget the ✅' like '✅ button 🙏😊 & Share it with your friends; thanks, and Trade safe.

XAUUSD bearish strongAnalysis based on the quasimodo pattern, it appears that gold failed to make a new rise, and continued to decline.

Gold Analysis ==>> Bearish Quasimodo(QM) Pattern!!!Gold ( OANDA:XAUUSD ) moved as I expected in the ✅ previous post ✅.
Gold is currently moving near the Potential Reversal Zone(PRZ) and inside the Time Reversal Zone(TRZ) , and the loss of the Lower line of the Ascending Channel can indicate weakness in the upward movement .
According to the theory of Elliott waves , it seems that Gold has managed to complete the main wave 5 , and now we have to wait for Corrective Waves .
From the point of view of Technical Analysis , it seems that Gold has succeeded in forming the Bearish Quasimodo(QM) Pattern , which can be another sign of the reduction of gold .
I expect Gold to decline to at least the Support zone($2,720-$2,708) , and if the support zone is broken , we should expect Gold to continue falling to the Next Support zone($2,686-$2,666) .
⚠️Note: If Gold can goes over $2,760, we can expect more pump for Gold.⚠️
🔔Be sure to follow the updated ideas.🔔
Gold Analyze ( XAUUSD ), 1-hour time frame ⏰.
Do not forget to put Stop loss for your positions (For every position you want to open).
Please follow your strategy; this is just my idea, and I will gladly see your ideas in this post.
Please do not forget the ✅' like '✅ button 🙏😊 & Share it with your friends; thanks, and Trade safe.

USOIL (WTI) → bullish setuphello guys.
Trendline Break: The price has broken through a downward-sloping trendline, which is a potential signal for a trend reversal or continuation of the upward move.
Order Block Area: There is a highlighted horizontal zone (yellow) around the 70.30 level, which may act as a significant resistance or supply area. Traders are likely watching for a test or break of this zone.
QML Pattern (Quasimodo): The yellow circle highlights a QML pattern where the price reverses from a prior support level, suggesting a potentially bullish setup.
Upward Target: The projected arrow suggests that if the price can sustain above the broken trendline, it may attempt to reach the 70.30 resistance level, representing a potential price target.
Volume Consideration: While not displayed, monitoring volume increases as the price moves toward the target zone could validate the strength of the upward move.
Support Zone: A key support area appears around the 67.50 level, as shown by the horizontal blue line. If the price reverses, it could test this level again.
Overall, a bullish setup appears in place with key resistance around 70.30, but any failure to break that zone could result in a pullback to support around 67.50.
___________________________
✓✓✓ Always do your research.
❒❒❒ If you have any questions, you can write them in the comments below, and I will answer them.
❤︎ ❤︎ ❤︎And please don't forget to support this idea with your likes and comment

Gold (XAU/USD) - Potential Bullish Reversahello guys.
Price Action Overview:
The chart shows a significant correction followed by a consolidation phase, with price touching key levels of support and resistance.
Weak QM (Quasimodo) pattern identified near the top, which indicates potential weakness in the downtrend.
QML (Quasimodo Line) at a lower level has held as a strong support zone, and price has rebounded from this level.
Key Support and Resistance Levels:
Support: The price reacted strongly from the lower diagonal trendline (QML region) and horizontal support zone, signaling buyer strength.
Resistance: A key target for the bullish move is set around 2,679, indicated by the purple dashed line.
Market Structure:
Price is in a corrective pattern after failing to break lower support zones, showing a potential bullish reversal.
"Hunted the pattern" signifies a fake-out below key support, trapping sellers before reversing upward.
Risk and Reward Setup:
Stop-Loss placed below the recent lows (just above 2,028), protecting against downside risk.
Take-Profit target is around 2,679, aiming for a substantial upside.

Bitcoin's Path Toward $65k After Key Resistance Break-high riskhello guys.
as I said before:
Head and Shoulders pattern completed: A clear inverse head and shoulders pattern has formed, signaling a bullish reversal. The breakout above the neckline confirms this bullish structure.
Breakout confirmed: Bitcoin broke past the previous resistance at $62,300, which now acts as a strong support level. The price retested this zone, reinforcing the breakout.
Upward momentum: The trend shows higher highs and higher lows, suggesting continued bullish momentum in the short term.
Next target at $65,000: The next major resistance is around $65,000, which could serve as a key psychological barrier.
Potential consolidation: A consolidation or retest of the $62,300 level is possible before a move higher.
High risk: Despite the bullish structure, the risk of this position is extremely high. The market remains volatile, and failure to maintain the $62,300 support could lead to sharp declines. Traders should exercise caution.
___________________________
✓✓✓ Always do your research.
❒❒❒ If you have any questions, you can write them in the comments below, and I will answer them.
❤︎ ❤︎ ❤︎And please don't forget to support this idea with your likes and comment

BTC → a scalp positionhello guys.
it is a scalp position in short-term time frame if you are interested!
___________________________
✓✓✓ Always do your research.
❒❒❒ If you have any questions, you can write them in the comments below, and I will answer them.
❤︎ ❤︎ ❤︎And please don't forget to support this idea with your likes and comment

GOLD → A possible breakouthello guys.
Range-Bound Consolidation: The price has been consolidating within a well-defined range, as shown by the repeated tests of both the upper and lower boundaries (labeled 1 to 6). This range represents a period of indecision or accumulation.
Engulfed Pattern & QML: The chart shows an "Engulfed" candle formation followed by a QML (Quasimodo Level), indicating a potential reversal pattern within the range. This suggests a shift in market sentiment that could precede a breakout.
Potential Breakout Scenario: A possible breakout above the upper boundary of the range is highlighted. If the price action breaks above the current range resistance, a move towards the next significant level around $2,540 or higher could be anticipated.
Key Levels to Watch:
Upper Resistance: Around $2,530-$2,540, which has been tested multiple times.
Lower Support: Around $2,480-$2,490, marked by the range's lower boundary.
Key Points:
Range-Bound Market: The price is currently in a consolidation phase, moving within a defined range.
Potential Bullish Breakout: A breakout above the upper range is possible, with targets towards $2,540 or beyond.
Critical Resistance and Support Levels: Watch for a break of resistance around $2,530 or a drop below support near $2,490.
___________________________
✓✓✓ Always do your research.
❒❒❒ If you have any questions, you can write them in the comments below, and I will answer them.
❤︎ ❤︎ ❤︎And please don't forget to support this idea with your likes and comment

GOLD → two QML are fighting against!!hello guys.
Breakout of the Main Channel:
The price has recently broken out of a main ascending channel, suggesting the start of a new bullish phase. This breakout indicates strength and potential continuation to the upside.
Key Levels and QML (Quasimodo Levels):
Two significant Quasimodo Levels (QML and QML 2) are marked on the chart. These levels are typically reversal zones, and they have been tested, with the price showing reactions near these areas, indicating their importance as support and resistance.
Current Price Action:
The price is currently trading around the $2,517 level, within a consolidation phase just below a resistance zone near $2,530.
A small pullback is expected before making another attempt to breach the resistance zone and reach the first target.
First Target:
The first upside target is set around $2,535, which aligns with the next significant resistance area. This level serves as a potential profit-taking zone for traders going long.
Trendline Support:
The ascending trendline acts as a dynamic support. As long as the price stays above this trendline, the bullish momentum remains intact. A bounce from this trendline would confirm the strength of the uptrend.
Potential Bullish Scenario:
If the price breaks above the resistance near $2,530, it will likely hit the first target at $2,535. A successful breakout could lead to further upside, continuing the bullish trend.
Overall, the analysis points to a bullish continuation for Gold, with the key resistance level at $2,530 being the immediate hurdle. Watching how the price interacts with this resistance and the trendline will be crucial for gauging the strength of the bullish move.
___________________________
✓✓✓ Always do your research.
❒❒❒ If you have any questions, you can write them in the comments below, and I will answer them.
❤︎ ❤︎ ❤︎And please don't forget to support this idea with your likes and comment

TESLA → an upward chancehello guys.
let's analysis Tesla
1. Key Levels:
Descending Trendline: The blue trendline represents a long-term resistance level formed by lower highs. The price has recently broken above this trendline, suggesting a potential shift in market sentiment.
QML (Quasimodo Level): The yellow box represents a demand zone where the price found support and launched the current bullish move.
2. Bullish Breakout:
The price broke above the descending trendline, signaling a possible trend reversal. The breakout is marked by a yellow circle on the chart.
After the breakout, the price pulled back slightly but remained above the QML zone, indicating strong support.
3. Upside Potential:
First Target: The first resistance level to watch is around $325.73. This is a previous swing high and could act as a significant resistance level.
Second Target: If the price breaks above $325.73, the next target would be around $402.32, which is another key resistance level from the past.
4. Bearish Scenario:
If the price fails to hold above the QML zone and the trendline, it could indicate a false breakout. This might lead to a retest of lower levels, possibly back to the QML zone or even lower.
Summary
Descending Trendline: A long-term resistance level has been broken, indicating a potential bullish reversal.
QML Zone: A strong demand area supporting the current uptrend.
Bullish Scenario: Targets are $325.73 and $402.32 if the uptrend continues.
Bearish Scenario: Failure to maintain above the trendline and QML zone could lead to a retest of lower levels.
___________________________
✓✓✓ Always do your research.
❒❒❒ If you have any questions, you can write them in the comments below, and I will answer them.
❤︎ ❤︎ ❤︎And please don't forget to support this idea with your likes and comment

GOLD → still bullishhello guys.
1. Price Action & Market Structure:
The chart shows a recent bullish trend, where the price is forming higher highs and higher lows within a rising channel.
A double bottom pattern is evident around the $2,380 - $2,385 level, indicating a strong support area that previously reversed the downward movement into the current uptrend.
2. Key Levels:
Support Zone (QML): The lower yellow shaded area around $2,377 to $2,381 acts as significant support, where the double bottom pattern was formed. This suggests strong buying interest in this zone.
Upper Resistance: The price is currently approaching the upper boundary of the ascending channel, with the next major resistance around $2,450.72. This is the level to watch for a potential breakout or reversal.
3. Bullish Channel:
The price is trending within a well-defined upward channel, indicating a controlled bullish trend. As long as the price remains within this channel, the bullish bias holds.
4. RSI Divergence:
The RSI shows a bearish divergence, where the price is making higher highs, but the RSI is making lower highs. This could indicate weakening bullish momentum and the potential for a short-term pullback or correction.
5. Potential Scenario:
Bullish Continuation: If the price breaks above the resistance around $2,450.72, it could lead to further upward movement within the channel, targeting new highs.
Bearish Reversal: Given the RSI divergence, there is a possibility of a pullback towards the mid or lower boundary of the channel. If the price fails to hold above the $2,430 level, it might test the support near the $2,410 - $2,415 area.
Summary in Bullet Points
Current Trend: Gold is in a short-term bullish trend within an ascending channel.
Support: Key support around $2,377 - $2,385, marked by a double bottom.
Resistance: Major resistance near $2,450.72, at the upper boundary of the channel.
RSI Divergence: Bearish divergence on RSI suggests potential weakening momentum.
Outlook:
Bullish: A breakout above $2,450.72 could lead to new highs.
Bearish: Watch for a potential pullback if the price respects the RSI divergence and fails to break the resistance.
___________________________
✓✓✓ Always do your research.
❒❒❒ If you have any questions, you can write them in the comments below, and I will answer them.
❤︎ ❤︎ ❤︎And please don't forget to support this idea with your likes and comment

GOLD → a possible bullish scenario Hello guys.
- Bullish Trend: The chart shows an overall bullish trend with higher lows forming after a correction.
- Key Resistance Levels:
- QML (Quasimodo Level): A significant resistance zone that could influence the price movement.
- Engulfed Zone: Another resistance area where sellers previously took control.
- Support Level:
- Flip Area: A strong support zone where buyers stepped in to push the price back up.
- Potential Movement:
- The chart suggests a bullish projection, with potential targets around 2,452.55 USD
- Market Sentiment: The chart indicates a bullish bias, with the flip area being crucial for maintaining this outlook.
Overall, the chart suggests a bullish scenario with the potential for further upward movement, contingent on the price action around key resistance levels.
___________________________
✓✓✓ Always do your research.
❒❒❒ If you have any questions, you can write them in the comments below, and I will answer them.
❤︎ ❤︎ ❤︎And please don't forget to support this idea with your likes and comment

GOLD → be aware doesn't trick us!hello guys!
the price is hunted the last area is around $2337,
this seems like a hunt, not like an engulfing!
current state:
1- it formed a QM pattern and touched the target of the pattern!
2- the Qm pattern looks like H&S too!
3- at the upper time frame the main trend still is bearish and the descending channel has not broken yet!
forecast:
1- the price will touch the upper line.
2- afterward, it will start the downward movement.
___________________________
✓✓✓ always do your research.
❒❒❒ If you have any questions, you can write them in the comments below, and I will answer them.
❤︎ ❤︎ ❤︎And please don't forget to support this idea with your likes and comment

Gold → Be Ready for a pumping!Gold → Be Ready for a pumping!
hello guys!
Gold touched the bottom line of the channel and started an upward movement for a while!
now the price is forming a QM pattern and the level of this pattern is a great area to get a long position!
on the other side, the gray area assumed a reachable area due to the last engulfing!
so you can enter the blue area and put your target in the gray area!
___________________________
✓✓✓ Always do your research.
❒❒❒ If you have any questions, you can write them in the comments below, and I will answer them.
❤︎ ❤︎ ❤︎And please don't forget to support this idea with your likes and comment

$ELA AFTER 1,4$ UNSTOPPABLE The Quasimodo Reversal (QMR) pattern, observed in trading, consists of a sequence of price movements: starting with a high, followed by a low, then a higher high, and finally a lower low. This pattern signals a potential reversal in the market's direction, often indicating a shift from bullish to bearish or vice versa. Traders may use this pattern to anticipate price reversals and adjust their trading strategies accordingly. Elastos, like any other asset, may exhibit this pattern, providing traders with opportunities to capitalize on market movements.

Quasimodo PatternTVC:DXY has formed a Quasimodo pattern that is near completion of its right shoulder.
Once it crosses ~105.9, expect it to continue up towards ~112.5 and then ~116.
This is the scenario I expect will occur, and I am hopeful that it will take as long as I've drawn but it could occur much more rapidly.
The longer it takes, the better chance we see extended recoveries or bull runs with new ATHs in stock and crypto markets and Gold. Once it gets near previous highs, we could be in danger of a strong bear market.
However there is still a chance for failure which I've accounted for on the chart and described below:
Should it fail the remain above ~105.9, and then fall below ~100.8 a second time, it could instead drop below monthly resistance (not pictured, but around 98-99) and head towards ~94.8 and then ~92.
I've linked some previous / related ideas for DXY and how it relates to markets in the Related Ideas section below.
