Jump on the XRP band wagon! XRP is the talk of the town lately and it seems like when everybody else mooned XRP was sitting alone in the corner. Now it wants to say something. This is an easy one looking at the weekly bias. Simply giving my expectation.
Question

$APE: What do you think will happen?Hello everyone,
It looks like $Ape is respecting the channel nicely, but what do you think will happen once the support level is reached?
Will it:
1. Go LONG?
2. Go SHORT?

$APE: Will it breakout or test the support level?Will it break out this time, or will it stay within the channel and test the support level?
What do you think?


Where does this go?imo, a breakout from this pennant will come around new years and the final stretch of this longer term bull market will top out in 2022, target around $82k mark

Price near the resistance will it able to break it ?Price near the resistance will it able to break it ?

$XVG #VergeCurrency - fib retracementsThis is with the fib retracement tool.
I see that it's used to predict upward fib levels.
I have been under the impression the trend-based fib analysis tool is more appropriate for this.
Is it? Or is the fib retracement tool okay to use too?

ENBL going to $16 need advice.Kind of a dumb questions but I just wanted to make sure my emotions didnt out weigh my logic on this one.
by iCantw84it
05.17.2021
@SavvyMoneyShow

EURUSD Short Trade Opportunity?I'm doing my own research on smart money trading technique, and it seems like I've found an opportunity for openning a short position.
Neverthless, it seems like trading US $ dollar is tricky right now. Since, everything seems to be depending on news (from my own beginner point of view).
Perhaps, I'm missing something. In that case, please feel free to question my errors, and share your opinion.
Every help is highly appreciated.
Thanks in advance,
Filipo


Which choice is blue (1) or purple (2)? $EGLD #EGLDWhich choice is blue (1) or purple (2)? $EGLD #EGLD

Do you think this pattern is possible on the EGLD?Do you think this pattern is possible on the EGLD?

My Analysis | Provide me insights where I am Wrong ? What I have done and What I believe -->
I have analyzed this chart on the basis of supply-demand and SR lines.
I have used RSI and Parabolic SAR and I am hoping the price will not bounce from the upper level, Because this level of demand served 3-4 as demand level in previous months and most probably it will serve the Demand area Also.
Please tell me where I am wrong and provide me positive feedback.

Just wanted to know if its a valid ascending triangle for BTCUSDJust wanted to know if its a valid ascending triangle for BTCUSD. Would really appreciate a good answer/explanation!


please help mehi guys may be this is ridiculous for you but this question is still in my head without answer
for example i want draw pitchfork from marked candle can i use high and low of one candle for drawing fork ? is this valid ?
thank u

Is DBX going to grow beyond 20.84 on Monday?How to interpret the triangle and overall lows and highs?

What would you do? Sell or Hold? Wait for earnings then sell?Hey guys
Would you sell or would hodl it let me know?

The PATTERN series: What happens next?Each price point is to every low from Jan - Dec of that year.
Dec - Jan is missing on purpose, it also is highlighted on the chart with circles.
Using your skills of analysis and prediction, what do you think happens next?

EURJPY W forming up or continuation?Even tho we are overall Bearish, i think that the momentum could have died.
On the first inner trendline we did form an M in fact, but just over we have the monthly level, thats why I choose to stay out, we previously formed a W after a huge bear push, but not just after a trendline
Right now the price is failing to make lower lows and respect the lower counter trend, so are making the 2nd pont of a bigger TF W, or making the low of an M to continue the trend, but im leaning towards the first option due that we are un a very low area and big support.

Stop Loss Help PleaseThis video is asking questions around the numbers on the stop side of a long position tool that TV has and how the amount number in the red changes in a strange way. please view and comment. thank you

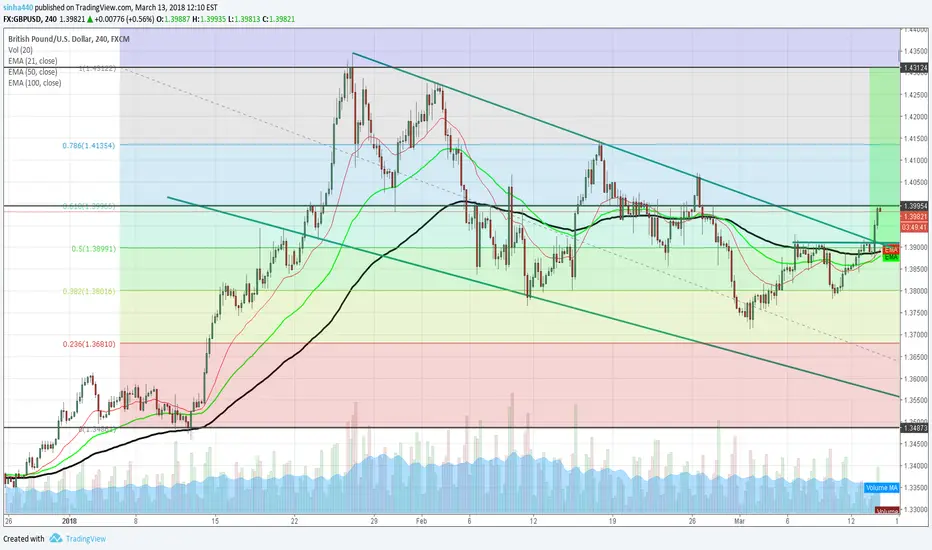
GBPUSD Nice trend breakout what do you think will it go further to above 1.43124 ? GBPUSD Nice trend breakout