Z1P BIG PICTURE 2021 #2 60$ TargetPure speculation based on historical chart patterns. and for fun only
Rally

Bitcoin: This could be over sooner than we expect.Well bitcoin just won't correct.
No large correction whatsoever. I would have liked for an ABC type correction to occur, but no, it just continues pumping.
So what does this mean?
Well, Stoch RSI is healthy due to the last correction, it was enough to let StochRSI fall down from overbought.
An overlay with the 2017 rally shows, that we could already be very near the end.
If true, I expect mediocre dumps at the end of February, maybe down to 38k the lowest, and then one gigantic insane run the whole
of March, up to the peak of about 200k in late March or early April.
Yes, this sounds insane now, but look at the past rallies. In the last weeks, it grew more then in the months before that. This is where the
most action happens, so a x4 until early April is possible.
The altcoins will go berserk at, or shortly after the bitcoin top. Normally they peak 1-2 weeks later, some even 3-4 weeks later.
But not more. This could really end like this, I find it bizarre, I don't really like it, but hey, what can we do. Bitcoin does what
it likes. And we have to adapt.

NEXT RALLY OF ETHI strongly believe eth will copy the pattern of the last weeks action. And of corse these are not financial advice. :) Good luck.

Rally Base Drop PatternThe makert has been following a RBD structure and once it reaches the base it will make a reversal

BSV/USD is approaching 325$ again. Since this is a bull run in the whole market. It seems they a test and break past 325$ is probable. Last time bsv/usd went past 325$ to 325.200$. So it might go over it. Or it might drop and ruin all our coming weeks lol. I don’t suggest buying right now. It’s too risky anytime news can come out and turn it around. Too many court cases out there.

Can the previous resistance become the new support?Resistance has clearly been broken. After the weekly rally a pullback is normal, so the real question is whether this resistance can become support and if we can accumulate enough power to continue reaching towards the new all time highs. In my opinion, yes - people that got burned in the previous rally towards 42k and entered too late will have their chance at breaking it again and people that cashed out and re-entered after the pullback will do the same while the rest who held will keep on holding. Everyone; let's continue towards the 100k!

Byte Coin Spike / Fork - Road to 0.04 +This can be a 100+x coin, ATH 0.04 cent. This can be a good opportunity!

Psychedelics rally coming upBuy Case :
Increase demand for mental health services COVID indirect impact.
New and Innovative way of tackling depression and other mental health disorders and mental issues.
Correction from the high and expecting little consolidation around the price points mentioned in the chart
Any ideas and comments are welcomed!
Thanks in advance!
Together, we stand strong!

DOGECOIN BIG PUMP INCOMING - FINAL ACCUMULATION STAGEDear Traders,
Everything is on the chart.
Dogecoin is going to have a massive rally like the one it had in 2017 which started 238 days after the bitcoin halving of 2016.
If we analyse price structure it has lately behaved like the 2016-2017 pre-pump.
We've been lately trending down (-30º) to the historical level of 15-16 satoshis which is a good point for accumulation.
238 days have nearly passed since the last bitcoin halving of 2020.
We are accumulating at this levels like on october-november 2017 (Purple box).
RSI has already given the buy signal.
MACD is about to give the buy signal too.
Targets:
T1: 0.00000060 Satoshis
T2: 0.00000080 Satoshis
T3: 0.00000100 Satoshis
Stop-Loss:
SL: 0.00000015 Satoshis
I wish you a happy new year!

Is Bitcoin going to 50,000?? 🌟If you're following my profile, you use to see my chart as they are so neat and clear.. But this one is so different.. Because I made a complex analysis on BTC, so I'm trying to give all those information to you on the charts and the texts below, so let's focus together and start the analysis..
Before this analysis, As you can see on the chart in the red box area, I was getting ready for a bearish scenario for BTC and the correction to continue it's move to 28,500 - 30,600 or maybe deeper targets around 21,000. But some how I suddenly saw this triangle pattern on 4H chart. And it ruined all my previous analysis..
I believe this is a valid triangle because it has 3 touches on the bottom and 2 touches on the top.. The price has passed 60% of the triangle time-line pattern, so I'm waiting to see a breakout form top or maybe bottom..
Let's check out what is happening inside the triangle.. We have two bullish waves inside and the third one is starting. On the other side we have correction / bearish waves.. If you check the candle stick counts you can easily understand new buyers are coming to the BTC market inside the triangle, that cause the buyers to be more stronger that sellers.. So this emotional thinking can make us come to the conclusion that it is more possible for BTC to break the triangle upwards.. Don't forget this is not a valid signal!!! It's just a sign that buyers are getting stronger in the market..
Let's consider the last bearish wave in the triangle as a descending channel or a flag that it is trying to break the upper side of the flag in the time of writing this idea.. if this flag has a upward breakout, we will see a break out for the triangle on January 18 or 19. I've highlighted this area for you on the chart.. This will be an important moment.. If the breakout happens so strongly with high volume we can expect some retest on the upper side of the triangle as our new support area.. Then our new Bullish movement is begun..
I've drawn all the way the price will go on the chart with a green arrow, as you can see.. After the retest, as we spoke, our next main target will be 1 Fib extension area around 45,000$, Then I expect some corrections around previous ALL TIME HIGH around 41900.. I see this movement as a rally not a normal uptrend because of two reasons. Firstly, the previous bullish trend before the triangle was a rally. Secondly, Joe Biden is going to be the US president on January 20 and he has said that he will sign the aid checks for American people, these points will give me enough reasons to come this conclusion that the USD is going to fall in upcoming days and weeks and BTC is going to have an upward rally..
I have two more Targets for this BTC rally..
Triangle height from the breakout point.. I put the height line on the January 18 for now, That will give a target around 51,500$. But I will update this target when the actual breakout happened so don't worry about it..
My other target will be the 1.618 Fib level around 49,500$.. So I drew a green box are for you on the chart, That is showing this is a possible target for Bitcoin.. As I said, I believe in a rally up a head, The intersection of the green box area and the rally line copied from the previous trend line will be my estimated time for BTC to hit the area, That will be first quarter of February..
I'll update this chart and idea if anything new happens to the market in following days, so make sure you are following my profile, in that case you will not miss the updates..
I tried to explain the chart as simple as possible, But I may have missed some points. So feel free to ask any question if it comes to your mind or add any ideas you have in the comments section. I'll be glad to see new ideas.. This will make all of us more powerful together in TradingView Community..

USD/CAD - Support held and bullish rally to continue?Yesterday we saw price testing our marked support level at 1.2650. We've seen this level hold and buyers takeover today with a strong looking bullish candle so far. Will price rally up to our top trendline and see a potential breakout?


Will Bitcoin Bullish Rally Continue?Hello, dear subscribers!
Let's take a look at current Bitcoin price action. We can see that the Head and Shoulders bearish scenario was cancelled becauce the neckline area was not broken.
There was also the danger of dead cat bounce scenario that could means the end of bullish rally but the price was able to find support above the 61% Fibonacci level according to swing high and low. This bearish scenario was also cancelled.
Now we can see that the price faced with the rejection exactly at the 78% Fib level but it is normal situation. If the price break through the 78% Fib the next rejection will be at ATH level, but now according to this analysis we can see that there is a high probability of bullish rally continuation and we can see the $44600 (R3 monthly level) during next week.


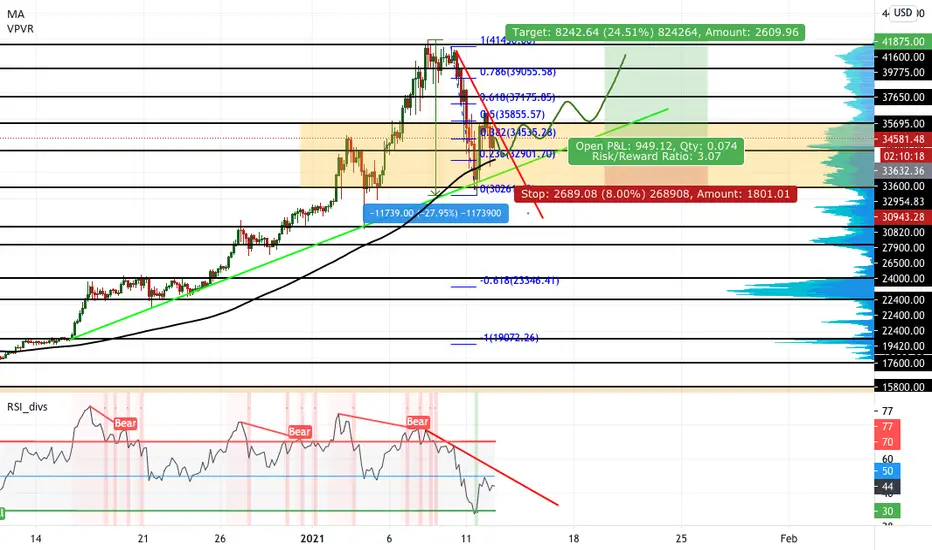
BTC/USDT - current formation - potential 25% setupHello, Traders!
After an exponential surge and a final rally to $42,000, Bitcoin's price has corrected 27.95% from the high.
The current correction is the strongest of the entire trend from $10500.
So far, the price has tested the uptrend and the buyers have held the trend.
The struggle between sellers and buyers is taking place in the range of $30820-35695.
It makes sense to join the uptrend and search for a buy position after :
1. Re-test the price level of $33,600.
2. Exit of the price from the local downtrend (including the indicator RSI).
If the price reaches the level of 30820 $ closes the purchase by stop-loss.
The objectives for our position will be local levels
$35695
$37650
$39775
$41600
Watch out for the market and good luck!
P.S. This is not a piece of financial advice but only a trade I would be following myself
LONG GTII Been long for two years always adding to this great MSO
I believe we will see a new ATH very soon.
GL

It's Time For Ethereum ✨✨✨Hello again folks, I hope you enjoyed your holidays and listened to my advice to get some rest because we're going to have an exciting year in crypto markets. Let's start with Ethereum extraordinary movement ahead..
ETH had a rally from 730 to 1280 and after that it went into a resting phase for around 2 weeks..
The good news is this resting phase is broken with two strong candles in 4H chart and it's trying to retest the previous consolidation channel.. As you can see in the chart it's our smart option to start our buy/long positions here in this area of pull-back..
You can see the way I analyzed ETH will move throw the targets with the green arrow.. the next rally is starting now.. So check the targets on the chart.. I want to read your comment about the idea and feel free to ask me any question about my analysis..
Buy at: 1240 - 1290
Stop-Loss: 1055
Target 1: 1393
Target 2: 1680
Target 3: 1770
Target 4: 1960

TESLA LONG position entry levels TSLATSLA stocks experienced a huge BULLish run. But be aware because we have a GAP at Tesla chart that should be closed. This could cause good possibilities for BUYERS. I still hope for a bigger correction.
Here you have entry levels to jump in:
$814
$780
$653
If TSLA stock breaks $900, then buy with pullback with $1000 target. Volumes are still solid.

"Conservative" targets for the bitcoin target in this rallySo let's take a look at some BTC price targets, according to the longterm trend.
If we continue this rally straight on without correction, the moving resistance would be at around 100k.
If we correct, and follow a path like in 2017, the target will be higher, around 120k.
If we do a 2013 style repeat, we'd see the top in Dec 2021 at around 140k.
Of course, we could also overshoot the resistance, there is no law that says that this is a magical barrier.
In that case, the target would more likely be around 300k. We shall see how BTC reacts at this major curved resistance line.
The weekly Stoch RSI and RSI are both brutally overbought, so a larger correction is only a few weeks away maximum. But of course,
in that time it could shoot up to 100k, that would be possible. So we'll have to wait and see now how BTC behaves.

Bitcoin: Why Doom Might Be Upon UsBitcoin's record-breaking growth has gone far from unnoticed. It took a mere 18 days to go from the last ATH of $20k to the most recent one of 34.7K.
Today, the weekly RSI is displaying a strong downward turn after a record value of 94.5, severely overbought. To see what is next, we will take a look at the 2017-2018 market rally. Here, the RSI was strongly overbought (>80) on several occasions. Every occasion led to a short term sell-off of around 38% on average. Seeing that we didn't have a sell-off yet after the RSI displayed values of more than 80, now might be the time.
Assuming Bitcoin will drop 38%, the price might drop to $22k, potentially hitting the strong support at $20k. After the RSI drop, Bitcoins value rallied most of the time, so waiting for the RSI to cool off might be a great investment opportunity in the long term.

BTCUSD - The rally continuesI can see BTCUSD coming to grab some liquidity below the 50% fib level as illustrated on the chart. Buyers still very much in control of course, so I will be looking for buy entries around this level if price reacts the way I predict.
Not normally one to focus on crypto but the start of the year has been crazy and there really seems to be no ceiling at the moment for where they can go, especially with the weakness of the dollar surely playing its part.

Bitcoin Next Projected Rally, (Last Time To Buy Below 10K?)Please share your thoughts and opinions. If you have any questions please feel free to ask.
Above is my projected estimation of the next Bull Market.
I will be executing a buy on or around March 26th 2020
From that buy I will be Holding my Buy until October 13th 2020 (TBD By Future Analysis)
Stop Loss will be set at or around $4,200
Take Profit $18,000 (TBD By Future Analysis)
***I am not a FINRA registered agent or broker (As of Yet) and this is not financial advice, Please always do your own research, As Bitcoin is a highly volatile asset.***

S&P Analysis Week of 12/20/2020: Wall Street Naughty or Nice?We've made it to the last two weeks of the year which has traditionally been called the 'Santa Clause Rally' because markets tend to rise during this time (usually because of low volume).
Will we see a 'Santa Clause Rally' this year?
The first thing that really sticks out in the chart is that we are in a strong upward trend. The trend is your friend until the very end. I would not be quick to short this market until that trend line is broken.
How many people were whiplashed last week trying to short. Friday was a good example of how easily and quickly price can bounce off the lows during an uptrend. It's hard to kill a bull.
Here are the trade setups I see:
Trade Setup 1 (long): Wait for a break above the final resistance line (3720) with a retest and we are going higher.
Note: For those that want to be aggressive. Price technically broke out above 3700 with a retest last week and is starting to make a higher high. You wouldn't be wrong if you decided to take the trade as soon as price goes above 3720 without a retest since there was a retest just below at 3700
Trade Setup 1 (short): Wait for a break of the strong upward trendline (with retest). To be safe I recommend waiting for both the trend line and the strong support at 3642. Be very careful trying to short. I'm primarily looking for a long trade this week so I probably won't take this trade unless I see some strong selling taking place. Not the small dips we have been seeing that get bought up the next day (or even same day).
Never play the breakouts, wait for the retest. In my experience, 90% or more of the breakouts result in a retest.
Happy trading and Merry Christmas!
