AMD: Key Reversals, and Short-Covering RalliesAMD has been in a bear market since December 1st, 2022. For those of you who took a short position, you have had to endure three major short-covering rallies. The first short-covering rally which began on December 12th may have made you reconsider your decision to short in the first place, and you probably got out at some point. But when is the best time to get out and possibly go long? Identifying key reversals can be helpful in these situations.
In a bear market, a key reversal is when the price makes a new low but closes on or near the high (the opposite is the case in a bull market). A bar chart can help you see this better. I've placed black arrows under the obvious key reversals on the daily chart. The orange arrow shows a key reversal that may not fit the definition exactly since the price closed just above the middle and not very close to the high.
These rallies only lasted a couple of days each, and since the key reversal can't be identified until the end of the first day, the opportunity to make gains with a long position only lasted one day.
An opportunity to go long has just presented itself on January 6th with a key reversal. I'm expecting a rally on January 9th. The question is, will this rally continue to the upper resistance line, or fizzle out in a day or two and retest the support it bounced off? I'll be watching.
Disclaimer: I am not a financial advisor, and the above statements are not investment advice. My comments are only intended for educational purposes. You are solely responsible for your own trading decisions.
Rally

$360K BTC in 2023 if we are in a similar type of rally like 2017The title says enough. We might be in a similar type of rally like we had in 2017, which means that you won't be getting any chances to buy lower after corrections. 12 Jan 2023 is when BTC began pumping, just like in 2017, I have used the bars pattern from that period, that pump lasted until a blow off top in Dec.

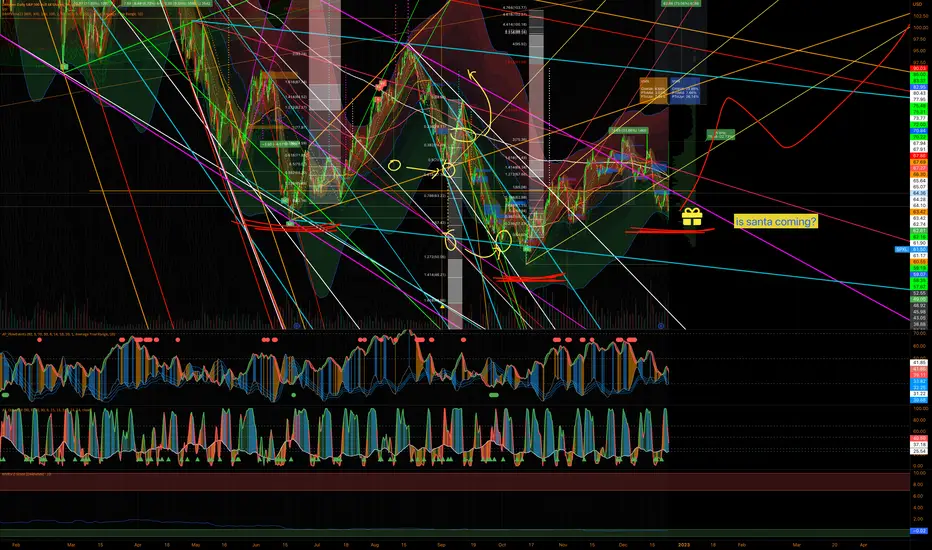
RUT Russell 2000 Santa Rally U.S. stocks tend to rise during the Santa Claus rally period.
The Santa Rally is considered the last five trading sessions of the year and first two of the new year.
Since 1950, the S&P 500 has traded higher 78% of the time during the Santa rally period for an average gain of 1.3%.
My price target for RUT Russell 2000 is $1860.
Looking forward to read your opinion about it.

BITCOIN Will Have a Correction Before Going Back BullishHello Bitcoin traders,
Bitcoin has been very bullish for the past two days, but always be ready for a correction because many signals show that it is still overbought (see my previous post for 4 signals).
With the Fibonacci Retracement, we see many moments where the principal lines served as support or resistance for the price. The price has now reached the "Golden Pocket" where reversals often happen.
We can expect the price to have a slight to medium correction before continuing its bullish rally.

Just .. a bear market rally... Weird i have heard that before ;)It seems to me that the overall sentiment of the market environment is currently that you should not buy into this pump as it is just a "bear market rally", the entire year of 2022 I have not heard that term thrown around at all, only now to resurface in this rally.
I think the market has experienced a lot of pain and is now trying to justify that we are still in this aggressive bearish downtrend. To ME this is the DIisbelief stage of the bear market.
Let me know your thoughts

4 signals shows that BITCOIN is overbought.In this chart we see many signals that indicates that Bitcoin is overbought and that the price will soon be corrected and go back down.
- A trendline connected 3 corrections, but then the price rallied, thinking it doesn't has to come back to the trendline, meaning it is too bullish and is overbought.
- Candlesticks broke above the Bollinger Bands (BB), meaning there is an upcoming reversal.
- RSI is above 70 (=overbought)
- Bollinger Bands %B is above 1 (=overbought)
Using the TBS Strategy, consider selling when the BB %B crosses down.

Rally into 2023? Likely rally into 2023, spurred by downward trend in inflation. Likely 25bp hike at next meeting, then full stop to evaluate the damage (and give time for lagging economic data to catch up to policy changes). Unemployment will rise, possibly some deflation, and fed will cut rates towards the end of 2023 in response to negative economic data. This will cause a second drawdown. Well, the rates will be correlated with a second drawdown, but the real correlation will be between the negative data and equities.
My initial thoughts as we move into a new year. Should be an interesting one.
Love,
InTheMoney

QQQ Nasdaq 100 ETF Santa Rally U.S. stocks tend to rise during the Santa Claus rally period.
The Santa Rally is considered the last five trading sessions of the year and first two of the new year.
Since 1950, the S&P 500 has traded higher 78% of the time during the Santa rally period for an average gain of 1.3%.
My price target for QQQ Nasdaq 100 ETF is $273.
Looking forward to read your opinion about it.

ETHUSDT: Support at $1.3k according to the Fibonacci RetracementIn this ETH/USDT chart, we use the Fibonacci Retracement to look at resistance and support levels and try to predict what will be Ethereum's next move.
We see resistance at 0.65 (price at 1.7k), 0.786 (price at 1.8k), and at the "GOLDEN POCKET". What is the Golden Pocket? It is an area between 0.618 and 0.65 where significant reversal often happens, and in Ethereum's case, we see that the price dropped all the way from 1.7k to 1.1k in only four days after reversing in the Golden Pocket.
The price also received support at 0.5 (price at 1.5k), 0.382 (price at 1.4k), and especially at 0.236 (price at 1.3k). Following these observations, we can expect the current price to use 0.236 again as support before rallying at least to the nearest resistance 0.382.
Also, pay attention to the Relative Strength Index (RSI) to see any overbought signals (ETH is overbought if the RSI goes above 70. The market will then correct the price shortly by bringing it down. However, if the RSI oscillates between 50 and 70, it is a sign of a healthy bullish trend).
Yanak

BTC will rally to $56K in the coming 4 monthsI know this is a bold statement to make, but the bottom for BTC is in (beautiful double bottom) and a rally to $56K is imminent, bears are about to get rekt as BTC is going to rally to near its all time high price in the coming months, but it won't make a new all time high just yet, as we are in the four year cycle, this is just a retracement.
The bottom for BTC was in Nov 2022, while the bottom of the last cycle was in Dec 2018, thus this time we are one month ahead, the top of the current four month rally will be in May 2023 instead of June like the last cycle (2019).
We will break out of the bullish falling wedge to the upside very soon in the next 10 days, and we won't stop going up until the end of May, so if you are a bear and you don't want to FOMO, you will have to have patience for a very long time before the prices come down again to the current levels, in the coming months, every time you think the prices are coming down, it will go up instead and test your patience severely.
Buckle up boys and gals, we are going to the moon, soon.
Inshallah.

Is the Bottom in Bitcoin In?Interesting chart showing potential new up-trending channel for Bitcoin.
To me, it looks and 'feels' like the bottom is in, coupled with an Alt-coin rally, as the AltPerp Index is showing clear signs up trending up.
Also ETH.D is holding the line in it's uptrend that started back in Nov of 2019, and USDT.D which is inversely correlated to crypto prices, is breaking down below a key trendline support.
At the very least, we have a tradeable bottom forming and looking very good to me here.
On the other hand...
A Gemini collapse, or sudden dumping of BTC by Greyscale to bail out bankrupt parent company Digital Currency Group and Barry Silbert, could still send us lower like FTX part II.
New information = new decision.
But as I always say 'Show me the chart, I'll tell you the news"
And the charts are telling me that all the contagion has been priced in, and money is starting to flow back in here.

NASDAQ 100 Rally Despite China Woes and Auto Weakness?The NASDAQ 100 (cash chart) could bounce up from the 61.8 Fibonacci retracement (daily chart).
In this case, a rise of 5-10+ % could be possible.
In the chart, Fibonacci retracement levels have been plotted from the Covid low in March 2020 to the all-time high in November 2021.
This is just an idea. Do not trade it! Do your own research and make your own decisions. You are solely responsible for your trades.

And gold the rally ends..Gold has failed to break its previous higher high against the dollar. Combine that with the fact it just broke its fib support level and lower high breaks, a good short entry is seen.

SPY Cycle Patterns For 2023Here we go. Starting out 2023, my SPY cycle patterns show a solid RALLY phase sets up on Wednesday/Thursday.
Time to get ready for a strong reflation trade to start 2023. Possibly breaking above resistance channels and rallying to NEW ALL-TIME HIGHS.
Follow my research.

X-MAS Rally Possible?A weekend X-MAS rally is possible but look for a strong bearish pullback to quickly follow.
>200 MA look for support before NYSE close
> Rally can be as high as 16960
>4 hour chart is used for analysis 1 day chart shows a bullish signal.
This is a risky trade more than likely a bull trap, but if you have an active position take the above into consideration.

after finished the first inverted head and shouldes...we just finished the first inverted head and shoulders pattern, should we see the big one?
Santa Claus rally 2023?Can we get a rally this year ?
looking at the Spy to see if we can get some clues. What about dxy?

SPY 2022 SELLERSIs this just another bear market rally? Saving this chart to keep an eye on this idea.

LINKUSDT LONGSo on LINK on the 15 minute timeframe a nice LINK entry appeared. The most recent contraction on the 4 hourly chart was on the level of 6.895, and this area could act as a value line.
An Uptrend has begun on the Super trend indicator and there is also an double bottom, Perhaps it can touch the value line again?
TP1: 6.265
TP2: 6.485
TP3: 6.703
TP4: 6.895
SL: 5.790

Huge BTCUSDT Falling WedgeOn BTCUSDT on the daily chart there is a huge falling wedge. Bitcoin also rejected a weekly key level of 18.3k USD. It's good to keep this in mind for the next days and weeks, I feel like a small rally in this bear market could happen.

Volatility Rally | Major Demand ZoneThe Volatility Index (VIX) has been in a historical downtrend the past weeks / 2 months! VIX has also been moving abnormal in relation to the S&P 500 Index which it tracks Volatility in.
The Volatility Index has sunk to a major demand zone, and is now breaking back out of the area.
After hitting Lows of around $19 the VIX is breaking out upwards. We are seeing a dump in the markets from major S&P Bear Market Trendline as well.
Bears are stepping in at these levels in the markets, and the volatility index is rising, signaling further downward movement coming in the market.
Simply put, the Volatility index is breaking out from its Major Demand Zone, and generally if history repeats will rally up to the supply zone up around the $30 level. This has been a typical swing move in the index since the beginning of 2022.
Reasons VIX looks bullish :
- TTM Squeeze (Daily & Weekly)
- Reclaimed Daily EMA Cloud
- Market Rejecting Major Trendline (S&P)
- Cup & Handle on VIX (1hr / 1D)
- Double Bottom
- Market Greed
- CPI & FOMC coming up
How to play :
$UVIX commons
$VIX option calls
etc.
There are multiple reasons Volatility is rising currently, and Technicals back this thesis up strongly.
I hope you liked the though!

TSLASelfdrive PART DEUX - Area of ValueI missed this earlier, thought it important to repost this idea, inverse H&S (HAS NOT FILLED OUT YET) potentially forming... I will watch this chart closely and look for entires above neck line for sure, perhaps get a bit crazy and enter before neckline fills.. Let me know your thoughts in the comments below!!
Keep in mind friday Dec 9 PPI news 830am as well as Consumer sentiment. after 4 red days in a row probabilities of a green are high. expecting green Friday but looking to see this H&S fill out after breakout of descending triangle and retest. This is a good area of value
Trade safe and have fun!

Advance Micro Devices (AMD) to reach 70 by November 22I'm going out on a limb again, only because it motivates me to stretch the limits of my analytical skills.
As I was perusing my watch list last week, I noticed that AMD seems to have reached a support level of 56.
I've zoomed out on the daily chart to show you the huge downtrend AMD has been following for the past 12 months.
If the price continues to oscillate downwards in this slowly narrowing channel, it stands to reason that the price should rally to 70-73 by the end of November as it tests the previous support level that has now become the new potential resistance level of 73.67. It could even reach 78 if it continues to touch the top trend line.
It's not obvious while zoomed out so far on the daily chart, but the intraday price moves taking place with AMD are insane. I bought AMD on October 28 pre-market, with the expectation that the price would rally, but I didn't know it was going to rocket straight up for a 1:6 risk-reward ratio. This is the advantage of pre-market trading. It's easier to board the rocket when it's on the launch pad than it is when it's lifting off.
Disclaimer: I am not a financial advisor, and the above statements are not investment advice. My comments are only intended for educational purposes. You are solely responsible for your own trading decisions.
