Gold can break support level and continue to declineHello traders, I want share with you my opinion about Gold. Observing the chart, we can see that the price a not long time ago started to trades in the range, where it some time traded near the support level, which coincided with the buyer zone with the bottom part of the range. Later Gold fell to this level again, but at once rebounded and rose to the top part of the range, after which the price made little correction and then backed up. Next, the price reached the mirror line, after which XAU made a strong upward impulse to the current support level, thereby exiting from the range and breaking the later mirror line. Soon, the price broke the 2320 level too and reached the mirror line too, but at once Gold rebounded down from this line to the 2320 level, which coincided with the support area. But recently price bounced from this area and rose to 2430 points, which coincided with the mirror line and at once turned around and in a short time fell back. At the moment, Gold trades near this area and I think the price can fall to the support level, and break it, after which Gold will retest. Then price will continue to decline, so I set my 1st TP at 2270 points. Please share this idea with your friends and click Boost 🚀
Range

OPUSDT. The seller has reached their goalsIn educational article some week ago, I wrote that most financial instruments spend more than 75% of their time in this sideways market mode. So, knowing how to trade in sideways markets is a important skill for traders and investors.
I highlighted 5 skills that help effectively trade in sideways markets. Discussing the first of them - how to combine the higher and lower timeframes when looking for trades, I provided a practical example on the OPUSDT chart using the daily and hourly timeframes. Quote:
On the daily TF, we observe sideways movement since December 22, 2023, with the bearish vector (11-12) being relevant. The first target of the bearish vector, 3.119, was reached on March 19, 2024. The second target (2.822) and the third (2.611) remain valid
The seller has reached their goals.
Currently, the price is below the lower boundary (2.611) of the sideways trend on the daily timeframe. We haven't seen any buyers yet - there's no bullish candle.
It is advisable to look for buying opportunities when the buyer brings the price back into the sideways trend. Sales can be sought from the defense of the seller at the level of 2.611.

EURUSD. Medium-term analysisOn the weekly timeframe, we have a sideways market. The current short-term trend vector is 5-6

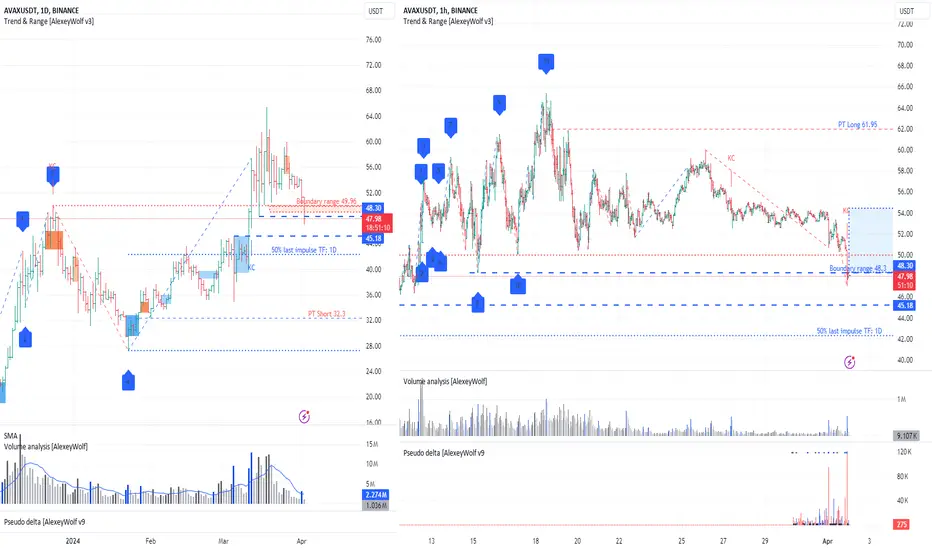
AVAUSDT. We have context for both selling and buying. It's an interesting situation. We have context for both selling and buying.
On the daily timeframe, there's a sideways movement (upper boundary - 49.96). The price has now returned to it, but the daily candle has not yet closed. If the daily candle closes inside the sideways movement, then we can look for sales, and the bearish vector 5-6 with a target at 32.3 will be relevant. There are two threats for the bears along the way in the form of buyer zones (blue background). The first one is at 48.3, which is currently being interacted with. The second threat is the buyer zone with the upper boundary at 45.18.
On the hourly timeframe, the price is at the lower boundary of the sideways movement (48.3). The bearish vector 11-12 has played out. The launch of the bullish vector 12-13 with a target at 61.95 is possible.
In summary, the daily and hourly buyer levels coincide (48.3). If the buyer shows itself at this level, then we can consider buying, taking into account the seller zones on the daily chart (red background). If the seller defends the breakout of the level 48.3, then we can consider selling, taking into account the daily buyer zone (upper boundary 45.18), inside which, by the way, lies 50% of the last daily buyer impulse.
For a more detailed explanation of how to read charts and consider different timeframes when looking for trades, you can refer to the article
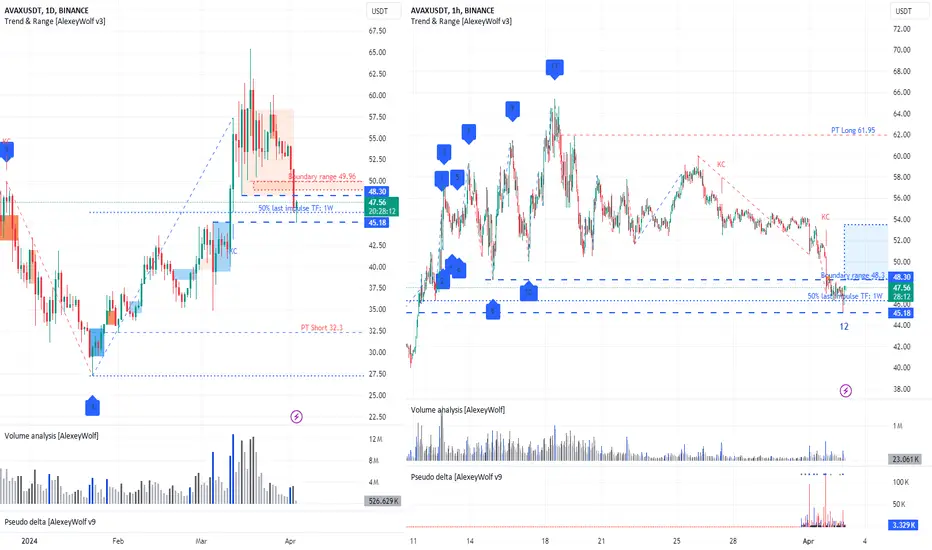
AVAXUSDT. On the Daily timeframe, selling takes precedenceOn the daily timeframe, we see a sideways movement with the upper boundary at 49.96. The price has been above the upper boundary for the last 20 days, but yesterday it returned to it and stopped at the 50% level of the last buyer's impulse on the weekly timeframe. This is clearly visible on the hourly timeframe:
At the top, a seller's zone has formed with the upper boundary at 48.3 (red background), and at the bottom, a buyer's zone with the upper boundary at 45.18 (blue background). I anticipate price interaction with the seller's zone of interest. If the seller defends the range of 48-50, we can consider the possibility of sales, and the bearish vector 5-6 will become relevant with a target at 32.3. However, on the way to this target, sellers may be hindered by the buyer's zone, with which there was just interaction and a bullish reaction began, as clearly seen on the hourly timeframe.
On the hourly timeframe, the price is below the lower boundary of the sideways movement at the level of 48.3. The bearish vector 11-12 has already played out, and we can expect the launch of the bullish vector 12-13 with an ambitious target at the level of 61.95 (ambitious, because the buyer will have to overcome the seller's zone on the daily timeframe). To launch the bullish vector, the buyer needs to raise the price above the range of 48-50 and protect it.
For a more detailed explanation of how to read charts and consider different timeframes when looking for trades, you can refer to the article
BTCUSDT. Monitoring the seller's actions.Hello traders and investors!
It's time to update the forecast. During the last review (23/03/2024), we observed a short vector 7-8 within the sideways movement on the daily timeframe. The target of the long vector 8-9 was 72419 (see the chart from the previous review). Currently, the long vector 8-9 has reached this target.
It is advisable to look for sales at the upper boundary of the sideways movement. However, for short positions, the first threat is the buyer zone (blue color) with the upper boundary at 69674, which formed on the daily timeframe. And the seller has not yet shown itself on the hourly timeframe - the price at 17 hours is near the level of 72419.
There is a high probability that the buyer will reach the upper boundary of the sideways movement at 73777. I am waiting for a reinteraction of the price with the level of 72419.
For a more detailed explanation of how to read charts and consider different timeframes when looking for trades, you can refer to the article

BTCUSDT. Short term analysisHello traders and investors!
On the daily timeframe we see a resumption of buyers from the buyer's zone (blue background) with an upper boundary of 69674.
On the hourly timeframe, a sideways trend has formed, where the buyer's vector 4-5 has already reached the obligatory target. Searching for sales is risky because there is a resumption from the buyer's zone on the daily timeframe. It is not systematic to look for purchases at the upper boundary of the sideways.
It is better to look for purchases at the lower boundary of the sideways trend, for example, from the buyer's protection levels at 69071, 67518.
Sales are advisable to look for below the level of 67518 as an idea for implementing the seller's vector 9-10 of the sideways trend on the daily timeframe with the first target at 64493 (second - 60775).
As before, I am waiting for a repeated interaction of the price with the level of 72419.
By the way, purchases could be found yesterday on the 30-minute timeframe (see the chart).

ETHUSDT. Looking for purchasesOn the daily timeframe we have a sideways market. The bearish vector 5-6 has been played out. The price has already interacted with the level of 3200. Priority is given to considering purchases, preferably from the zone between 3200 and 3400, with the initial target at 3722.

ETHUSDT. Monitoring the seller's actions.Hello traders and investors!
It's time to update the forecast. During the last review (22.03.2024), we observed a short vector 5-6 in the sideways trend on the daily timeframe. The target of the long vector 6-7 was 3722 (see the chart from the last review). Currently, the long vector 6-7 has reached this target. At the top, there is a seller's zone with a lower boundary of 3722 (red background). So far, we haven't seen any reaction from the seller in this zone.
It is advisable to look for sales at the upper boundary of the sideways trend. However, for short positions, the first threat is the buyer's zone (blue color) with an upper boundary of 3505, which formed on the daily timeframe. There is a high probability that the buyer will reach the level of 3822.
On the hourly timeframe, a sideways trend has formed with boundaries of 3727 and 3665. I am waiting for the price to interact with these boundaries. We can look for a trade opportunity based on the protection of these boundaries.
For a more detailed explanation of how to read charts and consider different timeframes when looking for trades, you can refer to the article

Ripple can continue to move up inside upward channelHello traders, I want share with you my opinion about Ripple. By observing the chart, we can see that the price not long time ago price declined to the seller zone, which coincided with the 0.6585 resistance level and soon broke this level, after which XRP started to trades in the range. Then price in a short time fell to the buyer zone, which coincided with the bottom part of the range and soon made impulse up to the seller zone, after which turned around and started to decline. Price declined to the 0.5880 level, and broke it, thereby exiting from range and even fell below the buyer zone, after which Ripple turned around and started to rise in an upward channel. In the channel, the price soon broke the 0.5880 support level one more time and later reached the resistance line, but then made a correction movement. After this movement, XRP rebounded and continued to move up in the channel, so, at the moment I think that Ripple can make a correction move to the support line and then rebound up to the resistance line of the upward channel. For this case, I set my target at the 0.6350 level. Please share this idea with your friends and click Boost 🚀

Bitcoin can reach resistance level and then rebound downHello traders, I want share with you my opinion about Bitcoin. Observing the chart, we can see that the price some days ago rebounded from the support line and made a strong upward impulse to the support level, which coincided with the buyer zone. After this, BTC in a short time broke the 60800 level, made a retest, and continued to move up to the resistance level, which coincided with the seller zone. Price even entered to seller zone, but soon turned around and declined lower the 71250 level, making a fake breakout. Also then price started to trades in the range, where firstly it broke support line and fell to the support level. Then Bitcoin rebounded from the 60800 support level and made impulse up to the seller zone, but when it reached this area, the price at once exited, making a fake breakout of the resistance level. Next, the price some time traded near the resistance level and then declined below, but a not long time ago BTC turned around and started to grow, so now it trades near the 71250 level. Now, I think that Bitcoin can reach a resistance level and then rebound down. For this case, I set my 1st Take Profit at the 65000 level. Please share this idea with your friends and click Boost 🚀

EUR/USD Week 14 Analysys/OutlookTime dive into the whirlwind that was Week 14 in the EUR/USD market.
Last week was nothing short of intense, with each trading day bringing its own set of surprises and challenges. Despite the rollercoaster ride, the overall price range remained relatively stable compared to the previous week. It's fascinating to see how the market dynamics played out amidst the volatility. When we look at the order book, it's clear that both buyers and sellers were actively engaged. Buyers were eager for lower prices, while sellers seemed content with slightly lower values for profits, compare to initial volume levels.
Now, let's talk about resistance levels. Bears had set up some formidable resistance in the order book, but as history has shown, Bulls have a knack for breaking through even the toughest barriers. Looking ahead, while we may not see significant changes in the overall price range, I anticipate some fluctuations within that range. It's all part of the ebb and flow of the market. On a longer-term basis, the market has shown remarkable stability since January 15th. It's a testament to the underlying trends that have been driving the market.
So, what does this mean for traders? Well, there's no one-size-fits-all answer, but strategies like grid trading and trend-following could prove fruitful. Of course, proper risk management and strategy testing are crucial. So, while last week may have been exciting, the name of the game is slow and steady profits. It's all about consistency in the trading world.

Ethereum can make small move down and then rebound upHello traders, I want share with you my opinion about Ethereum. Observing the chart, we can see that the price a not long time ago declined to the current resistance level, which coincided with the support line, and at once turned around and started to move up near this line. In a short time later ETH reached a resistance level, which coincided with the seller zone and broke it, but soon price turned around and declined back to the support line, breaking the 3600 level one more time. Some time ago Ethereum reached this level again, and entered to seller zone, after which rebounded down to the 3250 current resistance level, which coincided with the buyer zone, thereby breaking the support line. After this movement, ETH started to trades in a range, where it rose to the top part, after which Ethereum turned around and in a short time declined to the buyer zone, breaking the 3250 level. But now, I think ETH can little more decline in this zone, after which it turn around and rise back to the range, where later Ethereum will grow more. For this case, I set my target at the 3360 level. Please share this idea with your friends and click Boost 🚀

Binance Coin can reach resistance level and then start to fallHello traders, I want share with you my opinion about Binance Coin. By observing the chart, we can see that the price some time ago started to trades in a range, where it first made a fake breakout of the 548 support level, which coincided with the buyer zone and then in a short time backed up. After this, BNB continued to move up and reached the 598 resistance level, which coincided with the top part of the range and seller zone, after which it rebounded and fell below. Then price made a strong impulse up, thereby exiting from the range and breaking the 598 resistance level. After this movement, BNB even rose higher than the seller zone, but when it reached the resistance line, the price at once turned around and started to fall. In a short time, BNB declined lower 598 level, breaking it one more time, and later fell to the support level. AS well then, the price rebounded from this level and started to move up to the resistance line. At the moment, BNB trades very close to this line and in my opinion, Binance Coin can break this line and reach the resistance level, after which BNB will turn around and fall below the resistance line. So, for this reason, I set my target at the 565 level. Please share this idea with your friends and click Boost 🚀

HelenP. I Bitcoin can make little move up and then rebound downHi folks today I'm prepared for you Bitcoin analytics. If we look at the chart we can see how the price some days ago in a short time rose to the 61600 level, which coincided with the support zone and soon broke this level. After this, the price some time traded near this level and then rebounded up to the resistance level and even entered to resistance zone, after which BTC reached the trend line and turned around. Then, the price declined below the resistance level and started to trades in consolidation, where BTC first fell to the support level. After this movement, the price turned around again and made an impulse up back to the resistance level, breaking the trend line and trying to break the 71400 level, but failed. Price some time traded near the resistance level and later rebounded down to the trend line, after which a not long time ago BTC bounced from this line and started to rise. Just now, I think Bitcoin will rise a little more and then rebound down to the trend line. For this case, I set my target at 62800 points, which coincided with the trend line. If you like my analytics you may support me with your like/comment ❤️

Bitcoin can continue to decline to 63100 support levelHello traders, I want share with you my opinion about Bitcoin. Observing the chart, we can see that the price some days ago rebounded from the 63100 support level, which coincided with the buyer zone, and in a short time rose to the 68000 resistance level, but when it reached this level, BTC started to fall. Bitcoin declined to the buyer zone, where it reached the support line and then at once rebounded back to the resistance level, making a fake breakout of a support level. Soon, the price reached the 68000 level, broke it, and started to trades in the range, where BTC first rose to the top part of this pattern. After this, the price bounced down from the top part of the range and some time traded near, until BTC almost reached the top part again. Then the price made impulse down to 64500 points, thereby exiting from the range and breaking the resistance level, after which it turned around and started to rise. Now, I think Bitcoin can rise to 66800 - 67000 points and then continue to decline to the support level. For this reason, I set my target at the 63100 level. Please share this idea with your friends and click Boost 🚀

INJ from a lower boundary of a trading rangeEven thou BTC is in a correction, in this macro regime altcoins should outperform. Injective has been one of the outperforming alts all thru the previous market regime. The technicals now:
- Day MACD has reversed from the oversold zone and uptrending, histogram going upward
- on the 4H TF MACD has already reversed from the oversold zone and about to cross MACD downtrend.
- lower bound of the range is at 30.23, limit order at 30 even, with strong support at 29.311

Trade in a sideways marketMain price pattern of financial instruments
So, when we talk about the price of financial stuff, like stocks or crypto, it often moves in specific ranges over different timeframes, right? Whether it's weekly, daily, hourly, or even minute charts, prices tend to hang out in these ranges for a while. Traders call this kind of price movement "consolidation," "range-bound," or simply a "sideways market."
In this article, we'll just call it a sideways market or range. When prices are stuck in this sideways action, they can break out with a sudden burst of momentum, kickstarting a trend, or they might just keep bouncing around, forming a new sideways pattern.
Let's check out the daily chart of BTCUSDT starting from October 2021. On the chart (see above), we've marked those periods where the price was moving sideways with blue markers. Since October 2021, we've spotted 7 of these sideways patterns. We label the first point of each sideways move as "1". Out of 884 trading days, the price was stuck in this sideways action for 758 days (884 - 72 - 39 - 15), which makes up about 85%. This means that throughout this whole period, you could've been looking at trades from one edge of the sideways range to the other.
Based on my estimates, most financial instruments spend more than 75% of their time in this sideways market mode.
So, knowing how to trade in sideways markets is a super important skill for traders. And for investors, understanding these sideways moves can really amp up the profitability of their investments by pinpointing better entry and exit points.
For example, right now, considering buying BABA stocks might be a good idea because the price is chilling at the bottom of a sideways range on the weekly chart.
Example1
Mastering the Skills for Successful Trading in Sideways Market
Being able to effectively trade within trading ranges, between their boundaries, requires not only a certain amount of knowledge but also the development of specific skills. Initially, one must grasp the theoretical foundations and then apply them in practice, gradually honing their skills. Let's look at the necessary skills:
Skill 1: Understanding and applying the Concept of Time Frame (TF) Interconnection: higher TF, lower TF. Grasping the context of the higher TF in relation to the sideways market TF.
Skill 2: Identifying sideways market: determining the absolute and current boundaries of the range, as well as the current direction (vector) of price movement.
Skill 3: Recognizing zones of interest for buyers and sellers.
Skill 4: Determining the presence of buyers at the lower boundary (bottom protection by buyers) and sellers at the upper boundary (top protection by sellers).
Skill 5: Adhering to risk management principles when entering trades (especially crucial for traders).
Each of these skills is based on a vast amount of knowledge that needs to be absorbed first and then applied in practice. The journey can be long and sometimes tedious. Is there a way to hack this system and shorten the time it takes to acquire knowledge, develop skills, and start trading? Well, there are options. For example, you can use technical indicators (such as RSI, Bollinger Bands, ATR, etc.) to make buying or selling decisions. Or you could completely bypass the process of acquiring knowledge and skills and rely on signals from Telegram channels or expert opinions. But what will you find there about trading in sideways market (ranges), where the market spends more than 75% of its time?
This series of articles is written for those who are ready to take control of their financial destiny, who strive to understand how financial markets work, and who want to master the skills of independent trading and making more informed investment decisions. Here you will find the knowledge and tools to start understanding what is happening in the financial markets and how to profit from it. I don't promise any magic pills or "money" buttons:).
So, let's get started.
Skill 1: Applying the Concept of Time Frame Interconnection
The higher time frame (TF) always takes precedence over the lower one. For instance, if we observe on the daily chart that the market is in a seller's zone (which is determined by Skill 3), then on the hourly chart, we need to analyze the seller's actions (Skill 4) and primarily look for selling opportunities. However, there might be a situation where the seller is inactive, and the price starts to rise due to buyer pressure (in this case, Skill 4 comes into play again).
Example2
On the provided chart, areas of seller interest are marked in red, while buyer interest areas are marked in blue. Let's examine the period from March 25th to March 27th, highlighted in yellow on the chart.
On the daily TF, we observe sideways movement since December 22, 2023, with the bearish vector (11-12) being relevant. The first target of the bearish vector, 3.119, was reached on March 19, 2024. The second target (2.822) and the third (2.611) remain valid. On March 25th, the price returned to the seller's zone on the daily chart (the red zone with the lower boundary at 3.680).
On the hourly chart, on March 25th, the price trend reached the daily seller's zone and formed a range with 7 points. The breakout from this range occurred downwards on March 27th. Therefore, in this range, it was advisable to look for selling opportunities from the upper boundary and riskily consider buying from the lower one.
Similarly, you can make investment decisions by analyzing, for example, the weekly and daily TFs.
To be continued...
P.S. This is indeed an interesting point! Despite the fact that the market spends more than 75% of its time in sideways movement, indicators and strategies specifically designed for trading in this mode have not gained as much popularity as other trading approaches. Even on the internet, including TV and trading Telegram channels, signals or analyses based on identifying sideways movement are very rarely encountered. If you have experience or knowledge about trading methods in sideways markets (including indicators), please share them in the comments!

British Pound can fall to support level and then rebound upHello traders, I want share with you my opinion about British Pound. If we look at the chart, we can see how the price some days ago it rebounded down from the 0.8575 resistance level and broke it, after which the price started to trades in the range, where it declined to the 0.8530 support level, which coincided with the buyer area. Then GBP bounced from this level and quickly rose to the resistance level, after which turned around and made impulse down to 0.8500 points, thereby exiting from the range and breaking the support level with the buyer area. But soon, the British Pound turned around again and started to rise in an upward channel, which soon broke the 0.8530 level again and reached the resistance line of the channel. After this movement, the price corrected the support line and then made a strong impulse up to 0.8600 points, thereby exiting from the upward channel and breaking the 0.8575 resistance level, which coincided with the seller zone. But a not long time ago price started to decline and fell lower resistance level, breaking it again, and now GBP trades near the support level. So, I think the British Pound can decline to support level again, after which it will turn around and start to move up. For this reason, I set my target at the 0.8560 level. Please share this idea with your friends and click Boost 🚀

Hedera ($HBAR) I am anticipating a range breakout to greenHbar is consolidating inside of a macro range and has been for 3 weeks now.
This is not a bad thing, it's good in fact. It was recently broken out of a major resistance area at 0.09 (give or take), which is major and now all price is doing is consolidating right above.
Preparation for another leg up imo.
Green is target, but expecting higher (point of breakdown area denoted to the left of the chart).
Levels above for future reference, but not relevant right now.
Cheers,
vatsik

Ripple can continue to move up inside rangeHello traders, I want share with you my opinion about Ripple. Looking at the chart, we can see how the price some time ago rebounded from the resistance line and made a strong impulse down to 0.6035 support level, which coincided with the buyer zone, thereby breaking the 0.6585 resistance level. After this, the price at once rebounded from this level and rose to the resistance line and even higher this line, but soon fell back, making a fake breakout. Also later, XRP declined below the support level and some time traded there. After this, the price turned around and made a strong impulse up, breaking the support level one more time and soon the resistance line, after which Ripple started to trades in a range. In this pattern, the price first rose slightly, then fell to the support level, after which rebounded and rose to 0.6585. But recently, Ripple turned around and in a short time declined to the 0.6035 level, after which it rebounded and started to move up. So, now I think that XRP can continue to move up inside the range. For this case, I set my target at the 0.6410 level. Please share this idea with your friends and click Boost 🚀

HelenP. I Euro can break support level, exiting of consolidationHi folks today I'm prepared for you Euro analytics. Some time ago price rebounded from the trend line and rose to the 1.0800 support level, which coincided with the support zone and soon broke this level, after which it started to trades in consolidation. In this pattern price some time traded near the support level until it reached the trend line, after which EUR rebounded and started to rise to the 1.0935 resistance level, which coincided with the resistance zone and top part of the consolidation. After this movement, the Euro broke the resistance level and a few moments traded in the resistance zone, after which turned around and fell back to range. Price declined to the trend line, broke this line, and fell below, but later it made movement back to the resistance level, after which the Euro made impulse down to the support level, where continues to trades near to this day. As well, the price one more time breaks the trend line and I expect that the Euro will break the support level and make a retest in the support zone. After this, the price can rebound and continue to decline, therefore I set my target at the 1.0745 level. If you like my analytics you may support me with your like/comment ❤️

KMB.Medium-term analysisOn the weekly timeframe we have a sideways market. The current buyer vector is 16-17.
