Bitcoin can exit from pennant and then continue to fallHello traders, I want share with you my opinion about Bitcoin. If we look at the chart, we can see how the price a no long time ago and started to trades in the range, where it rebounded from the resistance level, which coincided with the resistance area, and the bottom part of the range, started to rise to the top part. After BTC reached the top part of the range, it turned around and started to decline in a downward pennant, where soon BTC fell to the resistance area, but at once backed up to range, making a fake breakout of the 68000 level. A short time later price finally broke the 68000 resistance level, thereby exiting from the range and declining lower than resistance area, but then it tried to back and failed. Bitcoin declined to support line of pennant, after which it at once rebounded and rose to the resistance line. After this movement, the price turned around and soon declined to support line of the pennant, which continues to trades near. In my mind, Bitcoin can exit from the pennant and continue to decline. So, that's why I set my target at the 61100 level. Please share this idea with your friends and click Boost 🚀
Range

Bitcoin Cash: History Repeating Itself?Bitcoin Cash: History Repeating Itself?
Bitcoin Cash (BCH) is a fork of Bitcoin that was created in 2017. BCH has a history of forming long sideways patterns, followed by sharp breakouts.
The pattern:
Sideways accumulation: BCH typically spends 200-300 days in a sideways accumulation pattern.
Breakout: After the accumulation phase, BCH breaks out of the pattern and rallies sharply.
Magnitude of the breakout: The breakouts typically result in a 2-2.5x increase in price.
Is history repeating itself?
BCH has been trading in a sideways pattern since May 2022. This suggests that the accumulation phase is nearing its end and a breakout could be imminent.
Factors supporting a breakout:
Increased development activity: There has been a significant increase in
development activity on the BCH network in recent months.
Growing adoption: BCH is becoming increasingly adopted by merchants and businesses.
Positive technical indicators: The technical indicators for BCH are bullish, suggesting that a breakout is likely.
Potential targets: 3300.

EURAUDEURAUD is trading in range bound with 200 PIPS range.
some time ranges are the best things to play just buy the support and sell the resistance.
as this one is 200 pips range which can deliver fine risk to reward.
currently the price is at support level and being rejected due to buying pressure.
will the pair head back to resistance area ?
what you guys think of this idea ?

HelenP. I Euro can decline to support level and then start growHi folks today I'm prepared for you Euro analytics. Some time ago price rebounded from the support level, which coincided with the support zone and declined to the trend line, after which it turned around and in a short time rose back to the support zone. Then Euro broke the 1.0800 level and started to trades in consolidation, where it some time traded near this level until the price reached the trend line, after which the EUR rebounded and rose to 1.0950 resistance level, which coincided with the top part of the range with resistance zone. Euro not long time trades near this level and later declines from it to the trend line, and soon breaks this line. After this movement, the price declined lower, but recently it tried to back up, and when the EUR reached the trend line again, bounced down. At the moment, the price continues to decline and for my mind, the Euro will decline almost to the support level, after which it turn around and start to grow in consolidation. Therefore I set my target at 1.0900 points. If you like my analytics you may support me with your like/comment ❤️

Ethereum can rebound up from support line to resistance lineHello traders, I want share with you my opinion about Ethereum. Looking at the chart, we can see how the price some days ago entered to range, where it first declined to the resistance level, which coincided with the bottom part and resistance area, after which ETH turned around and started to rise. Later, the price rose, after which made correction back to the 3720 level, and at once rebounded up to the top part of the range. After this ETH turned around and started to decline back to the 3720 level, and when it reached this level, the price broke it, thereby exiting from the range and continuing to decline in a downward channel. Some time the price trades near the resistance level, but later it rebounded and little declined, after which the price rose to the resistance line of the channel. Then Ethereum rebounded from this line and in a short time declined to the support line, where at the moment, the price continues to trades near. So, I think that ETH can fall to the support line again and then turn around and start to move up to the resistance line of the downward channel. For this reason, I set my target at the 3480 level, which coincided with the resistance line. Please share this idea with your friends and click Boost 🚀

SOLUSDT. Intraday tradeIf the price returns to 197.95 now and if the seller defends this level, then we can look for a short with a target of 178.55."

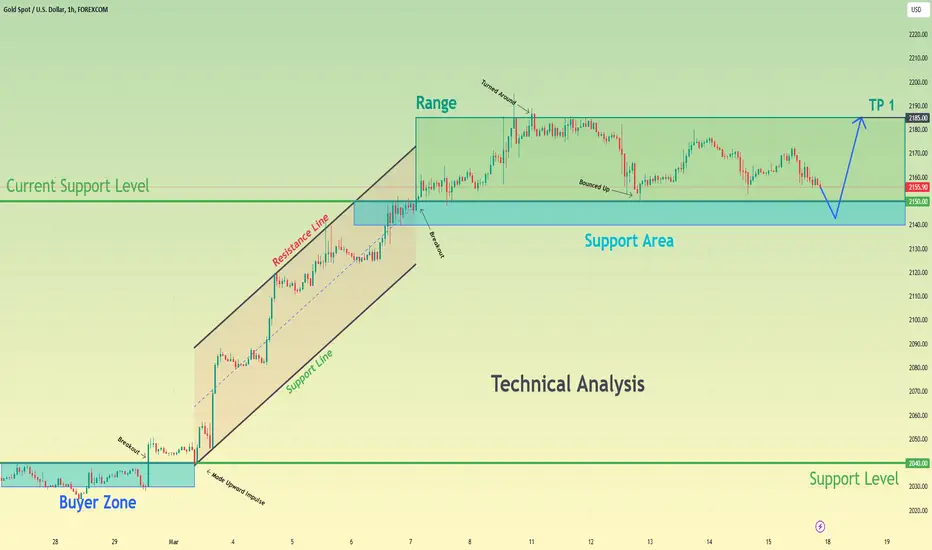
Gold can fall to support area, where turn around and start riseHello traders, I want share with you my opinion about Gold. Observing the chart, we can see that the price a not long time ago traded in the buyer zone, which coincided with the 2040 support level, and soon broke this level, after which it made a retest. Then price turned around and started to rise in an upward channel, where it in a short time reached the resistance line of the channel, and then made little correction, after which the price continued to move up to the current support level, which coincided with the support area. When Gold reached this level, the price broke it and later exited from the channel, but at once started to trades in a range, where XAU rose to the top part. After this movement, Gold turned around and declined to the 2150 level, but soon it rebounded and tried to back up, and failed. So, at the moment, Gold continues to trades near the current support level in the range, for this reason, I think the price can decline to the support area, where it will turn around and start to grow to the top part of the range, making a fake breakout of 2150 level. Therefore I set my target at 2185 points. Please share this idea with your friends and click Boost 🚀
Waiting for a Pelosi LongWhat a range we have here on RBLX. With higher lows into a strong resistance, Its certainly looks bullish, but we need to wait, and it may be quite some time we will be waiting for. You can range trade this of course, but we are tightening up now so its going to get a bit choppy.

Gold can reach resistance level again and then fall to 2120Hello traders, I want share with you my opinion about Gold. Observing the chart, we can see that the price a few time ago entered to range, where at once declined to the 2005 support level, which coincided with the bottom part and buyer zone. After this movement, Gold in a short time rose to the top part of the range, and then turned around and fell back to the support level and even lower, thereby breaking it and exiting from the range. Then price some time traded in the buyer zone and later XAU turned around and started to move up in an upward channel, where soon price broke the 2005 level. After this, XAU continued to move up in the channel, but later it fell to the support line, after which the price rebounded and made a strong impulse up to the resistance line of the channel, thereby breaking the 2180 resistance level. But a not long time ago, Gold turned around from this line and in a short time declined below the 2180 level, making a fake breakout. So, at the moment, Gold continues to decline and in my opinion, the price can try to rise to the resistance level, after which XAU will rebound and fall to the support line of the upward channel. For this case, I set my target at 2120 points, which coincided with this line. Please share this idea with your friends and click Boost 🚀

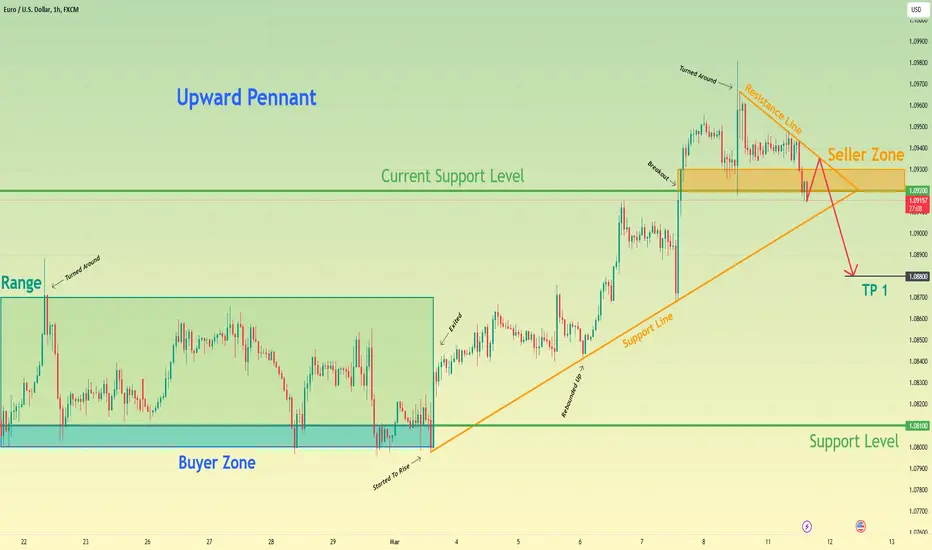
Euro can exit from pennant and decline to 1.0880Hello traders, I want share with you my opinion about Euro. Looking at the chart, we can see how the price some days ago started to trades in the range, where firstly it reached the top part, but then the price in a short time declined to the 1.0810 support level, which coincided with the buyer zone. After this, the price rebounded from this level and tried to back up, but failed and declined to the buyer zone and even lower, thereby exiting from the range and breaking the 1.0810 support level. Then Euro entered to upward pennant, where it at once rebounded from the support line and started to move up. In a short time price rose higher than the 1.0810 level, breaking it one more time, and later made a correction to support line of the pennant. Next, the EUR rebounded from this line and soon rose to the current support level, which coincided with the seller zone. Soon, the price broke this level and rose to the resistance line of the pennant, but a not long time ago it turned around and fell back to zone, where the Euro continues to trades very close to the 1.0920 level. I think that the Euro can bounce to the resistance line of the pennant, after which it turns around and rebounds down, thereby breaking the 1.0920 level and exiting from the pennant pattern. For this reason, I set my target at the 1.0880 level. Please share this idea with your friends and click Boost 🚀
HelenP. I Gold will fall to $2130, thereby breaking trend lineHi folks today I'm prepared for you Gold analytics. Some time ago price entered to consolidation, where it at once reached support 1, which coincided with the top part of the flat and support zonee, after which the price turned around and in a short time declined to support 2. After this movement, XAU some time traded near this level, which coincided with one more support zone, but later price made an impulse down to the trend line, thereby exiting from consolidation and breaking support 2. Then Gold started to rise between the trend line and soon broke support 2 again, after which it declined below this line and later rebounded up to support 1. Soon, Gold broke support 1 and also later trend line too. After this movement, the price rebounded from the trend line and continued to move up, and now the price trades a little higher than the trend line and I think Gold will fall lower the trend line, thereby breaking it. That's why I set my target at the 2130 level. If you like my analytics you may support me with your like/comment ❤️

British Pound can rebound up to resistance line of wedgeHello traders, I want share with you my opinion about British Pound. Observing the chart, we can see that the price a not long time ago declined from the 0.8570 resistance level to the 0.8520 support level, which coincided with the buyer zone inside the range. After this price rebounded up from the support level and rose almost to the top part of the range, but soon it fell back and some time traded near the 0.8520 level. Then GBP rose again to the top part of the range, which this movement coincided with the seller zone and at once turned around and fell to the buyer zone. In a short time later price exited from range, broke the support level, and declined to lower even buyer zone. After this, GBP entered to wedge pattern, where it soon made a strong upward impulse from the support line to the resistance line, which is located in the seller zone, thereby breaking the 0.8520 level one more time. Then price made a correction lower resistance level, after which it turned around and in a short time rose back to the resistance line of the wedge. But a not long time ago GBP bounced from this line and declined to support line, after which it recently bounced and started to rise. In my mind, the British Pound can correct to the support line and then rebound up to the resistance line of the wedge. So, for this reason, I set my target at 0.8560 points, which coincided with the resistance line. Please share this idea with your friends and click Boost 🚀

Euro can exit from pennant and then rise to resistance levelHello traders, I want share with you my opinion about Euro. Observing the chart, we can see that the price a not long time ago declined from the resistance level, which coincided with the seller zone, but soon it turned around and rebounded higher than the 1.0890 level and even the seller zone. But then EUR started to decline and in a short time it fell below the 1.0890 level, breaking it one more time, to the 1.0800 level, which coincided with the support area. Then price bounced to the resistance level and made a downward impulse lower than the 1.0800 level, breaking it and also entering to range. In range, the price tried to back up, but failed and declined to bottom part of this pattern. After this, the price reached the support line of the pennant, and made a strong upward impulse higher than the 1.0800 level, breaking it again, and exiting from the range too. Later Euro reached the resistance line of the pennant, but at once turned around and declined to the support level. Also recently, the price bounced from the support level and now it trades near the resistance line of the pennant, therefore I think Euro can fall to the support line of the pennant and then make an impulse up to the resistance level, thereby exiting from this pattern. For this case, I set my target at the 1.0890 level. Please share this idea with your friends and click Boost 🚀

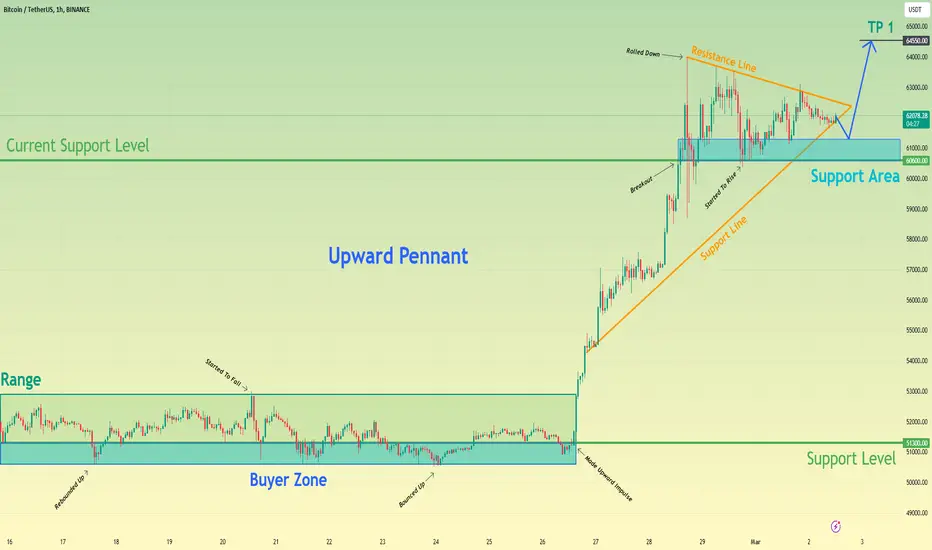
Bitcoin can exit from pennant, make correction and continue growHello traders, I want share with you my opinion about Bitcoin. Looking at the chart, we can see how the price some days ago started to trades in the range, where it at once declined to the buyer zone, which coincided with the 51300 support level, but soon it rebounded back. Later BTC reached the top part of the range and then turned around and in a short time declined back to the buyer zone, where the price some time traded. After this, it bounced up from this zone and few time traded near the support level, after which BTC fell back to the buyer zone and soon made a strong upward impulse to 54800 points, thereby breaking the 51300 level one more time and exiting from the range. Next, the price started to rise in an upward pennant, where it soon reached the 60600 current support level, which coincided with the support area and later broke this level. Then BTC rose to the resistance line of the pennant, but after this it turned around and in a short time declined to support area. After this price bounced up to the resistance line of the pennant back, where it at the moment continues to trades near. In my mind, Bitcoin can fall to the support area, thereby exiting from the pennant and then it will start to grow. So, that's why I set my target at the 64550 level. Please share this idea with your friends and click Boost 🚀
MOBILEUSDT: Bullish Gartley with Bullish DivergenceMOBILE appears to be Bullishly Diverging on both the MACD and RSI at the range lows aligning with the PCZ of a Bullish Gartley if it plays out I see it very likely that we push back up towards the highs and perhaps even the Fibonacci Extensions.

NZDUSD - Wait For The Trigger 🏹Hello TradingView Family / Fellow Traders,
On 4H: Left Chart
NZDUSD has been bullish trading within the flat wedge pattern in red and it is currently hovering around the lower bound.
On 1H: Right Chart
📈 For the bulls to take over, we need a momentum candle close below above the neckline highlighted in gray.
📉 Meanwhile, NZDUSD would be bearish short-term and can still trade lower inside the daily support.
📚 Always follow your trading plan regarding entry, risk management, and trade management.
Good luck!
All Strategies Are Good; If Managed Properly!
~Richard Nasr

HelenP. I Bitcoin can reach $60000 points and then start fallHi folks today I'm prepared for you Bitcoin analytics. If we look at the chart we can see how the price some time ago started to trades in consolidation, where firstly it declined to support 2, which coincided with the bottom part of the flat and support zone. After this, the price turned around and in a short time rose to the top part of the consolidation, after which it rebounded and made a strong impulse down to the trend line, which is located lower support zone. But soon, BTC entered back to consolidation, making a fake breakout of support 2, and continued to grow near the trend line to the top part of the range. Later, after the price reached the top part, it exited from consolidation and continued to move up to support 1, which coincided with one more support zone. But when BTC reached this level, it rebounded and some time traded near, after which it declined to the trend line and then made strong impulse up to 59000 points, thereby breaking support 1. So, at the moment, I expect that Bitcoin will reach the 60000 level, after which it turn around and make a correction movement. For my mind, BTC can decline to 56000 points. If you like my analytics you may support me with your like/comment ❤️

Ripple can bounce up from support line of pennant to seller zoneHello traders, I want share with you my opinion about Ripple. Observing the chart, we can see that the price recently started to trades in the range, where soon price declined to the 0.5070 support level, which coincided with the buyer zone and then continued to rise. But when it reached the top part of the range, XRP turned around and declined lower than the 0.5070 level, thereby exiting from the range. After this, the price started to rise in an upward pennant, where it at once rebounded from the support line and rose to 0.5070 level and in a short time broke it one more time. Then XRP some time traded near this level and later made a strong upward impulse to the resistance line of the pennant, breaking the 0.5570 resistance level, but soon price turned around and declined back. Also, price tried to back up to the resistance line, but failed and declined to support line of the pennant. But recently it rebounded from this line and started to rise. So, now I think that Ripple can correct to support line of pennant again and then rebound up to the seller zone, breaking the resistance level. For this case, I set my target at 0.5635 points inside the seller zone. Please share this idea with your friends and click Boost 🚀

RLC - Descending Channel Tightening I just longed GETTEX:RLC with a tight stop loss (%2) I just like the way it is shaping up in this tight channel and with the altcoin market showing strength today this one has been lagging.
Looks good for a push to fill in the inefficiency above.
May just dump and hit my stop overnight, but worth the risk imo.
Trade safely, use stops.

HelenP. I Bitcoin will rebound from trend line and continue growHi folks today I'm prepared for you Bitcoin analytics. Some days ago price rebounded from the trend line and rose to the support zone, which coincided with the 50650 support level, but at once BTC rebounded and made little correction. After correction, the price rose back to the support zone, and in a short time, BTC broke the 50650 support level and rose until to the resistance level, which coincided with the resistance zone, and also price started to trades inside consolidation. In consolidation, the price rebounded from the resistance level and declined to the support level, but soon it bounced and rose back to the 52800 level. After this movement, BTC turned around and started to decline to the support level, which coincided with the trend line, where recently it rebounded and started to grow. At the moment price continues to rise near this level in consolidation, so I expect that Bitcoin will correct to the trend line, after which it will rebound and continue to move up in consolidation. That's why I set my target at 52300 points. If you like my analytics you may support me with your like/comment ❤️

Bitcoin can grow from support area to resistance line of wedgeHello traders, I want share with you my opinion about Bitcoin. Looking at the chart, we can see how the price some days ago started to trades in the range, where firstly it declined to the support level, which coincided with the buyer zone and bottom part of the range. After this, the price rebounded up and rose to 48950 points, but then it turned around and started to decline. As well, the price entered to upward wedge, where it fell to the support line, thereby exiting from the range and breaking the 41700 level, but soon BTC turned around and started to move up. Soon, the price broke the 41700 level and later made little correction to the support line of the wedge, after which Bitcoin made a strong upward impulse to the resistance line, breaking the current support level, which coincided with the support area. But a not long time ago it rebounded and now the price trades near the support level in the support area inside the wedge. In my mind, BTC can decline to the support level and then rebound up to the resistance line of the wedge. For this reason, I set my target at the 54000 level, which coincided with the resistance line. Please share this idea with your friends and click Boost 🚀

QNTUSDTQNTUSDT is trading in range bound with 10% range.
some time ranges are the best things to play just buy the support and sell the resistance.
as this one is 10% range which can deliver fine risk to reward.
currently the price is at support level and being rejected due to buying pressure.
will the pair head back to resistance area ?
what you guys think of this idea ?

Gold can rise higher than resistance line and then start to fallHello traders, I want share with you my opinion about Gold. Looking at the chart, we can see how the price a not long time ago started to trades in a range, where it rose in a short time to the top part and even higher to the resistance line, but soon it turned around and declined back to the range. Later price declined to the support area, but in a short time rose back to range and some time traded near the 2025 current support level. But a few moments later Gold exited from range and made a strong impulse down to the buyer zone, which coincided with the 1995 support level, breaking the 2025 level. Soon, XAU bounced from the buyer zone and rose higher than the 1995 level and then started to rise near the support line to the current support level. And in a short time later, Gold reached this level, broke it again and at the moment, it trades near the support line. So, in my mind, Gold can rebound from the support line and rise to the 2035 - 2040 zone, thereby breaking the resistance line, after which it will turn around and start to decline, and maybe lower the support level. Therefore I set my TP at the 2015 level. Please share this idea with your friends and click Boost 🚀
