Arbitrum ($ARB) - Ranging for now, demand sitting belowThis idea is that ARB will see ranging price action with significant swings over the coming days weeks. Reclaiming the equilibrium would be major, but not sure if we get that just yet.
If the range is lost, I see this heading toward $1.30
Some serious gains to be made even if it ranges for a little while. Overall structure is strong and bullish for a longer term outlook however.
Cheers
Range

EURGBPEURGBP, after recent massive bearish rally, EURGBP is now trading in range and perfectly testing the lows and highs of the range.
Ranges are best in a sense just buy the support and sell the resistance.
Currently the price is at support level and seems like a fine buying opportunity.

Euro can break support line and continue fall to support levelHello traders, I want share with you my opinion about Euro. By observing the chart, we can see that the EUR a few days ago rising inside the upward channel, where it even made a fake breakout, but after this price turned around and made an impulse up to the 1.0785 support level. After this, the Euro broke this level, thereby exiting from the channel and started to trades in the range, where the price rose to the top part, which coincided with the resistance level and at once rebounded down to the buyer zone. In this zone, the price declined to the support line and at once rebounded back to the range, making a fake breakout, after which EUR reached the 1.1010 resistance level. In a short time price broke this level, and rose to the resistance line, but then the Euro rebounded from this line and made a strong downward impulse to the support line, breaking the 1.1010 resistance level, which coincided with the seller zone, one more time. Recently, the price bounced from this line and tried to rise, but failed and now trades very close to this line. In my mind, the Euro can bounce from the support line and rise to the resistance line, after which it will make a downward impulse to the support level, breaking the support line. For this reason, I set my target at the 1.0785 level. Please share this idea with your friends and click Boost 🚀

Intel - Clear StructureHello Traders, welcome to today's analysis of Intel.
--------
Explanation of my video analysis:
In 2022 Intel broke a massive previous support level at the $45 area towards the downside. This break was followed by a drop of roughly -50%. With a perfect retest of a very long term structure level, this recent pump on Intel was quite anticipated. If Intel pulls back to the previous support level mentioned in the analysis, I am looking for potential long setups.
--------
I will only take a trade if all the rules of my strategy are satisfied.
Let me know in the comment section below if you have any questions.
Keep your long term vision.

FILECOIN ($FIL) - Run it up to the highsFilecoin is developing a long setup if the criteria is met - that is hold the MS break level (keep bullish structure in tact) and reclaim the macro range eq (black dashed line EQ).
So long as it manages to do that, it will push the highs once more. At that point we monitor to see if it breaks out of the downward diagonal and pushed HTF Resistance or if another correction is due, but let's not get ahead of ourselves.
First thing is first, maintain our current low and begin to put in strength soon.
Otherwise I think we revisit Q1 level (lower range quadrant).
Watching this closely over the coming week.
Vatsik

$INJ Injective Protocol Consolidation before Continuation?I am closely eyeing Injective here within this macro range of consolidation.
- It is holding the downward diagonal
- It is respecting the range eq
- Demand below in green (which we may or may not re-visit)
- want to see the range eq either hold immediately or be reclaimed, will evaluate over coming day(s)
Criteria for me will be to hold/reclaim that eq and the ema.
Will update later.
Cheers

PYR Weekly Imbalance Retest : $10 are comingPYR, the crypto that patiently accumulated within a horizontal range, unleashed a rapid breakout, leaving behind a significant weekly imbalance. As we tread water in an ascending channel, the journey to surpass the upper bounds awaits a strategic retest, targeting the elusive $10 milestone.
Key Observations:
Extended Accumulation Period:
PYR underwent a prolonged phase of accumulation, consolidating its value within a horizontal range.
This accumulation laid the foundation for a potential explosive move.
Swift Breakout and Imbalance Creation:
The breakout from the accumulation range was swift, propelling PYR to new heights.
However, the breakout left behind a conspicuous weekly imbalance, signifying a significant pool of untraded volume.
Current Scenario and Anticipated Moves:
Ascending Channel Dynamics:
PYR is currently traversing within an ascending channel, marked by higher highs and higher lows.
The channel signals a bullish bias, but challenges lie ahead.
Struggling at the Channel's Upper Boundary:
Despite the bullish momentum, PYR has faced resistance at the upper boundary of the ascending channel.
The inability to breach this level suggests a need for a strategic move.
Anticipated Move - Retest Strategy:
Retest of Weekly Imbalance and Range High:
To fortify its ascent, PYR is expected to undergo a retest of the weekly imbalance left by the breakout.
This anticipated retest aligns with the range high, providing a confluence of support.
Critical Juncture at $10:
The strategic retest becomes a crucial juncture, determining PYR's ability to overcome historical resistance.
A successful retest could pave the way for a decisive move towards the $10 psychological level.
Strategies for Traders:
Observing Price Action at Key Levels:
Traders should closely monitor price action around the weekly imbalance and the range high during the retest.
A strong bounce from these levels could signal a renewed bullish momentum.
Setting Strategic Entry Points:
Consider setting entry points in alignment with the anticipated retest, ensuring positions are strategically placed to benefit from potential bullish moves.
Conclusion: PYR's Odyssey Continues
PYR's journey, from patient accumulation to a breakout with lingering imbalances, is a testament to the complex dynamics of crypto markets. As we stand at the threshold of a potential retest, traders brace themselves for a strategic move that could propel PYR towards the elusive $10 mark.
🚀 Ascending Channel Dynamics | 🔄 Imbalance Retest Strategy | 💼 Strategic Entry Points
💬 Share your insights on PYR's journey and your strategies for navigating this crucial phase! 🌐✨

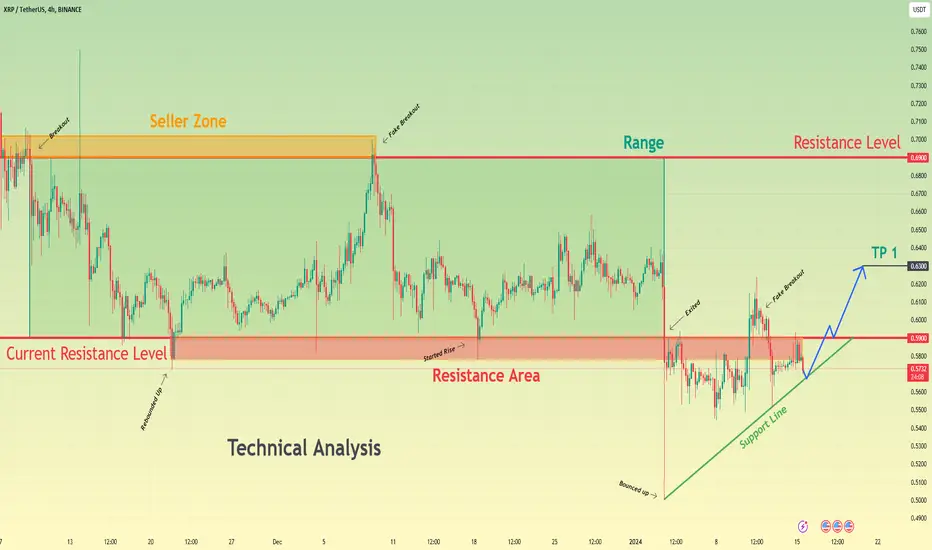
Ripple can rise to resistance level and try to break itHello traders, I want share with you my opinion about Ripple. Looking at the chart, we can see how the price some days ago broke the 0.6900 resistance level, which coincided with the seller zone, and started to trades in the range. Inside range, XRP firstly declined to 0.5900 current resistance level, which coincided with the resistance area, after which it rebounded and made an upward impulse to the seller zone. But the price at once turned around and in a short time declined back to the 0.5900 level, making a fake breakout. Then Ripple bounced from this level and tried to rise, but failed and made a strong downward impulse to the support line, thereby exiting from range and breaking the 0.5900 level. After this, the price at once rebounded from the support line and rose to the resistance area, even rose higher than the resistance level, but recently XRP declined back, making a fake breakout. Now price trades near the support line and I think that Ripple can bounce from the support line and rise to the resistance level and try to break it. After the breakout, XRP will make a retest of this level and continue to move up. So, that's why I set my target at the 0.6300 level. Please share this idea with your friends and click Boost 🚀
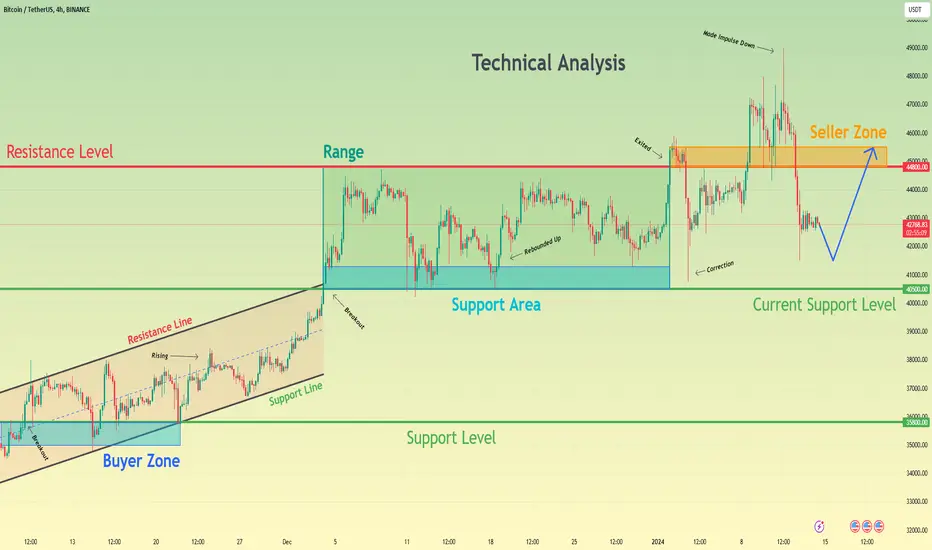
Bitcoin can fall little more, then it turn around and start riseHello traders, I want share with you my opinion about Bitcoin. Looking at the chart, we can see how the price some days ago started to trades in an upward channel, where it reached the 35800 support level, which coincided with the buyer zone and soon broke it. Price continued to rise in the channel and in a short time later rose until to 40500 current support level. Then BTC broke this level, thereby exiting from the channel and at once entering to range, where it soon rose to the top part, but later made a correction to the support area. After this, Bitcoin repeated this movement again and then made an upward impulse higher than the 44800 resistance level, which coincided with the seller zone, thereby exiting from the range. But the price at once made a strong correction movement below this level, after which BTC at the short time rose back and grew to 48900 points. And then, the price made a strong downward impulse again, and now the price trades below the resistance level. In my opinion, Bitcoin can decline a little more, like to the 41500 points, and then the price will rebound up to the seller zone, thereby breaking the resistance level. For this case, I set my target at the 45500 seller zone. Please share this idea with your friends and click Boost 🚀
$MOVR Swing Long to Range Highs and $36I've entered a lot that I am currently monitoring, I think we may get one more dip into green before pushing up.
Some key criteria:
- Price has reclaimed the range eq(s) and needs to continue to hold on a retest over the coming 24 hours
- Hold the ascending trendline and put in a higher low
- Lose the range eq(s) and I'll get stopped, then it's likely down to test the 100ema
I think this is gearing up for a big leg, just a matter of time imo.
With this price action I will continue to long it even if I get stopped because unless anything drastically changes, this wants to run.
My opinion,
Vatsik

HelenP. I Gold can make one more movement up and then start fallHi folks today I'm prepared for you Gold analytics. If we look at the chart, we can see how the price a few time ago rebounded from the support level, which coincided with the support zone and declined to 1930 points. After this, XAU in a short time backed up and even rose higher than the 1975 support level, thereby breaking this level and later starting to trades in consolidation. In this range, Gold first made a retest of the support level and then made a strong impulse up to the resistance zone, but when it reached this zone, it even rose higher than the top part of the consolidation, after which price in a short time declined back, making a fake breakout. Next, Gold fell to the support level back, after which at once rebounded and made an impulse up to the resistance zone, which coincided with the resistance level again. But a not long time ago, XAU started to decline and fell below, making fake breakout one more time. Also, recently, it turned around and started to rise, so possibly Gold will try to grow to a resistance level, after which the price can start to decline. Therefore I set my target at the 2010 level. If you like my analytics you may support me with your like/comment ❤️

ENS Swing Long to Range HighsNYSE:ENS reclaim of local range EQ (green zone) and this is my area of interest.
Stable structure on low time frame and primed for a push up imo.
Tight stop in case I didn't catch the low, but I expect a bounce soon if the market stays strong.
Will update later.

📈 Bitcoin Cash: Charting Familiar Patterns ( FRACTALS )🔄 Repetition of Behavioral Patterns:
Bitcoin Cash (BCH) has demonstrated a penchant for revisiting and replicating its past behavioral patterns, creating an intriguing narrative for traders and investors. Notably, it has a history of mirroring its own fractals and behaviors, offering insights into potential future movements.
📅 Historical Recap:
In a strikingly similar scenario, BCH engaged in a prolonged consolidation within a substantial range from June 2022 to July 2023. Following this period of range-bound trading, BCH experienced an impressive threefold surge. A noteworthy observation is the current market condition, where BCH has been navigating within a range for approximately six months.
📈 Parallel Situations:
Drawing parallels between the historical period of consolidation and the current market stance, BCH appears to be setting the stage for another notable move. The extended sideways movement often precedes a significant price action, and the historical precedent suggests the possibility of a substantial pump in the near future.
📉 Shakeout or Straight Pump:
While predicting market movements with absolute certainty is challenging, the upcoming developments for BCH could unfold in multiple ways. The potential scenarios include a shakeout, introducing volatility before a rally, or a straightforward pump as observed in previous cycles.
📊 Strategic Considerations:
For traders and investors, attentiveness to historical patterns and fractals can offer valuable insights into potential future movements. Strategically positioning oneself to capitalize on potential breakouts or shakeouts can be part of an informed trading strategy.
🔮 Unlock Exclusive Insights:
Unlock my 3 crypto trading indicators for FREE! Link to Unlock below !!!

British Pound, after rise movement, can start decline to 1.2610Hello traders, I want share with you my opinion about British Pound. Looking at the chart, we can see how the price some days ago declined to the support line and at once rebounded up to the support level, which coincided with the buyer zone. In a short time, GBP broke this level and tried to rise higher, but failed and started to decline in a downward channel, where it declined to the support line, thereby breaking the 1.2610 support level. After this, the price rebounded from the support line of the channel and made a strong upward impulse to the resistance level, which coincided with the seller zone, breaking the 1.2610 level again and exiting from the downward channel. Also, GBP started to trades in the range, where it, after an upward impulse made a correction to the support level and then rose to the seller zone. But a not long time ago it declined back, making a fake breakout of 1.2790 and then rolled up. Now, the price continues to rise in range, and in my mind, the British Pound can one more little grow and then start to decline to a support level, which coincides with the bottom part of the range. For this case, I set my target at the 1.2610 support level. Please share this idea with your friends and click Boost 🚀

Ethereum can reach top part of range and then start to fallHello traders, I want share with you my opinion about Ethereum. By observing the chart, we can see that the price some days ago declined to the support level, which coincided with the buyer zone and mirror line, after which ETH at once rebounded and started to rise. In a short time price rose to 2445 points, thereby breaking the resistance level, but soon it around down and fell to the mirror line. Soon, ETH broke the mirror line and some time traded below this line. After this, Ethereum rose to this line, breaking the 2360 level again, and even later ETH made a fake breakout of the mirror line, after which the price made a downward impulse to the buyer zone, breaking the resistance level one more time. Next, the price entered to range, where it quickly rose to the top part, after which the price rebounded and declined to the 2200 support level. Also, ETH made a fake breakout of this level, after which it in a short time back up, and now Ethereum continues to trades in range. So, possibly price can reach the top part of the range and then start to decline to the support level. For this case, I set my target at 2200 support level. Please share this idea with your friends and click Boost 🚀

Symmetrical Triangle Formation Ahead of ETF News 📈Bitcoin (BTC) is currently charting a distinctive path within a substantial ascending channel on the 4-hour timeframe. The market has recently witnessed its third notable reaction near the upper boundary of this channel. Amidst this, a symmetrical triangle pattern is emerging, setting the stage for a potential breakout. The significance of this pattern intensifies as it unfolds just ahead of eagerly anticipated news regarding the approval of a BTC ETF.
📈 Technical Dynamics:
📉 Ascending Channel Structure:
Bitcoin's price action has been consistently respecting the confines of a well-defined ascending channel. This technical structure suggests a prevailing bullish sentiment in the market.
🔼 Symmetrical Triangle Formation:
The recent interactions with the upper channel boundary have led to the formation of a symmetrical triangle. This pattern is characterized by converging trendlines, indicating a phase of indecision and potential price volatility.
🌐 Market Sentiment and ETF Catalyst:
🚀 Anticipation of ETF Approval:
Bitcoin's current consolidation and the formation of the symmetrical triangle coincide with the imminent decision on the approval of a BTC Exchange Traded Fund (ETF). Positive news on this front could trigger a significant market reaction.
📉 Breakout Scenarios:
🔼 Bullish Breakout:
If the BTC ETF is approved, and market sentiment remains positive, a bullish breakout from the symmetrical triangle is plausible. This could propel Bitcoin to new heights, capitalizing on the increased institutional interest.
🔽 Bearish Reversal:
Conversely, a negative outcome or unexpected market reaction to the ETF news may result in a bearish reversal. Traders should be prepared for both scenarios and monitor critical support and resistance levels.
📝 Trading Strategy:
🧐 Monitor Triangle Breakout:
Traders are advised to closely monitor the symmetrical triangle pattern and await a decisive breakout. Confirmation of the breakout direction is crucial for informed trading decisions.
🗞 Stay Informed on ETF News:
Given the potential impact of the ETF decision, staying informed about regulatory developments and market sentiment is imperative.
🚀 Unlock my 3 crypto trading indicators for FREE! 🚀

BTC Update - 06.01.2024 / 4 setups in one timeI don't see situations in the market at the moment, but the picture on bitcoin is very interesting, I see several situations for entry on it.
1 hour chart: almost filled the 4 hour imbalance and accumulated liquidity on both sides, from which I would watch the reaction.
Long POI:
- Compression (41920): in the moment would watch the performance of the off on the ltf and decide to enter.
- Key low (40333): here I would also wait for the Long order flop on ltf to nucleate and then take a position.
Short POI:
- Equal highs + FF (44840.8): everything is the same only shorted.
- Key High (45950): I would be careful with this zone of interest, I would take a position only if the structure breaks at 30m and above.
Not a financial advice, always observe the risks and watch the reaction in the points of interest and only then make your entry into the position!

HelenP. I Ripple will fall little and then rebound up to $0.5930Hi folks today I'm prepared for you Ripple analytics. A not long time ago price started to trades in consolidation, where it firstly tried to rise, but soon declined until to resistance zone, breaking the 0.5930 resistance level. But in a short time, XRP rebounded from this zone and some time traded near the resistance level, after which it finally rose to the top part of the consolidation. Then Ripple made little correction, and in a short time rose back to the top part, but later it rebounded from this part and started to decline to the resistance zone. After the price declined to the resistance zone, it broke the 0.5930 level again, and soon XRP made a strong impulse down to 0.5000 points, thereby exiting from consolidation. After this, the price in a short time rose back to the resistance zone, reached the resistance level and recently it started to decline. At the moment, XRP trades below the resistance zone and I expect that Ripple will make one more movement down and then rebound up to the resistance level. That's why I set my target at this level - 0.5930. If you like my analytics you may support me with your like/comment ❤️

BTC SHORT/CRAB, LET GO.BTC looks to be in a short term distribution phase, with a likely top already in ~47k on CME.
Expect moderate volatility this quarter, where I expect constant violent 10% swings in either direction between 46k and 41k until the ETF approval. Afterward, expect a drop to ~38.5k by the end of January. Note, January EOM has the highest likelihood of dropping the furthest beyond the "Q1 High probability range noted on the chart" towards 34.5k.
Breaking out the Q1 Range will likely result in continued momentum to follow until the next line of support/resistance, noted at 50k or 34.5k.
The last line of defense will be ~31.6k in the event of a full liquidation cascade as it supports the previous sideways structure we had between 32k and 25k since March last year and acts as the 0.5 fib from the ATH to this cycle low. If we drop further under 30k, than you must accept the increased probability of 46k being a bull trap and being the largest rug pull to occur and we head toward revisiting 20k, 15, and even 10k.
RWI (Random Walk Index) and LS (Liquidation Screener) are the indicators used. RWI is printing bearish divergences along with starting to crossover toward bearish trend. LS probably has shown the top as it has hit the red bearish territory and recently dropped out of it and heading over the median line currently at 33.7k (but is rising and i could see it bottom out toward the lower side of Q1 probability range by EOM JAN or even EOQ)
Overall, I believe the ETF may be a sell-the-news event that will in the grand scheme of things crab between 46k and 41k, until the end of Q1, but with a short visit to 38.5k. Breaking out the expected range of 46k-38.5k, begets continued momo in the same direction. Take note this is likely due to lowered overall volatility of BTC maturing as a whole. But alts may push forward after the expected flush.
Let go. Relax.
Q1 Ranges:
High probability
46k-38k
Moderate probability
52k-30k
Max probability
54k-18k
Trades:
Short @ 44k
TP 41k, 39k, (may carry it down to 30k depending on PA under 39k)
SL 47k
Short @ 50k ( if expected range breaks out)
TP 40k, 35k, 32k
SL 54k
Long @ 39k
TP 44k, 50k
SL 37.5k
Long @ 35k & 32k
TP 40k, 50k
SL 29k

Swiss Franc can break resistance level and then make retestHello traders, I want share with you my opinion about Swiss Franc. By observing the chart, we can see that the price a few days ago and started to trades in the range, where it first declined to the 0.8910 resistance level, which coincided with the seller zone and the bottom part of the range. After this, CHF rebounded from this level to top part of the range, but when it reached this area, the price rolled down back. Next, the price exited from the range and entered a downward channel, where it broke the 0.8910 level and a short time later declined to support line of the channel. Then Swiss Franc bounced from this line and rose to the resistance line, where it at once rebounded and continued to decline to 0.8500 current resistance level. After the price fell to this level, CHF broke it and declined to 0.8330 points, after which it started to rise to this level. At the moment, the price trades close to the resistance level and I think that the Swiss Franc can break this level, and at once make a retest. After this, CHF will continue to move up, so I set my target at the 0.8700 level. Please share this idea with your friends and click Boost 🚀

Keeping things simple - Bitcoin correction - Part 3Keeping things simple, stick to the higher time frames, you have all the information you really need. Check my previous ideas for W1 and D1 analysis
This idea further strengthens by bearish position (In the short-term)
Explanation given in the chart
Given the current price action, I'm expecting price to either range or correct (I think a correction is more likely)

Ripple can make one more correction move and then bounce upHello traders, I want share with you my opinion about Ripple. Looking at the chart, we can see how the price started to decline a downward channel a few times ago, where it broke the 0.6800 resistance level, which coincided with the seller zone, and then fell to the 0.5900 support level, which coincided with the buyer zone. Also soon, the price broke the 0.5900 level too and declined to support line of the channel, after which it rebounded and made a strong upward impulse to the resistance level, thereby exiting from the channel and starting to trades in the range. After this movement, Ripple rolled down from the seller zone and declined to the support level in the range. But a not long time ago, XRP rebounded from this level and in a short time rose to 0.6580 points. And recently, the price bounced down and now I think that Ripple can one more time a little decline and then continue to move up. So, that's why I set my target at the 0.6600 level. Please share this idea with your friends and click Boost 🚀

Euro can fall to support line of pennant, and try to exit of itHello traders, I want share with you my opinion about Euro. By observing the chart, we can see that the price some days ago started to trades in a range, where it firstly rebounded from the support level, which coincided with the buyer zone, and in a short time, it reached the top part of the range. After this, EUR made a correction to the 1.0520 support level, exited from the range, and started to rise in an upward channel, where the price soon rose to the resistance line from the support line of the channel. Later Euro rose one more time and reached the current support level, which coincided with the support area, but at once it rebounded and made a downward impulse, thereby exiting from the channel. After this movement, the price started to trades inside a wedge, in which the Euro rebounded from the support line and made a strong impulse up to the resistance line, breaking finally the 1.1000 level. But a not long time ago Euro rolled down from the resistance line and now it trades near the support area. In my mind, the Euro can decline to support line of the wedge, which coincides with the support level, and try to break them. If the price makes this, it will exit from the wedge and then make a retest, after which the EUR will continue to fall. Therefore I set my target at the 1.0880 level. Please share this idea with your friends and click Boost 🚀
