HelenP. I Gold can continue to decline inside consolidationHi folks today I'm prepared for you Gold analytics. Some days ago price declined to the support level, which coincided with the support zone, and then tried to rise, but failed and made a downward impulse below the 1980 level, breaking it. After this, XAU in a short time rose back and even later started to trades in consolidation, where it rose to the resistance level, which coincided with the resistance zone and top part. Then price rebounded from this level and fell to the support level, but at once rebounded and made an impulse up back to the resistance zone. But a not long time ago it declined from this zone and now it continues to trades in range. For my mind, I think that Gold can rise a little more to the resistance level and then it will continue to decline. That's why I set my target at the 2030 level. If you like my analytics you may support me with your like/comment ❤️
Range

BTC Update - 26.12.2023 / Intraday Long setuph1 Chart:
We see how now price is in the range between PDL and PDH.
I expect downward movement with the purpose of withdrawal of this PDL liquidity and exit upwards, where I plan to gain my local long positions with the purpose of PDH.
Not a financial advice, always observe the risks and watch the reaction in the points of interest and only then make your entry into the position!

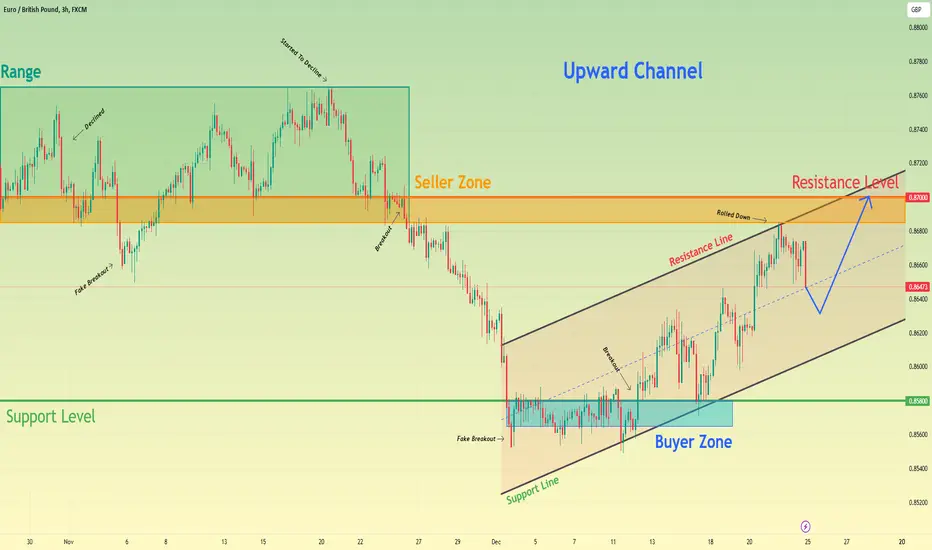
British Pound can make one more movement down and then bounce upHello traders, I want share with you my opinion about British Pound. Observing the chart, we can see that the price a few days ago started to trades in the range, where it first declined below the 0.8700 level, which coincided with the seller zone and bottom part of the range, but soon backed up, making a fake breakout. After this, the price rose to the top part of the range, bounced and in a short time EURGBP declined below the 0.8700 level again and even soon exited the range. Then the price fell lower than the support level, which coincided with the buyer zone, and later around up and started to rise inside the upward channel. In the channel, the price rose higher than the 0.8580 level and a few moments later reached the resistance line of the channel, which coincided with the seller zone. But not a long time ago, the British Pound rolled down and now it continues to fall. So, possibly price can decline a little more and then rebound up to the resistance level, which coincides with the resistance line of the channel. For this case, I set my target at this level - 0.8700. Please share this idea with your friends and click Boost 🚀
HelenP. I Possibly Euro can exit of pennant and continue to growHi folks today I'm prepared for you Euro analytics. If we look at the chart, we can see how the price a few moments ago traded in consolidation, where it first declined to support 2, which coincided with the support zone and then rebounded up to support 1. Then price made a little correction and later made an upward impulse higher than support 1, which coincided with the support zone too. But soon, the Euro around down and made a strong impulse down to the trend line, thereby breaking two levels - 1.0965 and 1.0835. After this, the price started to rise close to the trend line, and in a short time it reached support 2. Next, the Euro entered to the pennant, where it made impulse up to support 1, but then the price corrected to the trend line. But recently, Euro backed up and now it trades near the support area. And I think that price can make a little correction and then rebound up to the 1.1090 level, thereby exiting from the pennant. If you like my analytics you may support me with your like/comment ❤️

HelenP. I Ethereum can break trend line and fall to $2140 levelHi folks today I'm prepared for you Ethereum analytics. Some days ago, the price declined below a support level, which coincided with the support zone, where later it reached the trend line. After this, ETH rebounded and in a short time rose higher than the 2000 level with zone and soon entered to consolidation, where the price reached the resistance level, which coincided with the resistance zone. Some time ago, Ethereum entered to this zone, but soon it around down and fell to the trend line. After this movement, the price started to rise between this line, and in a short time it rose to the resistance level again. But a not long time ago ETH rebounded down from this level and at the moment price trades near the trend line inside consolidation. For my mind, the price can grow a little more and then bounce down to the bottom part of the consolidation, thereby breaking the trend line. That's why I set up my target at the 2140 level, which coincided with this part. If you like my analytics you may support me with your like/comment ❤️

Bitcoin Distribution I aim to articulate the discernible trends depicted on the chart. Numerous trendlines can be observed in the historical movement of Bitcoin, with a notable convergence anticipated within the green-highlighted zones by 2024.
I anticipate the current distribution pattern to undergo a resolution downward, culminating in the formation of a plateau. This plateau may signify a potential period of financial relaxation in the near future.
Noteworthy points include the outcomes of yesterday's closed meeting with the leaders of BTC ETFs, which did not yield substantial price movements in an upward direction. Volatility, indicating a more accelerated position, leads me to consider the first two weeks of 2024 as a critical timeframe for resolution.

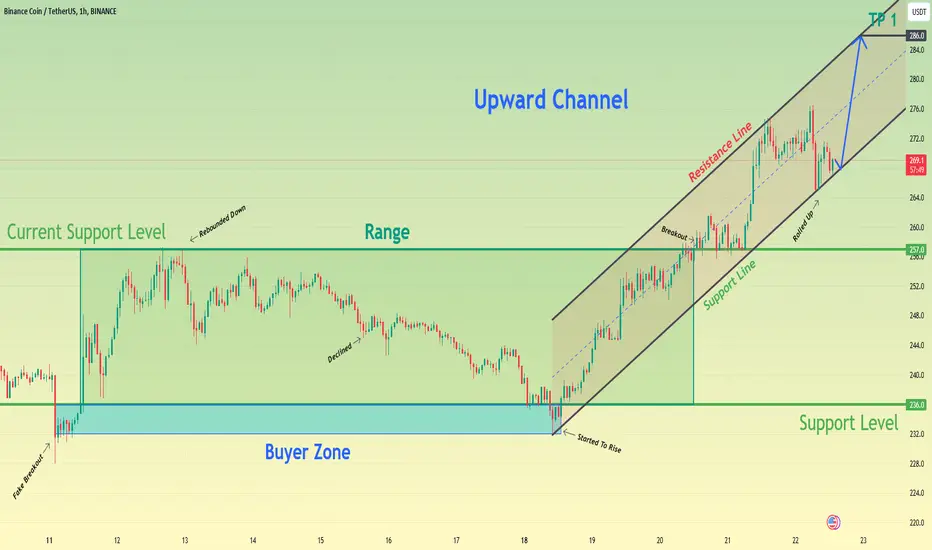
Binance Coin can rebound from support line and start to move upHello traders, I want share with you my opinion about Binance Coin. Looking at the chart, we can see how the price a few moments ago declined below the 236 support level to the buyer zone, where it at once rebounded and rose back, making a fake breakout. Next, the price started to range, in which it firstly rose to the top part, which coincided with the current support level, but soon BNB around down and started to decline. Declined to the buyer zone, the price at once rebounded and started to rise in an upward channel, where in a short time BNB rose back to 257 current support level. After this, the price broke this level and reached the resistance line of the channel, but a not long time ago, BNB rolled down and now it trades near the support line of the upward channel. In my mind, Binance Coin can bounce from the support line and start to rise to the resistance line back. For this case, I set my target at the 286 level, which coincided with this line. Please share this idea with your friends and click Boost 🚀
BTC Update - 21.12.2023 / Local range with Long OFh1 Chart:
Yesterday's targets in the form of liquidity pool behind PDH level were successfully achieved.
At the moment we have formed a local range with an upward exit after the POI mitigation in the form of 1h FVG.
Now I would like to see a devation from below and the birth of an upward order flow through the break of the structure on the ltf!
I am out of positions for now and I advise you to stay out of positions!
Not a financial tip, always observe the risks and watch the reaction in the points of interest and only then make your entry into the position!

BITCOIN - Price can continue to decline to support area in flatHi guys, this is my overview for BTCUSDT, feel free to check it and write your feedback in comments👊
Recently price traded near the resistance level, which coincided with the resistance area, but soon it broke this level and entered to wedge.
In a wedge, the price rose back and reached the resistance line of the wedge and then bounced and made a strong downward impulse to $40500 level.
Also, BTC exited from the wedge and broke the $43500 level, after which the price started to trades inside the flat.
Inside flat, Bitcoin two time tried to reach the resistance level, but failed and at the moment it trades near this level.
Possibly, Bitcoin can rise a little more and then start to decline to $40900 support area, which coincides with the support level.
If this post is useful to you, you can support me with like/boost and advice in comments❤️

HelenP. I Bitcoin can rebound up from support zone to $42000Hi folks today I'm prepared for you Gold analytics. Some days ago price traded near the resistance zone, which coincided with the the 42800 resistance level. But after it tried to rise higher, it around down and later made a strong downward impulse to the support zone, thereby breaking the resistance level. Also then, the price rebounded from the support zone, which coincided with the 40800 support level, and started to trades in consolidation. Some time ago price rebounded from the support level and rose to the top part of the range, which coincided with the resistance zone and level. And soon price entered to resistance zone, where it some time traded and later declined back to consolidation, where BTC continues to trades near the support level. I expect that Bitcoin can fall to the support zone, where it around up and starts to rise. For this case, I set up my target at the 42000 level. If you like my analytics you may support me with your like/comment ❤️

Major Bearish Signal ALERTAnother major bearish signal has flashed. All 6 moving averages have crossed both the Bull Market Open Price and Point Of Control. As we mentioned earlier this year, this usually signals the beginning of a short-term bearish trend up until the halving. Watch to find out more!

HelenP. I Ethereum can continue to move down to support levelHi folks today I'm prepared for you Ethereum analytics. A short time ago, the price rebounded from the 2155 support level, which coincided with the support zone and made a strong impulse up to the 2330 resistance level, which coincided with the resistance zone too. A short time later, ETH broke the resistance level and some days traded in the resistance zone. After this, the price rebounded down to the support level. thereby breaking the 2330 level and later starting to trades inside consolidation. In this range, ETH first tried to rise, but failed and declined to the 2155 support level. But then it rebounded and made impulse up to the resistance level, which coincided with the top part of consolidation, and recently it bounced from this level and started to decline. For my mind, Ethereum can make small movement up and then continue to fall to the support level. So, that's why I set my target at 2155, which coincides with this level. If you like my analytics you may support me with your like/comment ❤️

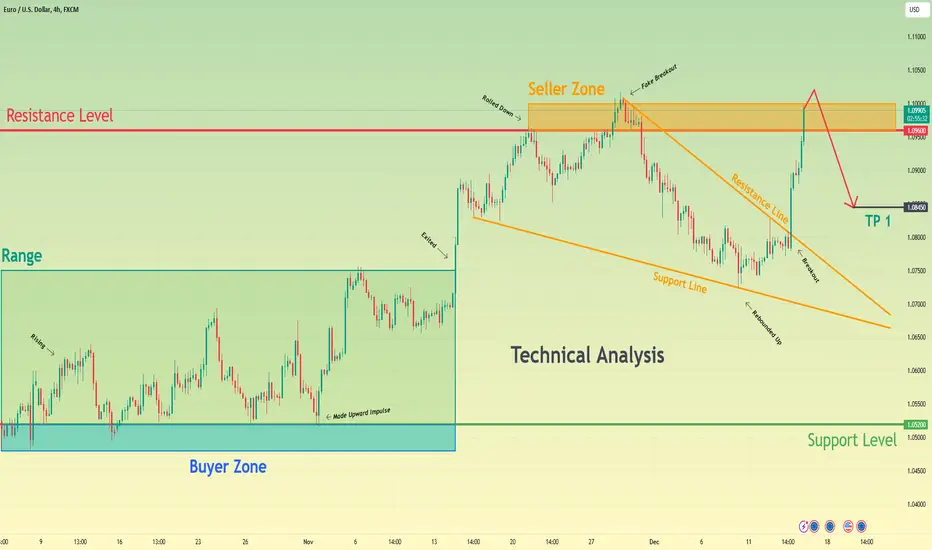
Euro can make one more movement up and then start to fallHello traders, I want share with you my opinion about Euro. Looking at the chart, we can see how the price some time ago started to trades in the range, where it first rebounded from the buyer zone, which coincided with the support level and rose to 1.0640 points. After this, the price made a little correction and then continued to move up, but soon EUR corrected to the 1.0520 support level again. Then the price made an upward impulse to the top part of the range, exited, and later entered to wedge. Inside the wedge, the Euro bounced from the support line and rose to the 1.0960 resistance level, which coincided with the seller zone, after which it corrected below. Then price reached the resistance line of the wedge, thereby making a fake breakout of the 1.0960 resistance level and at once made a downward impulse to the support line. But a not long time ago price around up and made a strong impulse up to the seller zone, exiting from the wedge and breaking the resistance level again. At the moment Euro continues to trades in the seller zone and in my mind, the price can rise a little more and then rebound down below the resistance level. Therefore I set my target at the 1.0845 level. Please share this idea with your friends and click Boost 🚀
AUDCHFAUDCHF is trading in fine range of 120 pips .
sometime ranges are best thing to play , all you need to just buy the support and sell the resistance.
currently the pair is trading at the resistance of the range and shown the fine bearish rejection .
Will it head lower to the support of the range.?

Bitcoin can correct to support line and then rebound upHello traders, I want share with you my opinion about Bitcoin. Observing the chart, we can see that the price some days ago rebounded from the mirror line and made a strong upward impulse to the 40250 support level, which coincided with the buyer zone. Soon BTC broke this level and continued to rise, but later it made a correction to the mirror line. After this, the price rebounded higher than the 43250 resistance level, which coincided with the seller zone, and then started to trades inside the range. In the range, BTC declined to the 43250 level and then bounced up to the top part, where later price started to decline. In a short time price fell below the 43250 level, thereby breaking it and continuing to fall close resistance line to the support level. After declining to the 40250 level, the price bounced up to the resistance line, broke it and now it continues to rise. For my mind, Bitcoin can correct the support line and then the price can rebound up to the 43250 resistance level. Therefore I set up my target at this level. Please share this idea with your friends and click Boost 🚀

04/12/23 Weekly outlookLast weeks high: $44745
Last weeks low: $42371
Midpoint: $39998
BITCOIN reaches just shy of $45K in what has been a huge continuation of the bullish trend we've experienced all of this year. A pattern I have noticed and one that can usually be seen in market environments similar to this is:
1. Strong move, usually only a few candlesticks.
2. Consolidation, sideways movement at new level.
3. Repeat first two steps.
With each step up, consolidation is getting longer and the rally shorter which shows the market is running out of people willing to go long at this price as selling pressure increases drastically.
At the time of writing priced has fallen 7% as the new week has started, with a new lower low, printing a new lower high could show the trend shifting towards short term bearish.
This would be healthy for a week or two in my opinion as there hasn't been a healthy correction for a while, 32.5K retest is the obvious place for price to want to retest as new support, this would also be bad for alts as leverage gets flushed out potentially. Now if BTC stagnates the altcoins will have a chance to run as profits flow into altcoins. The range midpoint is a very important level that will determine short term direction.

SYMPHONY a good buy for 44% and 89% returnsSymphony is a big player in air cooler segment and the company is showing a buy signal under range bound trading strategy where the stock covers a range of price set it has covered multiple times in the past.
Buying level- 875
CMP- 885 (close to buying level)
Target price 1- 1216
Target price 2- 1593
Hope you understood.
Thank you for reading.
Have a happy trading and investing experience

Lookback into a Yield Seeking Analytics: EUR Hit TargetDear Investors,
Goal
I often hear: "... but I learned from my mistakes." This phrase might be a kind emote of forgiving yourself, but you can learn much more from your successes. Today, I want to write more about an example of a success because I learned from it. I want to explain what I learned from this take profit and conclude the analytics because I know most of you never return to how an analytics you read concluded. In this follow-up analytics, I'll extend the chart of the previous setup and communicate the original data I didn't specify in that analytics. I also want to have this written because some of you prefer reading over watching my videos. In the meantime, I've released an open-source indicator on TradingView, and you'll see how this indicator could have extended or contradicted the analytics.
News & Sentiment Analytics
The initial analytics started with news analytics. I believe news can overwrite technical indicators. So, I usually begin my analytics with the news. For this purpose, I wrote some natural language processing algorithms. Some of you wrote to me, that you don't believe AI can outperform humans in supply/demand location and liquidity detection. Perhaps, that's true, but the fact is, while you commit your attention to one market and limited news, AI simultaneously processes hundreds of thousands of news from thousands of news agencies. From all these data, I emphasized the following in the analytics:
"Beyond technicals, the European Central Bank (ECB) has been cautious in raising interest rates to combat inflation, in contrast to the US Federal Reserve's more aggressive tightening cycle. This divergence in monetary policies has made the USD more attractive to yield-seeking investors."
I often extend news analytics with sentiment analytics. I could have written any combination of news, but I gave one as an example where sentiment analytics estimated a heavyweight.
Technical Analytics & Chart Patterns
In the video analytics, I used daily candles because I wanted to protect your attention from intraday noise. Nevertheless, the price action happens to be smooth. So, in this idea, I used 4-hour candles to better show the projection of how the price went into the take profit area.
Once I got an idea about a possible bearish trend from news and sentiment, I added my humble technical analytics knowledge to the setup. I noted the rising channel chart pattern that statistically, often breaks downward. You find the dotted purple trendlines on the chart. Furthermore, I calculated a demand zone between the two blue trendlines. I guessed the price could seek demand somewhere in this area. That's why you saw a falling arrow in the analytics. The trendlines themselves are the results of candle analytics, which is part of my technical analytics.
Indicators
In the signal idea, you couldn't see my Adaptive MFT Extremum Pivots indicator because I released this TradingView script after my video analytics. However, this script wasn't necessary to get a profitable vision. I added it to the update to note how the level where the price managed to fall aligns with the S3 support level, and the demand zone news-sentiment-pattern estimated aligns with the zone where the supports (S1-S3) are located. You can read the precise values in the indicator's table in the bottom right corner of the chart.
Results: +2.64% ROI, -0.18% drawdown, Trail Profit
Eventually, I added date and range computing arrows to the chart to show the results. It says a +2.64% profit over 45 bars (9 days, 12 hours). You can see the timestamp of the sentiment analytics above the candles: 01 December. You can also read the sentiment analytics idea in TradingView. See the relevant ideas. I used a stop loss at $1.102. In the worst-case scenario, I'd book a -0.18% drawdown, but the price never hit the negative limit. I don't specify the future price in this idea because I moved my stop loss down to act as a trail profit until the price decides to reverse, and I booked my profit.
It's not an investment advice. I don't claim mine was the only possible setup to take a profit from the price action. Historic results don't guarantee future returns. No indicator or analytics is inherently more superb than the others. Do your research. I only hope you learned a few practices from this idea you can use in your analytics, too.
Kind regards,
Ely

Gold can continue move down to support level in rangeHello traders, I want share with you my opinion about Gold. Looking at the chart, we can see how the price a few days ago rebounded from the 1935 support level, which coincided with the support area and fell to lower point 1815 of the mirror line. After this, Gold started to rise between this line and in a short time rose back to the support level. Then the price broke it and entered to range, where it later made the correction to the 1935 support level, thereby breaking the mirror line. After this, Gold rebounded from the 1935 level and made a strong upward impulse higher than the resistance level, which coincided with the seller zone, but soon it around back, thereby making a fake breakout, and at that moment it continued to decline. Possibly, Gold can continue to fall until to 1935 support level. Therefore I set my target at this level. Please share this idea with your friends and click Boost 🚀

HelenP. I Bitcoin can correct to support zone and rebound upHi folks today I'm prepared for you Bitcoin analytics. Some days ago price started to trades in consolidation, where it first declined below support 2, which coincided with the support zone. After this movement, BTC around up and rose to top part of the range, breaking support 2 again. Then the price made a correction to this level and at once bounced back, where it continued to trades near the top part of the consolidation. Later Bitcoin exited from consolidation, corrected, and then made a strong upward impulse to support 1, which coincided with one more support zone. Price broke this level and even rose higher than the support zone, but recently BTC fell to it. And then the price rebounded up and now I think that Bitcoin can make a correction to the support zone and then it continue to move up. For this case, I set up my target at the 45800 level. If you like my analytics you may support me with your like/comment ❤️

GOLD, between the high volume levelsToday I want to share a different point of view on the gold market, that matches with my last analysis, so even more interesting in my opinion.
Idea
Gold is currently trading in a high volume range between 1976 and 2010. The levels are extracted from a self made indicator, but you can recheck how important these levels are by browsing through the chart by yourself.
Anyway this strategy is quiet simple. A move out of the range with a daily close should push the price towards the next highlighted high volume area.
TP Levels
Bullish: 2050
Bearish: 1904
I'll explain the SL settings when it comes to trading.
Why are high volume areas important?
Market markers are placing orders at strategic points to get a maximum of safeness and of course profit out of the market. If a candle closes with a volume peak, compared to other candles, a huge amount of money was invested to start a movement from a specific level. If the levels are revisited the possibility of market makers appearing again is high and the main trends starting from these levels.

✅EUR_GBP WILL KEEP FALLING|SHORT🔥
✅EUR_GBP is trading in a
Downtrend and the pair is now
Accumulating in a bearish range
Pattern so IF we see a bearish
Breakout then we are likely
To see a further move down
SHORT🔥
✅Like and subscribe to never miss a new idea!✅

EURGBP: Oversold and Setting Up For Potential UpsideEURGBP is currently oversold near a low point of a range as the GBP appears set up to decline against the USD more than the EUR. Due to this, I think that the EURGBP pair will rise in the short term.
