Wait for a deviation play #BTCHi everyone!
I did the high time frame analysis on BTC (same as ETH).
I think we have not seen the bottom yet.
Why?
It is widely accepted that previous ATH was the range high...but I'm not convinced.
Look at the chart:
1) I have highlighted in red the backtest that triggered the selloff
2) I have highlighted in green the backtest that triggered the upmove
Important level and BTC not even touched...a coincidence?
Located just below the current range, with a large amount of potential liquidity.
What do you think if we break below the current range? Everybody will open a short to 10k ("same as the previous 6k level").
Perfect setup for a bear market rally.
Of course, it can go straight to 33-38k but I tend to be cautios in these type of market and look for max pain.
Let's see!
Range

MATIC - Range ReturningMATIC had a beautiful move but I think it is coming to it's end.
Back into the range likely, but that's fine. If it can range some more then potentially consolidate further for another push?
Swept origin of breakdown above in thick line, heavy resistance and will continue to be imo for some time.
Major high time frame market structure break still holding and I want to see it hold.
I provided my full thoughts on my YT channel as well, check it out!
Vatsik

8.HK PCCW - Buy above $4.20 (Range Trading)1. PCCW ( 0008.HK ) shows a very solid bottom at $4.20 since 2016.
2. $4.20 did not only show support on Aug 2003, Mar 2005, and Jan 2008 but also set a ceiling from 2008-2013.
3. An up day with strong volume on 27th May.
4. Dividend yield above 7% that suits for mid-run and range trading.
Trades:
BUY at any price between $4.20 & $4.40.
Upside Target: $4.80 (Actual range: $4.79-$4.86)
Downside Stop: $3.95 (Critical support at $3.98)

#XEM in a range with solid support#XEM
We have some extremely solid support between 357 - 367 in place since May. Looking like a healthy range with a big rejection. Naturally there is a lot of market FUD at the moment although the healthy stop-loss should sustain unless complete nuketown. Aiming for a 1.5 RR just under top of range and a stretch of 3 RR if things get back to a bullish scenario. Don't be afraird to take profit early on this one in case the CZ/SBF conflict grows. #

BTC Detailed Top-Down Analysis - Day 98Hello TradingView Family / Fellow Traders. This is Richard Nasr, as known as theSignalyst.
98 out of 500 days done.
I truly appreciate your continuous support everyone!
Let me know if you like the series, and if you would like me to change or add anything.
Always follow your trading plan regarding entry, risk management, and trade management.
Good Luck!.
All Strategies Are Good; If Managed Properly!
~Rich

DXY - Rejection Zones! Update!Hello TradingView Family / Fellow Traders. This is Richard, as known as theSignalyst.
As per last week analysis (attached on the chart), we were expecting a weaker DXY as it was sitting around a strong resistance zone. DXY rejected our resistance zone and traded lower.
Now DXY is trading lower and approaching our lower purple circle.
That lower purple circle is a strong zone to look for buy setups as it is the intersection of the green support zone and lower orange and brown trendlines. (acting as non-horizontal support)
As per my trading style:
As DXY approaches the lower circle, I will be looking for bullish reversal setups (like a double bottom pattern, trendline break , and so on...)
Always follow your trading plan regarding entry, risk management, and trade management.
Good luck!
All Strategies Are Good; If Managed Properly!
~Rich

Bullish signs 1301 in TASI (ASLAK)price in range and reach to lower bound + support area with good weekly close above monthly close targeting:
200 moving average (Daily)
supply area in red which also range upper bound

HAVELLS, RANGE BREAKOUT!!we could see in further few days to increase volume and give a range breakout. havells is a great company.
the major black line is the actual trend the stock should follow.
currently its undervalued.
great for swing trades.
one can take a target till 1420.

BTCUSDT range zone breakout to the upside and heavy pump aheadAs we can see price is bounded here with the range zone but soon resistance will break and a heavy pump to the upside after that is expected.
targets and resistances are also mentioned on the chart.
((press like👍 if you enjoy + comment your opinion about the market or your thoughts, below this analysis))

LINK Looks Juicy LINK has been accumulating for quite some time now - just bouncing in this range preparing for a large move imo.
Would look to enter on a retest of the mid-range or breakout above and retest - currently in no mans land with any real good entry location.
But on a higher timeframe this looks ripe to rip up to the target above at some point.
Annotations also on the chart!
Cheers

NEAR usdtthis is wyckoff distribution scheme. and i hit the luna ( on the left ) 118 with that analyse. i know 24-25 is so interesting to reach for near but we'll see what happen... im in long !

BTC Detailed Top-Down Analysis - Day 93Hello TradingView Family / Fellow Traders. This is Richard Nasr, as known as theSignalyst.
93 out of 500 days done.
I truly appreciate your continuous support everyone!
Let me know if you like the series, and if you would like me to change or add anything.
Always follow your trading plan regarding entry, risk management, and trade management.
Good Luck!.
All Strategies Are Good; If Managed Properly!
~Rich

My short term game plan for EthereumMy view on Ethereum for the upcoming days.
Longing up to sweep the range top before shorting to the lows.

BTC breakout Diagonal resistance is being retested on the H4, should it hold BTC will look to rally towards 20k upper boundary of the range. Should it be rejected and fall back under the diagonal trend then 18k should be retested.

Possible Downside to Bitcoinhello traders
There is a bearish impulse wave and we have a correction in the form of running flat. It is possible that we will get another bearish impulse wave, but the sellers must break the last wall of the buyers and the buyers' reaction be corrective after break and the sellers overcome it as well
If these conditions are met, a sell trade will be executed to target the level of 18870

✅AUD_CAD MOVE DOWN AHEAD|SHORT🔥
✅AUD_CAD is trading in a range
And as the pair is in the downtrend
The next move is also expected
To be in the downward direction
SHORT🔥
✅Like and subscribe to never miss a new idea!✅

AUD-CAD Wait For Breakout! Sell!
Hello,Traders!
AUD-CAD is trading in a downtrend
And the pair has formed a range
So we are waiting for the breakout
To determine the direction
Of the next move and because
Of the downtrend, the more likely
Direction of the breakout is
To the downside, but as I said
We will follow the direction
Of the breakout when
Entering the trade.
For now the bias is bearish tho
Sell!
Like, comment and subscribe to boost your trading!
See other ideas below too!

Range bound Nikkei, Bullish mean revThe range bound Nikkei is rebounding off support at 25,750 and heading back to the mean at 27,875 and possibly to the resistance at 30,000. The last pivot low has created bullish hidden divergence which could mean the Nikkei breaks out of its range and rallies higher.

NZD CAD LONG TRADE The last wall of sellers was broken with an impulse wave and formed a correction pattern and we have a range that reflects the trend with a large percentage, we will get another impulse wave

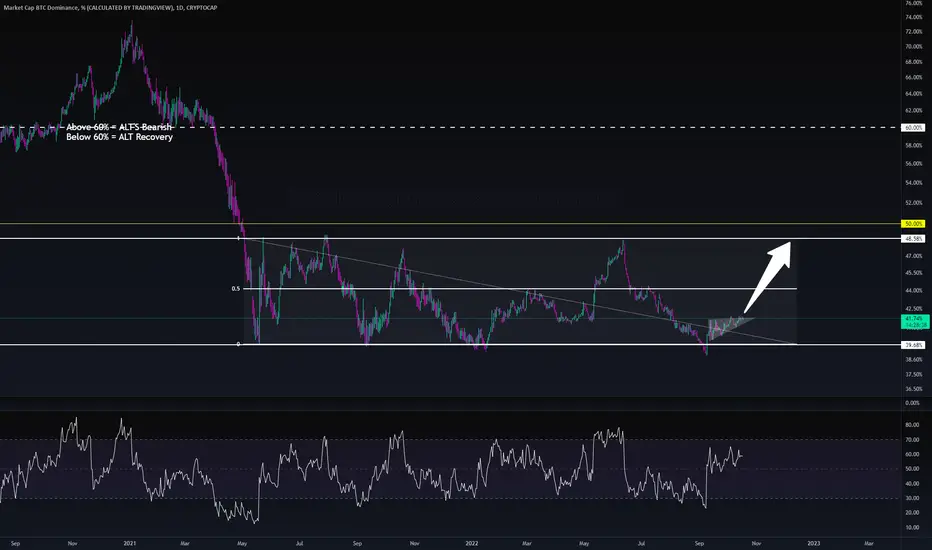
BTC Dominance Is Loving This RangeBTC Dominance Is Loving This Range
Yet again BTC Dom has bounced off this 40% support level - this can be interpretted many ways the most likely in this case is that BTC will likely be holding its cap (possibly even capital coming into it) whilst money drains out of the wider ALT market. With the USDT dominance looking like it might be dropping there could be a migration of ALT capital into BTC. Remember that when this happens this will "double" the impact of the BTC Dominance so not necessarily menaing that the Bitcoin price is going to fly....at all. Remember the dream scenario is always:
BTC Price Rise
ALT Market Cap Rise
BTC Dominance Fall
USDT Dominance Fall
Trading FlowchartThis is how every profitable trader that I know, makes money in the markets.
Know your Weekly, Daily, High, Low & Closing price levels
Know your intraday session opening prices
Look for swing highs and lows on your preferred trading timeframe
Buy High, Sell Higher
Sell Low, Buy Lower
Add to your winners
If the price turns 180º be prepared for sideways markets and take mean reversion trades

BTC - Almost Halfway Through The Accumulation E've been comparing recent BTC capitulation and now accumulation at the lows with the one in 2015. They are very similar in accumulation structure as well a how deep both capitulations went. Don't get me wrong, i don't thing this is a true bottom formation like it was in 2015 leading to the next bull run, but only forming a local bottom that just happens to be very similar as one in 2015. After completing this accumulation i still expect BTC will go into a retracement that can still take us slowly back in 45-50k area, before continuing the falL.
From the comparison with todays price action wth the 2015 one, we can also expect btc to still reach the top of the range, make even higher local high (green box) and still then fall down to the bottom of the range (orange box), before starting a long awaited retracement.
It all depends on a macro picture of the economy by itself. Will see what the stock market does first, but charts do show a local bottom being set for now.
DISCLAMER:
I am not a financial advisor so non of this should be taken as a financial advise. Be well.

What's next for DXY?
Based on the potential 2013 cycle and fed balance sheet - anticipation is that dxy should sideway to avoid extremes - - we can't move down as we have inflation and we can't move agressively a lot more up as we will kill the markets.
Dxy should stay within the projected range with slight downish bias for the next few weeks - but first emaflow entries will produce a buy signal which likely causes a test upwards which will reject and take us lower near the bottom of the green zone.
Highly suggest to check as it includes all the charts that explain the mindset behind this.
