HTZ Long Idea WC 27th JuneHertz has been moving sideways really since February. Holding up well in overall bearish conditions. Now showing bullish divergence indicating that momentum could be about to turn. There is horizontal support around the $15 mark, making this a lovely risk to reward play. There is resistance around the $20 and $24 mark but this has plenty of range for a longer term play. Keep it on your watchlist for the break above $20.
Range

EURUSD trading sideways EURUSD is trading between the levels of 1,05-1,06 during the whole week.
Right now, we don't really have any good trend trading opportunities.
We're still looking for selling opportunities as our main idea.
We are only selling if price breaks below the previous lows or if it pushes above 1.06 and then we see a reversal.
We are not looking to enter any trades at current price levels.

The range we are in. Failed H&S into W. Possible range Break-outHello again!
Here's the whole clear picture so far:
- We were in a bigger range (20k - 22.5k)
- As soon as we lost 20k (bottom of that range) we broke down to 17600 (which is the daily low of 11th December 2020 - the last red day we printed before the beginning of the new bull market. Those numbers are not random. More on that in another post!!)
- After breaking down we managed to reclaim the bottom of the range and we've been ranging between 20k and 21.6k with the mid of the range being 20.8k
- In fact, 20.8k (the mid of the range) has worked as a pivot point
- It first helped the price form a Head & Shoulders pattern, leading everyone into thinking that we will go much lower once we lose 20k (look at green pattern)
- However, H&S patterns usually do fake breakdowns just to stop all the longs and trap shorts. Then they reverse.
- In fact, H&S breakdown was reclaimed and on top of that we immediately converted the structure into a W bottoming pattern (look at pink pattern)
- 21.6k is the "moment of truth" point. Should the price breaks above I can see us teleporting to 22.5k with the power of millions of short squeezes.
- 20.8 is a very important price level. It worked as a pivot point and it will show us if we are truly going to break out of this range (20-21.6) and move towards 20.5k or we are going back to 20k, potentially even lower. In other words, 20.8k is your invalidation point.
Now look at the daily candle.
My guess is that the new day open (25th June) is going to print its lower wick into the 20.8k before we really try to break 21.6k
Entry 20.8k. Tight stop loss below this. TP either 21.6k or 22.5k
If we lose 20.8 you can short to 20k (or just open long 20.8k and hedge with short at 21.6)
Good luck!


GBPNZD 63 day trendSince April 13th, we have seen the GBPNZD trade between a range of 1.920 and 1.960.
Quarterly trends:
It's been 504- days (8 quarters) since the price has moved above this price briefly, creating a wick on larger time frames. There have been 13 instances in the past 53 days where the stock price has been at or above the 252-day average price (4 quarters), which represents a 0.245% portion of time. It is evident from the 189- days (3 quarters) that the price is stagnant and there is a possibility of a one-day reversal.
Vix Fix:
Vix fix suggests that price contraction into smaller volatility channels is continuing. This could be interpreted as bullish for the GBPNZD, even though the 2022 season looks bearish overall. What this means for traders is that we should look for opportunities to sell at high points, and be alert for sharp reversals around 1.920. The 63-day EMA on the VIX Fix indicates that the sell-offs are becoming less severe as we move into the second quarter of the year. This can be seen as a result of the weak uptrend we have been observing.
The next 63 days
The 63-day outlook shows a low of 1.903 and a high of 1.980. I am looking for a break of the April 13th range and ultimately a short trade. However, this will not be confirmed until the price breaks and confirms below 1.903.

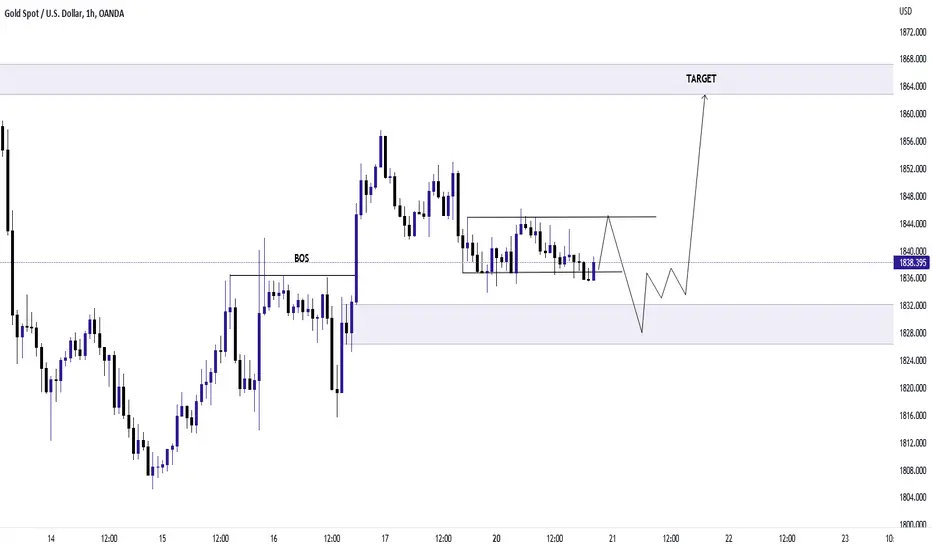
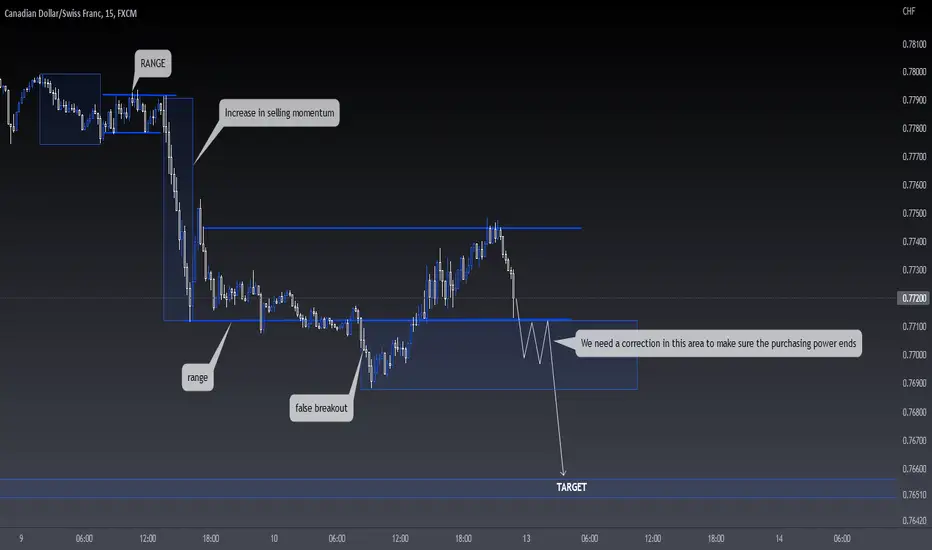
CAD JPY long There is an increase in the momentum of buyers and a decrease in the momentum of sellers
and buyers appeared and the price is now moving in a range
Logically, the buyers outperform and the price rises to break the top, and maybe to the 127 Fibonacci level

bearish trend on usoilwe are see a break of a strong range after 78 day and also the price break a strong support so we can see usoil on a new level at 94 dollar
stay safe...

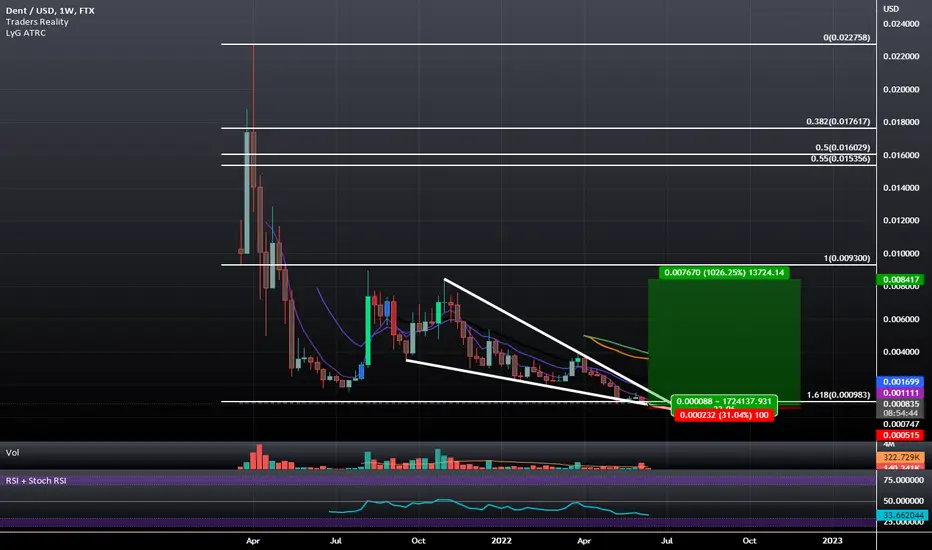
Falling Wedge Double BottomThere is a Falling Wedge Visible on the Daily and Weekly and on the Daily Timeframe we have a Double Bottom With Bullish Divergence present at the Demand Line of this Wedge as seen here:
I will mainly target around 0.9 cents which is the top of the range we have formed on the weekly but overall this has potential to go beyond the main target and hit 1.7 cents if it breaks the range.
Bitcoin long from buying tail`I am now waiting for the order flow to confirm that there is a possible long here and then i will place a position.
Make sure you check the order flow before you get in a position here

BTCUSDSometimes it's not a Gartley. Sometimes the price is within a range. Support and resistance is all there is. Finding the bottom and top is the key to the, "Buy low, sell low". Hyperfocus, stay focused.


$ALGO at key levelThe point of control level is $0.3005 very significant. Dating back to Algorand 's inception, this has been a key level of resistance/support. ALGO stopped nearly to the penny on the volume shelf at the bottom and bounced off it multiple times.
Previously it was resistance, now it seems to have become support. ALGO seems to be running out of sellers. Soon the bulls will take control. Targeting the $0.5380 level which would be a 50% return and the VWAP from the most recent high at $1.0172 would be a nearly 200% gain.
Algorand is green, efficient, and has extremely low gas fees (I believe it's $.001 please correct me if I'm mistaken).

