THE OPEN NETWORK (TON 4H) The Open Network (TON) is designed as a distributed supercomputer, or “superserver,” intended to provide a variety of products and services to contribute to the development of the decentralized vision for the new internet. A decentralized and open internet, created by the community using a technology designed by Telegram. With an increasing TVL and a growing ecosystem the future looks good for TON.
The TON chart is a very interesting one. Over the last few month it has performed very well despite the overall market conditions.
A near 300% increase since FEB compared to 45% for BTC, and has maintained most of its gains when compared to other altcoins.
The TONBTC chart is one of the strongest out there, massively outperforming BTC in the recent months to maintain a bullish trend.
Both BTC & USDT pairs are above the 4H 200 EMA.
CERTIK top 10 on every category ( Fundamental 80, Operational 92.19, Governance 94.73, Market 95.94, Community 95.38, Code 97.31).
My trade idea based on these points is simple:
- Flipping the 4H 200 EMA as support.
- Flipping the range MIDPOINT as support.
- Respecting the diagonal support trendline.
- After breaking out of the bearish trendline, now retesting it as support.
-The STOP LOSS comes into play once all of the above areas of support and confluence are broken, the trade is obviously invalid at this level once losing market structure, range midpoint & Key S/R level.
The overall trade R:R I feel is good at this point purely because of the clear support areas at this level. I think a lot of this trade will require BTC to behave and continue its recovery, it may be bearish for the BTC pair but not the Stable pair.
Range

GOLD → Retest of the liquidity area in front of the bullrun ↑ FX:XAUUSD in the correction phase. The market is testing the support and liquidity zone within the counter-trend correction. The dollar may continue its downward phase, which would be a bullish leverage for the gold market
In the week ahead it is worth paying attention to the S&P PMI to be released on Wednesday, GDP and Initial Jobless Claims on Thursday and PCE on Friday.
Trump, as the presidential race progresses, has a growing chance of winning. If that happens, gold and cryptocurrencies will benefit on that backdrop. There is not much news today, so gold may test the liquidity area hiding behind 2390-2400. It is also worth paying attention to the new range of 2492 - 2390. Accordingly, if the bulls hold the defense above the lower boundary of this range, we will get a new trading plane.
Resistance levels: 2411, 2420, 2430
Support levels: 2392, 2386
When trading gold, I recommend to always pay attention to the behavior of the dollar index, as it plays the main role in the market. Accordingly, if the dollar will begin to decline to the support with the purpose of breakthrough, in this case we should expect further growth in the gold market
Rate, share your opinion and questions, let's discuss what's going on with ★ GOLD ;)
Regards R. Linda!

HelenP. I Euro can rebound up from support zone to $1.0915Hi folks today I'm prepared for you Euro analytics. If we look at the chart we can see how the price reached support 2, which coincided with the support zone and soon broke this level. After this movement, the price tried to grow but failed, made the first gap, and fell to support 2, which coincided with the trend line. Then Euro turned around and in a short time rose higher than support 1, which coincided with one more support zone, after which fell to this area, and some time traded inside. Later price broke support 1, and entered to consolidation, where it made a second gap and then made a correction to the support level. After this, the EUR rebounded up to the top part of the range and then turned around and dropped to the support level, thereby breaking the trend line. Now price continues to trades near this level to this day and I expect that EURUSD will rebound up from the support zone to the trend line, That's why I set my goal at 1.0915 points, which coincided with this line. If you like my analytics you may support me with your like/comment ❤️

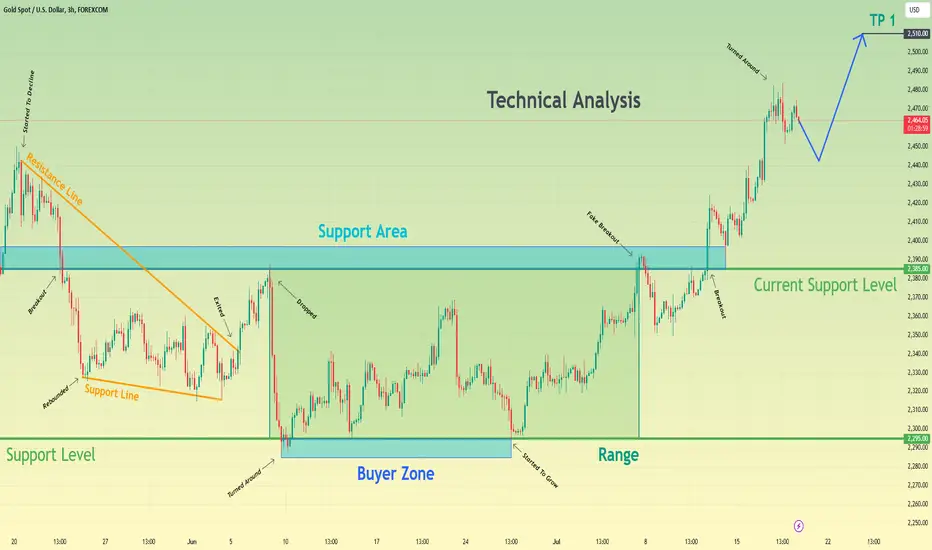
After impulse up, Gold can small correct and continues to riseHello traders, I want share with you my opinion about Gold. By observing the chart, we can see that the price rebounded from the current support level, which coincided with the support area, and then entered to wedge, when it turned around from the resistance line and started to decline. In a short time, the price fell to the support line of the wedge, breaking the 2385 level. Then the price rebounded from the support line and continued to decline in the wedge and some time later it turned around and made impulse up to the current support level, thereby exiting from the wedge, after which dropped to the 2295 level and started to trades inside the range. In range, Gold tried to grow from the 2295 level, but later it fell back, after which at once started to grow to the current support level. When the price reached the 2385 level, it exited from range and made a fake breakout of the 2385 support level. After this movement, Gold made a strong impulse, thereby finally breaking the 2385 level and rising to 2483 points, but recently started to decline. So, I think that Gold can make small correction firstly and then continue to move up. For this case, I set my TP at 2510 points. Please share this idea with your friends and click Boost 🚀
BTCUSDT. What would increase the likelihood of a new ATH?If the seller reaches the range of 54,000-55,000 (taking liquidity below 59000), and the buyer returns the price back into sideways movement (above 59,000), then the likelihood of seeing new buyer momentum with a new maximum significantly increase.

ES Range Expectation for PPI and the Friday SessionToday we're looking at ES e-mini futures for an expectation of the amount of range we could do. We take a look at both the upside and downside to get a view on where the boundaries of normality would be to aid us in framing intraday trades.
Yesterday's CPI Inflation data provided us with the 2nd large range day in a row (big range days tend to cluster) and today we're about to get the PPI data that usually follows the day after but is a bit more forward looking on inflation expectations. In short it could be another catalyst for another large range day.

Dow Jones Dollar Index daily TF The Dow Jones has exhibited a bearish trend for the past nine days, following a break from its bullish channel. Historically, during its last two bullish channel periods, the index experienced a bearish phase lasting 7 to 8 days before finding support and moving higher. I anticipate a similar pattern this time, expecting the index to reach one of my areas of interest before initiating a downward swing. Once it undergoes a healthy pullback and begins to decline, a close below 12,963 will signal a significantly bearish outlook.

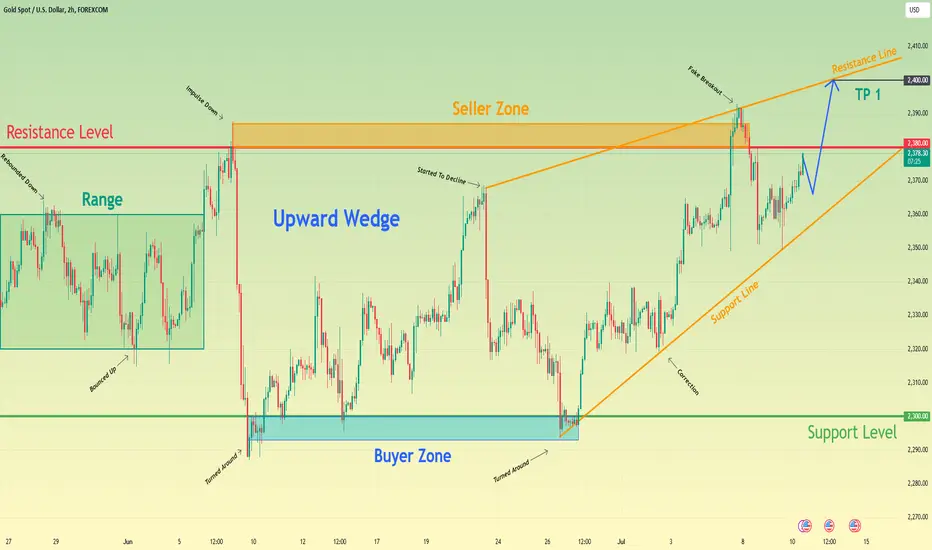
Gold can break resistance level and continue to move upHello traders, I want share with you my opinion about Gold. Observing the chart, we can see that the price some days ago entered to range, where some time traded and then rose to the top part of this pattern, but at once turned around and made a correction movement. After this movement, the price rebounded and in a short time rose to the resistance level, which coincided with the seller zone, thereby exiting from the range and even later breaking the 2380 level. But at once Gold turned around and made impulse down to the buyer zone, which coincided with the support level. Then the price turned around and started to grow to 2367 points, after which it turned around and quickly declined back to the buyer zone. Also, the price started to trades inside the wedge, where it rebounded from the support line, which is located in the buyer zone, and in a short time rose to the resistance level. Gold made a fake breakout of this level and recently fell below the 2380 level, breaking it again. Then it fell to the support line of the wedge and started to grow, so, in my opinion, the price can make little correction and then reach the resistance level and break it. After this movement, Gold will continue to grow to the resistance line of the wedge. For this reason, I set my TP at 2380 points. Please share this idea with your friends and click Boost 🚀
Euro can continue to decline to support level in rangeHello traders, I want share with you my opinion about Euro. By observing the chart, we can see that the price entered to wedge, where it at once made a downward impulse from the resistance line to the support line, breaking 1.0845 with 1.0690 levels. But soon, the price turned around and in a short time rose higher than the 1.0690 level from the support line of the wedge, breaking this level again. Next, the price quickly rose to the resistance level, which coincided with the seller zone and broke it too, after which some time traded between this level. Later price reached the resistance line of the wedge, turned around, and made a strong impulse down to the support level, breaking the 1.0845 level, and exited from the wedge. Also, Eur made the first gap and started to trades inside the range, where it made one more gap. After this, the price rose to a resistance level and a not long time rebounded and started to decline, so, in my opinion, the Euro can continue to decline to a support level in the range. For this case, I set my TP at 1.0690 support level. Please share this idea with your friends and click Boost 🚀

Bitcoin can reach resistance area and then start to declineHello traders, I want share with you my opinion about Bitcoin. Looking at the chart, we can see how the price some time traded in the seller zone and then broke the 63800 level, after which fell to the current resistance level. After this, the price started to trades inside the range, where it rebounded from the 59100 level and in a short time rose to the 63800 level, but then it turned around and started to decline. The price quickly fell to the current resistance level, broke it, thereby exiting from the range also, and continued to fall. When BTC declined to 53500 points, it turned around and started to grow inside the upward channel, where it in a short time rose to the resistance line of the channel. After this movement, the price rebounded and made a correction to the support line, after which BTC bounced and recently rose almost to the resistance area, which coincided with the current resistance level. In my opinion, the price can reach the resistance area, after which Bitcoin will turn around and start to decline to support line of the channel. For this case, I set my TP at 54750 points, which coincided with this line. Please share this idea with your friends and click Boost 🚀

UK100UK100 is trading in range bound with 150 pips range.
some time ranges are the best things to play just buy the support and sell the resistance.
as this one is 100 pips range which can deliver fine risk to reward.
currently the price is at support level and being rejected due to buying pressure.
will the pair head back to resistance area ?
what you guys think of this idea ?

01/07/24 Weekly outlookLast weeks high: $63,700.01
Last weeks low: $58,451.16
Midpoint: $61,075.58
Q2 ENDS - Q3 BEGINS
After a rough quarter of sideways chop, ranging between ~$56K-73K it's safe to say that the last 3 months has been a tough one for the crypto markets. Despite the frustration with price it's important to realise the positive elements of the last quarter. The ETH ETF approval, THE HALVING, consolidation at the '21 ATH level are all bullish for the industry as a whole.
As the weekly, monthly and quarterly all close, July 1st almost feels like a new chapter, one that needs to begin strong. Last week we saw BTC dip to the 1D 200EMA for the first time this calendar year. This is not uncommon in a Bullrun, a bounce off that moving average while it is trending up is often a good R:R entry level for a HTF position. This lines up well with how last week played out and until price breaks below the moving average and changes its trend direction, I do not believe we have reason to panic.
As the first few trading hours of the new quarter have completed we can see that there is a clear S/R level at the 0.75 range line that was flipped, I would like to see a positive reaction off any retest of that level. As I stated before starting a new quarter positively can have a positive impact. Staying above $62,400 is important in the short term, $65,000 is resistance and an important S/R zone.
In the altcoin market tomorrow is an exciting day as the ETH ETF goes live , we've seen what an ETF can do with BTC and potentially the same thing can happen with ETH, the difference in my opinion is that institutions and larger investors were all expecting the BTC ETF to be approved when it did. However, I do not believe that those same players expected ETH ETF's to be approved as soon as they did. It is no secret that the SEC has been arguing that Ethereum is a security and therefor comes under the SEC's regulatory power which was always a point of contention and made ETF approval unlikely. Now that the probe has been dropped by the SEC and they have relinquished power over the cryptocurrency, the ETF is set to go live and I believe the big players just weren't prepared for this to happen so quickly hence the delay in price movement comparable to BTC. We shall see if this delayed response continues as trading goes live but I have no doubt that over the long term this is a net positive for ETH and the altcoin market.
In the broader alt space we can see clear signs of seller exhaustion . BTC dropped 10% last week and most alts didn't react anywhere near as negatively as this move usually does. That to me is a clear sign that sellers are all sold out and that buyers are happy to DCA in at these levels to balance price.
This week I am keeping an eye on those altcoins that outperformed BTC last week on their BTC pairs with good fundamentals as these alts will perform the best on the next rally. ETHEREUM ETF trading is the main talking point of the week and I will be monitoring that closely.
GOOD LUCK FOR Q3

Euro can rebound from resistance line of wedge and start to fallHello traders, I want share with you my opinion about Euro. Looking at the chart, we can see how the price some time ago broke the current support level, which coincided with the support area and dropped to the 1.0680 support level. After this, the price started to trades inside the range, where it at once rebounded from the 1.0680 level and almost rose to the top part of the range, but then it turned around and fell back to the support level, which coincided with the buyer zone. Next, the price repeated this movement, after which the EUR rebounded from the buyer zone and rose to the top part of the range, making a gap also. Then price exited from the range, entered to upward wedge, and made at once correction movement to support line of this pattern. After this, the Euro rebounded from this line and quickly rose to the current support level, broke it, and continued to move up. Now, it trades higher than the support area near the resistance line of the pennant. So, in my opinion, the Euro can reach the resistance line again and then rebound down to the support level, thereby exiting from the wedge. Then EURUSD can break this level and continue to fall, therefore I set my TP at 1.0770 points. Please share this idea with your friends and click Boost 🚀

BNBUSDT. Trading opportunityOn the daily timeframe, the sideways movement that began in March continues. Yesterday, the seller pushed the price back below the upper boundary of the range at 645.2. The closing candle had a good spread and volume, confirming the seller's strength. The current seller's vector is 9-10, with a potential target at 508. The nearest obstacle for the seller is at 586.5. The price is close to 50% of the last buyer's impulse (608.8), from which a buyer's movement might start.
On the hourly timeframe, there is a short-term downtrend. The last seller's impulse started at 653.7, and a seller's zone has formed at the base of this impulse (indicated by the red rectangle on the chart). It is preferable to look for selling opportunities in this seller's zone (645-654). However, the price may not return to this zone.
Currently, selling opportunities can be sought if the seller defends the level of 645.2, as an idea to realize the seller's vector 9-10 within the daily timeframe range.
There is no context for buying at the moment.

5ADR - Average Range of Last 5 CandlesticksAverage Daily Range (ADR) Indicator for the Last 5 Days
This script calculates the Average Daily Range (ADR) for the last 5 trading days. It helps traders to understand the average movement in pips, providing insights into potential price movements.
How to Use:
Set Chart to Daily Timeframe : Ensure your chart is set to the daily timeframe.
Hover Over Previous Day : To see the ADR for today, hover your mouse over the previous trading day.
For example, if today is Tuesday, hover over Monday to see the ADR for Tuesday.
Read ADR in Blue : The ADR will be displayed on the left side of the chart in blue color.

Bitcoin can make correction to support level and then bounce upHello traders, I want share with you my opinion about Bitcoin. Looking at the chart, we can see how the price a few moments ago entered to the range, where it some time traded near the resistance level, which coincided with the seller zone and then rebounded up to the top part of the range. After this movement, the price turned around and quickly declined to the 67600 level, and later broke it, thereby exiting from the range also and continuing to decline inside the downward channel. Inside the channel, the price fell until to the support level, which coincided with the buyer zone, and then made a fake breakout of this level, thereby exiting from the channel. After this, the price tried to grow, but soon turned around and fell back to the 60200 support level. But a not long time ago price turned around and started to grow, so, at the moment I think that BTC can make a correction to the support level again and then turn around and continue to grow. For this case, I set my TP at 65000 points. Please share this idea with your friends and click Boost 🚀

Gold can make small movement down and then continue to riseHello traders, I want share with you my opinion about Gold. Observing the chart, we can see that the price some time ago entered to upward channel and started to grow from the support level, which coincided with the buyer zone. Later price reached the resistance level, which coincided with the seller zone and broke it, after which it rose to the resistance line of the channel and then turned around. Then XAU made a downward impulse, thereby exiting from the channel and entering to range, where it some time traded and soon reached the 2385 level, which is the top part of the range also. After this, the price turned around and fell to the buyer zone, after which turned around and bounced up to 2368 points, but couldn't fixed and at once made a correction movement to the support level. A few moments ago price rebounded from this level and started to grow. So, in my opinion, the price can make a small movement down and then continue to move up. For this case, I set my TP near the resistance level of 2370 points. Please share this idea with your friends and click Boost 🚀

Euro can rebound from resistance level to 1.0670 support levelHello traders, I want share with you my opinion about Euro. By observing the chart, we can see that the price started to grow inside the upward channel, where it at once rebounded from the resistance line to the 1.0670 support level, after which it bounced and continued to grow. In a short time, the price rose to the 1.0800 resistance level, which coincided with the seller zone and soon broke this level and later reached the resistance line of the channel. After this, the Euro rebounded from this line and exited from the channel, starting to trades inside range. Inside the range, the price declined to the seller zone and even made a fake breakout of the 1.0800 resistance level, after which quickly rose to the top part of the range, turned around, and then made a strong downward impulse. Euro exited from the range, broke the 1.0800 level, and even formed the first gap, after which the price little declined and then bounced up to the resistance line. After this movement, the EUR started to decline and in a short time fell to the 1.0670 support level, which coincided with the buyer zone and some time tired to grow, but only third try it make an upward impulse and rose higher than the resistance line. At the moment, the price continues to move up, so, in my opinion, the Euro can reach a resistance level and then start to decline to the 1.0670 support level. For this case, I set my TP at this level. Please share this idea with your friends and click Boost 🚀

KOG - Trading the Range!RANGE BOX:
When the price is in a ranging market look for date of when the price was last in its range. Example above shows we had the range, a breakout above and then a break back inside the range. Draw a box around the range and then identify the buy area and the sell area. This stops you from trading in the middle of the range and getting chopped up by the market. Always wait for the lower levels to buy and the higher levels to sell. If either level breaks wait for the support or resistance to turn into support or resistance. This give you an indication of potential further movement in the direction of the breakout.
Within the range you will find trends, smaller support and resistance levels and chart patterns. This will further help you to trade within that range of scalp in between levels. Identifying these levels and patterns also give you a view of potential future movement. Again, this helps towards making sure you don’t get caught trading in the middle and getting caught the wrong of the market.
Now we’ve updated the range to present day and it gives us a clearer picture of what the market has been trying to do since October 2021. We can the H&S back in November which as yet hasn’t been tested, with patterns like this they don’t always get a retest but on most occasion the price will come back to test it. This tells us that if we break above the range high again there is potential for the price to test that 1860 at some point.
We can also see that there is a double top recently which caused the price to break back inside the range. Again, on most occasions its likely the price will want to test the pattern or neckline at some point. This gives us an indication of potential movement in the direction of the double top and if we break the double top (we fail a triple top) then there is a chance we could go further up based on support below to test the shoulder of the H&S from Oct. We then add our every day analysis, support and resistance levels and smaller timeframes to further confirm movement and potential challenges on different price regions.
If we now look at the bottom of the chart we have one significant area of interest. That’s the buy area we have been using to take the long trades within the range. We can see its given us a triple bottom in this region where we have seen rejection in price. This area has worked well for Bulls but now we will need to be cautious if the price comes down to challenge this area again. Based on what we mentioned above with patterns its likely the price will want to come down to test this level again at some point. Keeping that in mind we also have to be cautious here as the level has been rejected 3 times forming the triple bottom. The is huge potential now for the next test on this level to break this level aggressively which could take us down towards the lower key support of 1730-20.
Hope this helps traders, its more an educational post rather than our analysis but please do back test it and see how it works for you. Any questions please do ask, we try our best to answer everyone.
See you tomorrow for the KOG report.
As always, trade safe.
KOG

Euro can fall to support level, break it and continue to declineHello traders, I want share with you my opinion about Euro. Looking at the chart, we can see how the price some time ago declined to the resistance level, which coincided with the seller zone, broke it, and fell a little lower than1.0755 level. But later price turned around and made a strong impulse up to the support line, breaking the resistance level again, after which the price started to decline. In a short time, the EUR fell to the 1.0755 level, broke it, and entered to range, where it declined to the support level, which coincided with the buyer zone and even made a fake breakout of it. Then price quickly rose to the resistance level, which coincided with the seller zone, breaking the support level, but at once rebounded and fell back to the 1.0680 level. After this, the EUR rebounded up, broke the support line, and rose almost to the top part of the range, after which turned around and fell to the buyer zone. A not long time ago price started to grow and in a short time backed up to range, where it now continues to grow. In my opinion, the price can rise a little more and then start to decline to the support level, after which the EUR will break this level, thereby exiting from the range and continuing to decline. So, that's why I set my TP at 1.0650 points. Please share this idea with your friends and click Boost 🚀

ETH. Buying opportunitiesHi traders and investors!
The seller's vector 9-10 reached its mandatory target in the sideways range on the daily TF from the previous review. It's time to update the possible scenarios.
Daily Timeframe Analysis
On the daily timeframe, the price has formed a sideways range that began in February 2024. The seller's vector 9-10 reached its mandatory target with a low of 3240, and now the buyer's vector 10-11 is relevant with a potential target of 3977. The first obstacle for the buyer is the high of the last seller's bar at 3435. The price has not yet interacted with this level. Since the price is at the lower boundary of the sideways range on the daily timeframe, it makes sense to start looking for buying opportunities. Let's look at the lower timeframe.
Hourly Timeframe Analysis
On the hourly timeframe, the price has formed a sideways range. The seller's vector 4-5 exited the boundary of the range, and then the buyer absorbed the attacking range boundary candle of the seller, forming a buyer's zone at the end of the seller's vector (blue rectangle on the chart). Currently, the buyer's vector 5-6 is relevant with a potential target of 3653. The price is at the lower boundary of the sideways range on the hourly timeframe, so it makes sense to start looking for buying opportunities.
Buying opportunities
Buying opportunities can be sought from the idea of realizing the buyer's vector 10-11 in the sideways range on the daily timeframe or from the idea of realizing the buyer's vector 5-6 in the sideways range on the hourly timeframe.
From the protection by the buyer of the lower boundary of the sideways range at 3362 on the hourly timeframe.
From the protection by the buyer of the level 3345, which is the test of the seller of the formed buyer's zone at the end of the seller's vector 4-5 on the hourly timeframe.
From the protection by the buyer of the level 3240, which is the test of the seller of the formed buyer's zone at the base of the buyer's vector 8-9 on the daily timeframe.
After the buyer absorbs the daily candle of June 24, 2024 on the daily timeframe (conservative strategy).
Please don't forget to like, comment and follow to support me, I really appreciate it!

BTC at the bottom of week range!Bitcoin hit the bottom of the range ✅ Alarm was right pointing for range bottom at ~58k, as BTC dipped to 58414 on that move.
Now the main question - is it over? Shortly - if you are a respected TA, you can't say so yet. Why? Because week candle is only developing, so we won't have any clarity till next week close at least. Day candle shown nice bearish impulse with long tail, which can be taken as a first step of a bounce pattern, but to confirm it we'll need another 1-2 Day candle to close. Which brings us back to the idea, that this week it's all about guessing, but no mindful conclusions.
Week close above ~60622-59600 will increase chances for a bounce from range bottom. Close below will keep momentum to dip lower. That is the only thing we can say now for sure.
Nearest liquidity pools:
above - 61840 / 62440 / 63260 / 64920
below - 60235 / 59820 / 59460 / 58040
Lines on the chart:
🔸67577 - May close
🔸63195 - week open
🔸60651 - April close
🔸59112 - March low
🔸56537 - May low
🔸53245 - Nov'21 low
Trend: D 🔽 W 🔼 M 🔼
🤑 F&G: 30 < 51 < 53 < 63 < 64

BTCUSDT. Trading opportunityDaily Timeframe Analysis:
The price has been in a sideways movement on the daily timeframe since February 2024. The current buyer's vector 10-11 has a potential target of 72797, but the buyer has not yet reached this goal. The seller has formed a selling zone at the end of the unfinished buyer's vector 10-11 (red rectangle on the chart, lower boundary of the seller's zone at 66060.31).
Currently, the price is squeezed between two levels: 64602.77, which represents the buyer's defense of volume accumulation at the lower boundary of the daily range, and 67298.81, which represents the seller's defense of the selling zone.
Hourly Timeframe Analysis:
On the hourly timeframe, the price has formed a sideways movement. The current buyer's vector 9-10 has a potential target of 67298.81 (!). The upper boundary of the range is at 67370.24, and the lower boundary is at 65078.
Buying Strategy:
From the idea of realizing the current buyer's vector 9-10 within the hourly range, with a potential target of 67298.81.
From the idea of realizing the buyer's vector 10-11 within the daily range - when the price breaks above the upper boundary of the hourly range (67370.24) and the buyer defends this breakout. The potential target is 72797.
Selling Strategy:
From the idea of realizing the seller's vector 10-11 within the hourly range from the upper boundary of the range (67298.81, 67370.24). The potential target is currently unknown and will be formed after the realization of the buyer's vector 9-10.
From the idea of buyer weakness on the daily timeframe - when the price breaks below the lower boundary of the hourly range and the level 64060, and the seller defends this breakout. The potential target could be 60200.
