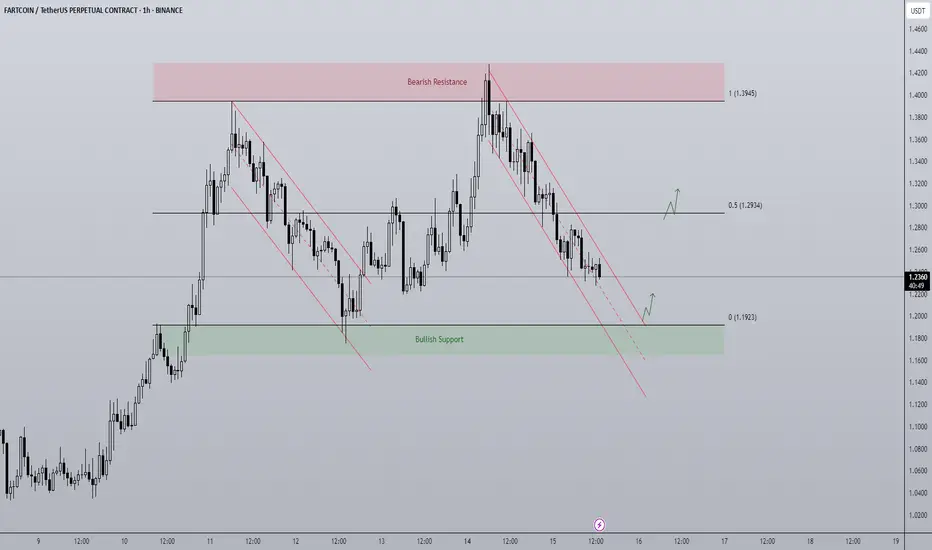
Fartcoin - Rangebound repeat? A BTC makes new highs attention has turned towards altcoins to play catch up.
FARTCOIN has been a top performer of the last month and currently on the 1D timeframe finds itself in a rangebound environment capped between $1.1923 - $1.3945. The end of last week price trended down in a bearish channel from top to bottom and it looks to be doing the same currently. As the supply zone above the range high got swept, price printed a SFP getting back inside the range and began trending down, for me there are two actionable long entries here:
- A range low bounce + breakout of trend channel would be an ideal long entry. An area of clear support coupled with a breakout is a historically strong setup with a clear invalidation if price breaks below the range and gets accepted.
- A more aggressive but potentially less ideal setup would be a breakout of the downtrend before hitting range lows. Higher risk as the level of support is not as defined but in the more risk-on environment crypto is currently in, the chance of major support levels being front run does go up as buyers become more impatient when FOMO grows.
The midpoint is key level to look out for too as a reclaim would mean a run at the highs, rejection opens the door to retest the lows.
Rangebound
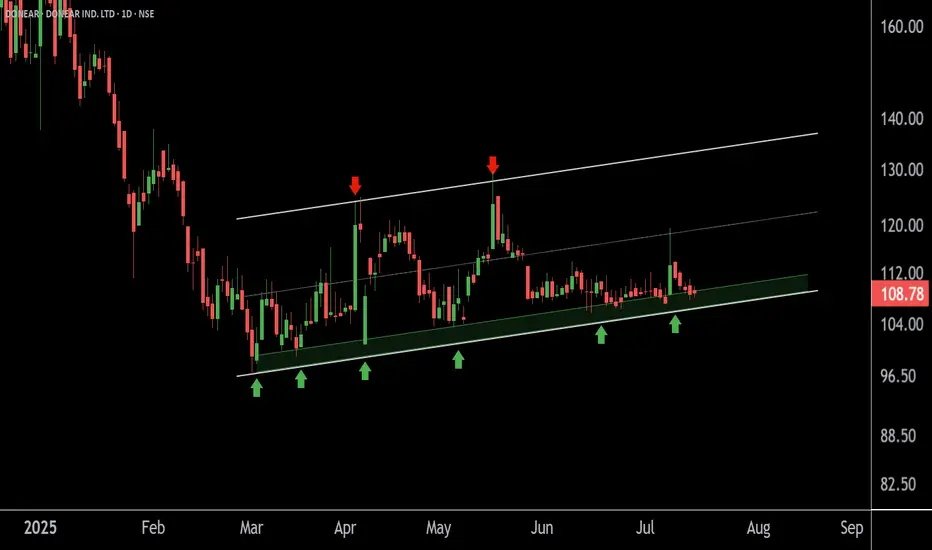
DONEAR at Best Support Zone !!This is the daily chart of Donear Industries.
Donear is moving in well defined parallel channel having a good support zone near 105 level.
if this level is sustain , then we may see higher prices in Donear .
Thank You !!
30/06/25 Weekly OutlookLast weeks high: $108,531.02
Last weeks low: $99,592.69
Midpoint: $104,061.86
Overall a positive week for BTC in isolation as price moves steadily all week reclaiming the losses made in the week from the 16th-23rd June. This comes after a $2.2B BTC ETF weekly inflow, the 3rd consecutive week of net inflows.
Having now hit the key S/R level of $108,500 it will be interesting to see where BTC goes from here. Jumping up above the level will require a lot from the bulls as ATH is within touching distance and so buying into major resistance is a tough ask. We also have Geo-political uncertainties to add to the situation, one bad tweet is all it takes sometimes to do a lot of damage.
On the other hand the SNP500 hits new ATH in the same conditions and so BTC is more than capable of doing the same.
So far in the first hours of this weeks trading we do have a SFP of the weekly high setup, not ideal for the bulls in any way and so from here the a retest of the range quarters, midpoint being the key area would make sense, invalidation would be a clean break above weekly high with acceptance and strong volume on the move to break the rangebound/choppy environment.
There is also the "window dressing" element to the months &quarter end today. History shows a de-risking going into these events and more money flowing back into risk-on assets in the days following monthly/ quarterly end. For that reason a bullish move (if there were to be one) would come later in the week IMO.
Good luck this week everybody!

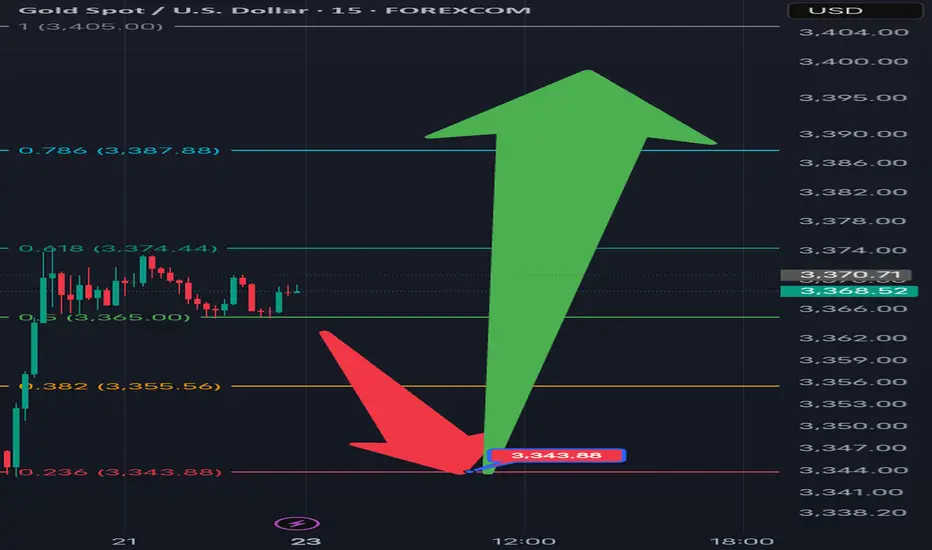
[XAUSD] Potential Bearish Move During Asian SessionAlthough sentiment going into Monday is broadly bullish , driven by escalating geopolitical tension and anticipation of a breakout, XAU/USD may still open with a brief pullback , not because traders are ignoring the situation, but because markets often test the conviction of retail and early-positioned bulls before making a decisive move.
When gold opens during the Asian session, a wave of participants—already leaning bullish—may rush in with early long entries. However, smart money and institutional traders often prefer to buy on value , not at the highs. So instead of chasing price above $3,368–$3,370 immediately, they may allow or even trigger a short-term flush— pushing price down to retest key support at $3,343.88 . This level aligns with prior structure and psychological comfort: it offers an opportunity for a cleaner re-entry , or for those who missed the move on Friday to establish positions.
This decline isn't a breakdown, but a strategic sweep of weak hands and stop losses —a classic fake-out move. Once that level is tagged and buyers step back in, the market quickly finds footing. With news-driven urgency and broader sentiment tilting toward risk aversion, gold recovers fast. By late Asia or early London hours, price grinds back toward the $3,385–$3,390 zone , right below the known bullish breakout ceiling.
This kind of "bearish tap then bullish reclaim" sequence builds the technical base necessary for a stronger breakout attempt later in the session—shaking out early longs and inviting smarter buying near support rather than resistance.
Range breakout | Impulse of bull starthi Traders,
1. The swing formation is solid
2. BEL has taken the ascending trend line support.
3. The the range bound is weekly has broke upward, leading to impulse wave of bull trend.
4. Projected Target 1 and Target 2 with 20% and 40% returns from the CMP with 1:81 and 1:4.01 risk reward ratio respectively.

26/05/25 Weekly OutlookLast weeks high: $111,965.73
Last weeks low: $101,994.78
Midpoint: $106,980.26
New BTC ATHs! Well done to those who capitalized on the move and continue to believe in this Bitcoin.
For the last two weekly outlooks I have talked about the pattern of consolidation for 1 week --> expansion the next. Last week We got our expansion week right on queue and this time around BTC made a new ATH hitting just shy of $112,000.
Should the pattern continue this week will be a week of consolidation/chop, however this week is different now that we're at ATH levels. My gut says a pullback is coming after such an aggressive move up with almost no pullbacks at all.
Should BTCs price drop below the Midpoint I think there will be a big struggle to continue this rally in the short term. Initially target would be weekly low and main HTF target would be $97,000 IMO. That would be a healthy pullback to continue the rally.
For the bulls you don't want momentum to stop in the short term, flipping $110,450 and weekly high would put BTC back into price discovery, once any asset is in price discovery it's very difficult to tell where the sell pressure will come from and so shorting becomes very risky.

NQ Power Range Report with FIB Ext - 5/8/2025 SessionCME_MINI:NQM2025
- PR High: 19957.25
- PR Low: 19910.75
- NZ Spread: 103.75
Key scheduled economic events:
08:30 | Initial Jobless Claims
13:00 | 30-Year Bond Auction
Auction remains inside week range, 19920 to 20200
- Contained inside Friday's range, advertising return to 20280 high
- Strong value increase through Asian hours
Session Open Stats (As of 12:35 AM 5/8)
- Session Open ATR: 578.32
- Volume: 43K
- Open Int: 257K
- Trend Grade: Bear
- From BA ATH: -10.9% (Rounded)
Key Levels (Rounded - Think of these as ranges)
- Long: 20954
- Mid: 19246
- Short: 16963
Keep in mind this is not speculation or a prediction. Only a report of the Power Range with Fib extensions for target hunting. Do your DD! You determine your risk tolerance. You are fully capable of making your own decisions.
BA: Back Adjusted
BuZ/BeZ: Bull Zone / Bear Zone
NZ: Neutral Zone

VeChain Range & Structure AnalysisBINANCE:VETUSDT has been range-bound since November 2023, with very clear levels.
Key Zones
• Weekly Demand Zone: $0.019–$0.022 — major support with multiple rebounds.
• Weekly Supply Zone: $0.045–$0.055 — strong resistance dating back to early 2024.
• Midrange / HVN: ~$0.037 — heavy volume area and likely resistance if tested.
• Local Resistance: $0.027 — recent swing high + S/R since December 2023. A daily close above could mark a change of character and a shift to a bullish bias.
Possible Scenario
• With a daily close above $0.027, VET may revisit the $0.055 range high — with potential resistance at the midline along the way.
• If $0.055 is reached and followed by a sharp rejection, we might start seeing the formation of a macro Head & Shoulders — with $0.019 as a key neckline.
• Breakdown below $0.019 would activate a target near $0.0045.*
• Break above $0.055 would invalidate the H&S idea and could open the door toward $0.1150.*
* H&S scenario is purely hypothetical and would require structure confirmation.

BITCOIN 4H - 8th time lucky? The 200 EMA is a great indication of the environment a certain asset is currently in. If the 200 ema is not being respected as neither support nor resistance then generally the market environment is rangebound. If an asset is in a trending environment then the 200 ema is often being respected, as in the moving average acts as a key support in an uptrend or as resistance in a downtrend.
What we have seen from BTC is a clear shift from rangebound PA where it seems as though the 4H 200 EMA has no effect on price and is sat relatively neutral with no gradient, to a clear downward gradient capping off any attempt for the bulls to move higher. Eight separate occasions the bulls attempted to flip the moving average and failed each time, until now?
Having ended last week strong with a reclaim of $86,000 an early Monday push has seen BTC close a 4H candle above for the first time in 7 weeks. It is important to note that when the MA is still sloping downward it is still seen as a resistance level, a retest as new support while the slope levels out is always a possibility.
I am now interested in the question of, if Bitcoin reclaims the 4H 200 EMA, does it flip to a bullish trend or another rangebound one? That's where the $91,000 S/R comes in, as a reclaim of that level would put BTC into a LTF rally and therefor bullish trend, rejection off that level would see the MA level-out and becomes less important and therefor rangebound.
Comment with your thoughts on this idea.

LITECOIN 4H (LTC)Litecoin is one of the best performing majors in recent weeks and finds itself around the mini range highs in an area of key resistance. The way I'm looking at this chart is in two separate sections of the same mini range, a lower range and upper range with an area of indecision between that separates the two.
Despite how choppy the market has been price can be clearly analyzed in this format:
Lower range - Clear level of support where buyers are stepping into the market aggressively to rebound any sell off and pushing price up further towards the 1D 200 EMA. There is one instance of price sweeping below range low and quickly reclaiming back above, that move has been a catalyst for bullish PA ever since with a strong bullish structure.
Upper range - The top of the upper range has yet to be retested as there is major resistance area position just before it, this bearish orderblock has rejected 4 times and is now being tested for a 5th at time of writing. It is important to note that the 1D 200 EMA is currently at its highest point during this rangebound environment, coupled with higher highs and higher lows on the low time frames, Litecoin is looking good currently.
However, bitcoin is still very much the dominant force in the market, and without bitcoin paving the way I can't see LTC making a breakout move just yet. In order for Litecoin to make a run for the highs I would like to see BTC @ $98,000 with a full reclaim of the weekly midpoint (See weekly outlook).
To conclude, Litcoin is in better shape than most other coins but this rangebound environment should be treated as such until proven otherwise, no action needs to be taken in the main bulk of either the upper or lower range, just the tops and bottoms are worth acting on IMO.

TAO DAILY For me there are two possible entries for TAO caused by the trade war situation in the US, so this is my take on the chart:
- Wicks get filled as a rule of thumb, so this capitulation wick that has reset all the progress made in Q4 2024. My preferred entry would be a sweep and reclaim of the wick as this coincides with range low and a bullish orderblock, an area of extreme support on the high timeframe.
- Another entry would be the breakout of the diagonal downtrend resistance, if this could coincide with the reclaim of the 0.25 line in the range that would add further confluence and a better R:R IMO.
For both entries the Midpoint would be a key S/R level and would be very high resistance.

NQ Power Range Report with FIB Ext - 10/18/2024 SessionCME_MINI:NQZ2024
- PR High: 20413.50
- PR Low: 20377.00
- NZ Spread: 81.5
No key scheduled economic events
Quick auction return back to Tuesday lows
Session Open Stats (As of 2:15 AM 10/18)
- Weekend Gap: N/A
- Session Gap 7/24: -0.32% (open > 19946)
- Gap 10/30/23 +0.47% (open < 14272)
- Session Open ATR: 298.31
- Volume: 25K
- Open Int: 248K
- Trend Grade: Bull
- From BA ATH: -3.7% (Rounded)
Key Levels (Rounded - Think of these as ranges)
- Long: 20954
- Mid: 19814
- Short: 17533
Keep in mind this is not speculation or a prediction. Only a report of the Power Range with Fib extensions for target hunting. Do your DD! You determine your risk tolerance. You are fully capable of making your own decisions.
BA: Back Adjusted
BuZ/BeZ: Bull Zone / Bear Zone
NZ: Neutral Zone

Intel - Retest, reversal and rejection!NASDAQ:INTC has been establishing a slight bullish trend over the past couple of years.
A clear trend is the basis of every profitable trade, right? Yes and no. You should primarily focus on trading trends and entering positions during such phases. But Intel is a textbook example of a range bound stock; still there are trading opportunities everywhere. Currently Intel is retesting support and is starting to reverse towards the upside. But please: Manage your risk properly.
Levels to watch: $30, $45
Keep your long term vision,
Philip - BasicTrading

NQ Power Range Report with FIB Ext - 4/2/2024 SessionCME_MINI:NQM2024
- PR High: 18498.75
- PR Low: 18472.25
- NZ Spread: 59.5
Key economic calendar event
10:00 | JOLTs Job Openings
Prev session closed virtual flat, wide range
- Maintaining 2 week range
Evening Stats (As of 12:05 AM)
- Weekend Gap: +0.21% (filled)
- Gap 10/30 +0.47% (open < 14272)
- Session Open ATR: 220.56
- Volume: 18K
- Open Int: 259K
- Trend Grade: Bull
- From BA ATH: -1.2% (Rounded)
Key Levels (Rounded - Think of these as ranges)
- Long: 18675
- Mid: 18106
- Short: 16963
Keep in mind this is not speculation or a prediction. Only a report of the Power Range with Fib extensions for target hunting. Do your DD! You determine your risk tolerance. You are fully capable of making your own decisions.
BA: Back Adjusted
BuZ/BeZ: Bull Zone / Bear Zone
NZ: Neutral Zone

NQ Power Range Report with FIB Ext - 3/27/2024 SessionCME_MINI:NQM2024
- PR High: 18482.00
- PR Low: 18468.00
- NZ Spread: 31.5
Key economic calendar event
10:30 | Crude Oil Inventories
Maintain prev 2 session range
- Session open advertising potential to break highs
Evening Stats (As of 12:05 AM)
- Weekend Gap: N/A
- Gap 10/30 +0.47% (open < 14272)
- Session Open ATR: 237.41
- Volume: 17K
- Open Int: 254K
- Trend Grade: Bull
- From BA ATH: -0.9% (Rounded)
Key Levels (Rounded - Think of these as ranges)
- Long: 18675
- Mid: 18106
- Short: 16963
Keep in mind this is not speculation or a prediction. Only a report of the Power Range with Fib extensions for target hunting. Do your DD! You determine your risk tolerance. You are fully capable of making your own decisions.
BA: Back Adjusted
BuZ/BeZ: Bull Zone / Bear Zone
NZ: Neutral Zone

NIFTY DAILY - 19/3/2024Another choppy day, Nifty open lower and traded range bound thought the session.
Nifty has formed green body small candle with upper and lower shadow.
Nifty took support near 21900 for the fourth consecutive time.
Further levels for nifty will be 22115 will work as resistance level and 22831 will work as support level.
Today’s Advance Decline ratio of NIFTY50
Advance - 21
Decline - 29
FII Sell – 2051.09 crore
DII Buy + 2260.88 crore.
⚠️ Important: Always maintain your Risk & Reward Ratio.
✅Like and follow to never miss a new idea!✅
Disclaimer: I am not SEBI Registered Advisor. My posts are purely for training and educational purposes.
Eat🍜 Sleep😴 TradingView📈 Repeat 🔁
Happy learning with trading. Cheers!🥂

Review and plan for 19th February 2024Nifty future and banknifty future analysis and intraday plan in kannada.
This video is for information/education purpose only. you are 100% responsible for any actions you take by reading/viewing this post.
please consult your financial advisor before taking any action.
----Vinaykumar hiremath, CMT

😍Let's trade EURAUD up and down for few days!🎁Wow, do we have a surprise for you! Our AI screener has spotted a golden opportunity for you: EURAUD is in a ranging market for the next few days!
What does that mean? It means that the price is bouncing back and forth between two levels: 1.6346 and 1.6596. That’s a range of 252 pips or more!
How can you cash in on this situation?
🚀There are two ways:
👩💻If you are a manual trader, you can use oscillators like RSI, Stoch, or MACD divergence to catch the best entry points for both long and short trades. You can use lower timeframes like M15 or M5 to find these signals.
👾If you are a bot trader, you can use a martingale or zone strategy with proper risk control and money management. Trading with a bot will save you time and effort, as you don’t have to watch the charts all the time. You just need to check the bot trading every 4 hours to see if the market pattern changes from ranging to trending. If it does, you can close the bot and take your profits!
This is a simple and effective way to make money from the forex market. But act fast, this opportunity won’t last forever! 💥
To get more trading ideas like this, follow our channel and subscribe to our newsletter. We will send you the best forex signals and tips every week. Don’t miss this chance to earn money online with us! 🙌
Please drop a comment below, what tools and what strategy you will use to earn money from ranging market like this? We would love to hear from you. 😍
Disclaimer: Trading forex is risky and you should only trade with money you can afford to lose. We are not responsible for any losses you may incur from following our signals. Always do your own research and analysis before placing any trades.

India cements #INDIACEM has been moving in a range of 245-275, traders can play the given range or can wait for a breakout/breakdown in the stock and then positions can be made, short only once the stock has a hourly closing below 245 and long only above 275 hourly closing!

SYMPHONY a good buy for 44% and 89% returnsSymphony is a big player in air cooler segment and the company is showing a buy signal under range bound trading strategy where the stock covers a range of price set it has covered multiple times in the past.
Buying level- 875
CMP- 885 (close to buying level)
Target price 1- 1216
Target price 2- 1593
Hope you understood.
Thank you for reading.
Have a happy trading and investing experience

29/08/23 Weekly outlookLast weeks high: $26824.0
Last weeks low: $26045.0
Midpoint: $25266.0
The weekly outlook starts on Tuesday this week due to the bank holiday. Despite a strong decline 2 weeks ago price has stabilised into a much tighter spread, almost like a sinewave across the midpoint.
Because of this for me personally there is no clear near term direction, however the longer term direction would seem to be bearish thinks to that new lower high after the pullback. We'll know for sure once a new lower high is posted.
If that happens, I would expect most of this years progress to be retraced back down towards the 19k area by the end of the year/Q1 2024.
For now there is not a lot to do as LTF chop is very difficult to navigate currently.

Until the VIX breaks this level, it remains range-boundA quick look at our VIX chart shows us that we are range-bound since June. Exactly, as I expected and have stated numerous times in past posts. But now, with the U.S. credit rating downgrade, fear has spiked. Will we break this range and move up? We could, yes. But to do so, we need the VIX to move above that 15.94 level with confirmation. As of today, the VIX can still be technically classified as range-bound at all time 2-year lows. Of course, when the VIX remains low, the market will remain relatively positive. This is bullish.
Stay tuned for further updates here.
Stew

TEAMLEASE 40% gain in 5 monthsThe share trades between a range of 1992 and 3212 and has covered the gap of 60% for 3 times in previous years. From the present level it can give a return of 40% in less than 5 months as per previous chart patterns. But the company is a small cap company so a risky bet to play. Please put money after deep thinking. The current P/E ratio is very low than the 7-year average P/E ratio and the company has significantly increased its revenue and net profit, so it becomes safer to buy it at this point of time. Present market analysis shows that it will furthur increase its revenue and net profit this year.
Thank you for reading it to the last
