AAPL Set for a Breakout? | Technical Checklist & Projections
▍Observation & Context
▪ AAPL has been moving sideways within a clearly defined range for the past three months .
▪ On July 07 , price tested the range resistance decisively, showing some interest in the upside.
→ Let's first explore the bullish breakout scenario.
▍What Makes a Good Breakout ?
Before we talk about targets, let’s define what a good breakout looks like:
▪ A strong bullish candle breaking through the resistance in one clean move .
▪ Followed by a retest of the broken resistance (now acting as support).
▪ After that, price should ideally:
1. Form a higher low , and
2. Reach the next resistance or target zone before pulling back.
▍Target Price – Method 1: Extension of the Range
🔹 Near-Term Target: 1.5–1.618x Fibonacci Extension
- A common zone where momentum often pauses.
- Aligns with the previous high from the last downtrend.
- Technically, to reverse a trend, price needs to take out the previous high. Even though the range has “cooled off” the pressure, we still respect that level.
🔹 Ultimate Target: 2x Range Extension
- Represents a 100% projection of the previous range.
- Commonly used in range breakout targets.
🔹 Dream Target: 2.618x Fibonacci Extension
- Aligns with the start of the last downtrend , adding significance to the level.
- Often marks the exhaustion point of strong trends.
▍Target Price – Method 2: Projection from Higher Low
Note: The new higher low is not yet confirmed at the time of writing. The levels below assume an upward breakout without dropping below 207.22 . However, the same logic can be applied once the higher low forms.
🔹 Near-Term Target: Same as Method 1
🔹 Ultimate Target: 100% Projection of Prior Swing
- Projecting the prior swing (from previous low to recent high) from the new higher low .
- This level also aligns with the 1.5–1.618x Fibonacci extension of that swing, increasing its significance.
🔹 Dream Target: Another 100% projection
- Rare, but happens when momentum is very strong .
- In such cases, price might skip any retracement and launch directly into a second leg , equal to the previous swing.
- Here, the level aligns perfectly with the start of the last downtrend , just like the 2.618x extension in Method 1.
▋Mental Notes
▪ No one knows for sure if the breakout will be real or fake. But when it happens, knowing what to look for and where price might go next gives us a clear plan of action .
▪ The market will always find ways to surprise. Stay open and follow the flow.
▋Not Financial Advice
The information contained in this article is not intended as, and should not be understood as financial advice. You should take independent financial advice from a professional who is aware of the facts and circumstances of your individual situation.
Rangebreakout

BAAP OF BANKSSBI fut breaking out of weekly range as well strong resistance zone of 800-802 with three indicators turned positive.
Shortcovering seen in call options with highest OI on 800.
Risk:Reward = 1:1.5
Could b bought with mentioned stoploss & target.

SYSTEM FAAD DENGEYes, IndusindBank Fut system faad dega.
Indusind Bank Fut is trading inside 18th june's candle & its about to break out of it on daily/hourly charts wih good OI & positive cross overs in 3 other indicators.
Could b bought above 854.50 with stoploss of 813 & target of 950
Risk:Reward = 1:2
Buy n hold in july series, sysem faad dega.

Range breakout | Impulse of bull starthi Traders,
1. The swing formation is solid
2. BEL has taken the ascending trend line support.
3. The the range bound is weekly has broke upward, leading to impulse wave of bull trend.
4. Projected Target 1 and Target 2 with 20% and 40% returns from the CMP with 1:81 and 1:4.01 risk reward ratio respectively.

Intel - This might be the bottom!Intel - NASDAQ:INTC - might create a bottom:
(click chart above to see the in depth analysis👆🏻)
For almost an entire year, Intel has been consolidating at a major horizontal support. Considering the previous significant bloodbath, Intel might soon find its bottom, which is inevitably followed by a major bullish reversal. After all, market structure is slowly shifting bullish.
Levels to watch: $20.0, $25.0
Keep your long term vision!
Philip (BasicTrading)

Crude oil futures Trade the range In this video I look at the current range that we are in and I have laid out a plan in the scenario that we break that range to the upside and what we could possibly expect .
I have given some reaction zones where I anticipate price to react when we reach there .
I have used Fibonacci, volume profile, and vwap in this video .
Thankyou for your support

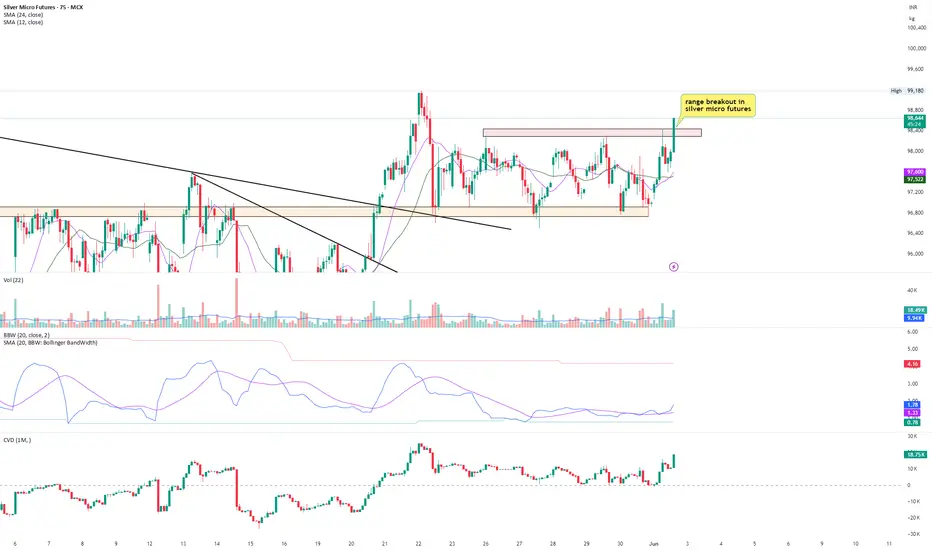
Silver micro: range breakoutSilver micro futures are trading in range for approx 13 days now. Currently trying to break the range with high relative volume. If it sustains above 98450, breakout can continue and range expansion in prices may happen. The stoploss at current price is very small as compared to the probable reward. Very high probability trade with a smaller risk.
Silver micro is in uptrend. and this is continuation breakout trade.
Weekly Range bound | 4H swingFellow trader,
Eicher motors has broken the range bound market in weekly timeframe, and now the market is re-testing.
Aggressive entry : Whoever enter the market immediately after the breakout
Conservative entry : Whoever enter after the market re-test.
The weekly range bound breakout target is 5684 & the SL for the same is 4548
Now in the re-test, there is a clear formation of a swing in 4H/1D timeframe, after a inverted H&S pattern breakout in 1H timeframe consider to enter the trade based on this swing.
Considering the pattern of Weekly or 4H time frame trade can be taken, the SL and Targets are in the chart.
The Risk : Reward ratio for the swing is 1:4.47
Sensibull : sbull.co

BHARTIHEXA : Short Term Trade (1-3 months)#bhartihexa #chartpattern #flagbreakout #rangebreakout #breakoutstock
Bharti Hexacom : short term trade
Duration (1-3 months)
>> Flag structure in monthly
>> Range consolidation Breakout
>> Breakout + retest done
>> Good strength in stock
>> Potential upside upto 50%
U can consider entering at cmp and keep building positions in retracement or pullbacks.
Disc : Charts shared are for Study purpose only, not a Trade recommendations

Update to Dow Jones Industrials Time At Mode Back in 2015 I had published a chart with annual data for the Dow Jones Industrials. I will provide a link at the bottom.
The research for this patterning is something I did myself by hand using pencil and paper back in the 1980's. These patterns show up in all time frames.
There is plenty of room to enhance the research on this technique and a group of us gather in the chat rooms here at TradingView to discuss new trades that set up and point out when trades expire.
Notice how these two grey boxes (which are both 50% drops in price) that expand wider in time from the 1960's to the 1980's and the 2000-2010's had a multi-year trend, followed by a monster crash (1987 was 40% and 2000 was 37%) and then just two+ years later there was a secondary bear market of 20% in 1990 and 22% in 2022. Keep in mind this is just for the DJ:DJI and not the Nasdaq Composite or S&P500 which were greater corrections.
The 11-year time frame of the 1999-2011 pattern allows for an 11-year rally from 2012 (which was year 1 of the 11-year rally) shows that time expired. As you can see from the 1943-1962 trend, a smaller 5-year mode formed at the end of the 20 year trend and then the market peaked in 1972-1973 when time expired for the second, smaller mode.
I had to reconstruct this chart after the data for the previous chart changed symbol. See the link below to see the original.
I look forward to your additional research onto this pattern and its implications to the idea that we are in a similar period to 1993-1994 with rally years of 1996, 1997, 1998, 1999 and 2000 ahead of us.
All the best,
Tim
October 19, 2024 3:31PM EST

Bitcoin Ready to Soar After Breaking Range | First Target: $122K🔹 Bitcoin has finally broken the **key resistance at $104K** after **a month of ranging between $90K and $104K**, signaling the end of its consolidation phase.
🔸 This breakout coincides with a major fundamental catalyst— he inauguration of the new U.S. President (Trump) on January 20*—bringing renewed optimism and buying interest into the market.
🔸 Entry Zone: $104K to $106K
🔸 First Target: $122K
🔸 top Loss: GETTEX:97K
💥 *Technical and Fundamental Convergence: The combination of a critical resistance breakout and significant political events sets Bitcoin on a clear path toward its next major target of $122K.
📈 Don’t miss this powerful opportunity—Bitcoin is ready for another explosive rally!

VeChain Breaks Free from Range; Ready to Soar!🔍 Analysis:
VeChain (VET) has finally escaped the consolidation range of $0.04 to $0.055, breaking out with a strong bullish candle. This signals the potential start of a powerful uptrend.
💡 Signal Details:
- Entry Point: $0.056
- Stop Loss: $0.038
- Take Profit: $0.110
- Risk to Reward Ratio: 3
- Potential Profit: 96%

FIVE STAR READY FOR BREAK RANGE BREAKOUT...NSE:FIVESTAR trade at 825 level. After break the 850 level you can watch it as a next resistance at 1000 level.

Ready for a Range Breakout...NSE:ECLERX trade at 2715. Resistence is @ 2820 & Support is @ 2320
on the daily time frame chart make a long range. After the Breakout you can watch it as a next Resistence @ 3400...

hdfcamcHDFCAMC Fut is breaking out of 20-25 trading sessions of upward condolidation triangle breakout on an hourly charts.
Risk:Reward = 1:4
Could b bought with mentioned stoploss & target.

Pre-Breakout BuyAuropharma is trading inside range of 1210-1280 from past 10-15 trading sessions on an hourly chart with modest OI addition today.
Risk:Reward = 1:3
Could be bought here or on breakout of 1377 with mentioned stoploss & target.

Crucial day for NAS100Today is a crucial day for the NAS100 index, as it faces a critical level at 21,245. The price action here will determine the short-term direction of the market. If NAS100 manages to break above 21,245, it could signal a continuation of its upward momentum, potentially reaching new all-time highs, with a target of 22,200 by January 2025.
However, if the index fails to break this level and instead stays in a range-bound consolidation for a few days, the price may hover in the current levels, waiting for further clarity. A key support level to watch is 20,700; if the NAS100 refuses to fall below this price, the index could build enough strength to push towards the 22,200 target.
On the other hand, if the index breaks below 20,700, it may retest the base of the channel at 20,517. A breach of this level could lead to further downside, with 19,500 as the next target, followed by 18,300. In the worst-case scenario, a breakdown could push the index all the way down to 17,400.
Thus, today's price action is vital for determining whether the NAS100 will reach new highs or face a deeper correction.

READY FOR BREAKOUT...NSE:DCAL trade at 228. Stocks trade in a range last 6 years. Now it ready for give a breakout, so you can watch for a swing trade.

GOLD HIGHT PROBABILITY SETUP!!According to Candle Range Theory (CRT), GOLD price swept the previous week high (CRT LOW), and this daily candle (today's candle (22/11/2024)) must close below the previous week high (CRT HIGH). If this daily candlestick closes below, the whole week next week (25/11/2024) gold will be selling (bearish). The target will be Previous week low (CRT LOW).
Another thing, on weekly timeframe you will see gold has touched the bearish fair value gap (FVG) which was our internal range liquidity (IRL) but on Daily timeframe we still have to touch the bearish FVG with a rejection, then we can sell.
“I just wait until there is money lying in the corner, and all I have to do is go over there and pick it up. I do nothing in the meantime.” - Jim Rogers

READY FOR BREAKOUT IN BANDHANBANK...NSE:BANDHANBNK trade at 206 level, Stock trade in a Triangle range since 5 Years, After breakout You can watch for a big upside movement.

NECTAR LIFESCIENCES LONG multi year breakout if it closes above 60 on a weekly basis with good volume. need to wait for the close and then take a position on it. The final target is in the mid 300's but let's take one step at a time.
First breakout confirmation with weekly close above 60 with good volumes
Then head towards tp 1 and then we take it from there.
So far it looks promising with the volumes for the current move let's see how it goes from here.

JM FINANCIAL LTD LONG6 year range breakout with ATH in volume. should buy here or wait for range high retest.. if fomo one should start building position here. looks really strong as does the whole finance sector on the whole.

UPTREND CONTINUE IN UBLNSE:UBL trade at 2090 level, After give a breakout at 1800 level, Stock consolidate in between 1880-2100, Now stock ready for going its all time high and resume own uptrend move...
