Possible Oversold Rally From Range Bottom IncomingRSI is Moderately oversold at the bottom of a trading range i will be making a small bet that we will rise a little bit from here.
Rangetrading
There's something good about to happen here! 🤞We have a trading range in the 30min, between the 60.46 and the 58.76.
When we look at the daily chart, we see that RDFN is slowly accumulating, and we are near the support at 56.23 and the 20ma. The BB are getting tight, and if RDFN breaks the 60.46 there’s a good chance it’ll hit the 64s.
This could be the beginning of an impressive movement next, leading to the 72.85. Just in case, I’ll watch the supports mentioned, as if RDFN loses them, it’ll probably drop more. But I this well see a bullish movement after this accumulation.
A breakout from the 60.46 will be the first step to confirm this thesis.
If you liked this trading idea, remember to click on the “Follow” button to get more trading ideas like this, and if you agree with me, click on the “Agree” button 😉.
See you soon,
Melissa.

EURGBPprice has reached a demand level as a retest after break out and rejected with a doji price will go long untill the 4h resistance

Short USD/CAD Since the start of 2021 year, there is a downtrend for the USD/CAD pair.
In the daily chart, you will be able to see a range in progress. If you look closely at where the price within the range, it's very clear that the price has reached the top of the range.
So there is a possibility to short this price when you have a good setup.

GBPUSD Sounds a good buy opportunity!Based on the chart, we can found a very good market range since about 26 days ago! So we should have a good strong support and resistance which took price among them. An now price is on the support zone and remember before this ranging market, we had a good uptrend movement!
So I opened a buy position at this support area and will hold it until it reaches to the specified areas on the chart which can provide me a reasonable risk reward ratio(about 1:3.5)
Note: As always please take all risk management rules into consideration before opening any position on the market.
Good Luck!

GBPUSD a range trading 🦐GBPUSD is trading between a monthly resistance and a daily support.
The price after few attempts to break above or below never break one of the 2 structures.
According to Plancton's strategy if the price will clearly break below we will set a nice short order.
------
Follow the Shrimp 🦐
Keep in mind.
🟣 Purple structure -> Monthly structure.
🔴 Red structure -> Weekly structure.
🔵 Blue structure -> Daily structure.
🟡 Yellow structure -> 4h structure.
⚫️ Black structure -> >4h structure.
Here is the Plancton0618 technical analysis , please comment below if you have any question.
The ENTRY in the market will be taken only if the condition of the Plancton0618 strategy will trigger.

BTC - diamond patter pullback follow-upHello,
One month ago I posted a bearish scenario for BTC where the potential diamond formation could drive its price below $40,000
What we see today is that even though the coin dropped below the projected support (January peak) and turned it into resistance, so we are now basically stuck in the $40,000-$33,000 range which more or less marked the lows and highs back in the first month of the year.
What is more important is how the lower boundary of the downtrend corridor built as a continuation of the diamond figure now act as a dynamic resistance.
The price decline and series of rejections suggest we can expect a further decline and narrowing price action between the dynamic and the horizontal resistance. This, combined with the rising RSI values on the daily timeframe, which currently represents a bullish divergence on that timeframe, can result in an upside reversal by the end of June or early July.
Hope you found that idea interesting. Don't forget to manage risk appropriately.
Best Regards,


How to trade ranges? 🤓Even with a lot of people (including me) not that happy with NIO because it was too overbought, technical analysis never fails!
NIO did break the 42.34, the consolidation we talked about in my last analysis, and it hit the technical target. When you see a breakout, especially if the stock opens below the resistance, and closes above it, you just replicate the size of the range. In this case, the range was of $ 1.45, so you sum it to the 42.34, and set a target at 43.79.
But since the 4h chart still looks weird, personally, I rather wait for a pullback, or at least a good and easy trade. Right now, NIO seems too complex, and I see better stuff around.
If it hits the 20ma again, I’ll be much happier 😊.
If you liked this trading idea, remember to click on the “Follow” button to get more trading ideas like this, and if you agree with me, click on the “Agree” button 😉.
See you soon,
Melissa.

GBPUSD 1.41395 -0.08% SHORT IDEA * STRUCTURE & CONTINUATIONHELLO EVERYONE
HOPE EVERYONE IS DOING GOOD HAVING A GOOD ONE IN THE MARKET THIS WEEK, HERE'S A LOOK AT THE GBP / USD. Trading the range within structure
* follow your entry rules on entries
* significant moves with the bears change the plan.
lets see how it goes.
many stars must align with the plan before executing the trade, kindly follow your rules.
HAPPY TRADING EVERYONE & LET YOUR WINS RUN...
_________________________________________________________________________________________________________________________
ENTRY & SL - FOLLOW YOUR RULES
RISK-MANAGEMENT
PERIOD - SWING TRADE
__________________________________________________________________________________________________________________________
If this idea helps with your trading plan kindly leave a like definitely appreciate it.

USDCAD take a break 🦐USDCAD after a long downtrend starts to consolidate inside 2 structures.
The price is trading within a range and according to Plancton's strategy if the market will break above the resistance structure we will set a nice long order.
--––
Follow the Shrimp 🦐
Keep in mind.
🟣 Purple structure -> Monthly structure.
🔴 Red structure -> Weekly structure.
🔵 Blue structure -> Daily structure.
🟡 Yellow structure -> 4h structure.
⚫️ Black structure -> <4h structure.
Here is the Plancton0618 technical analysis , please comment below if you have any question.
The ENTRY in the market will be taken only if the condition of the Plancton0618 strategy will trigger

Energy breakout ~ June 2021Technical Analysis
We have been in a strong uptrend (pink segment line) since November, which I have divided into 3 ranges.
We have tested the top of "Range 2" 3 times, and we are now breaking out. Either we continue into "Range 3", or we could potentially test the pink trend line once again (ghost feed representation)
Macro
Tomorrow jobs report could be a market moving event, as the Fed has made a drastic change in its action plan, which consists of reacting to data (reports such as these), instead of reacting preemptively as it has done in the past.

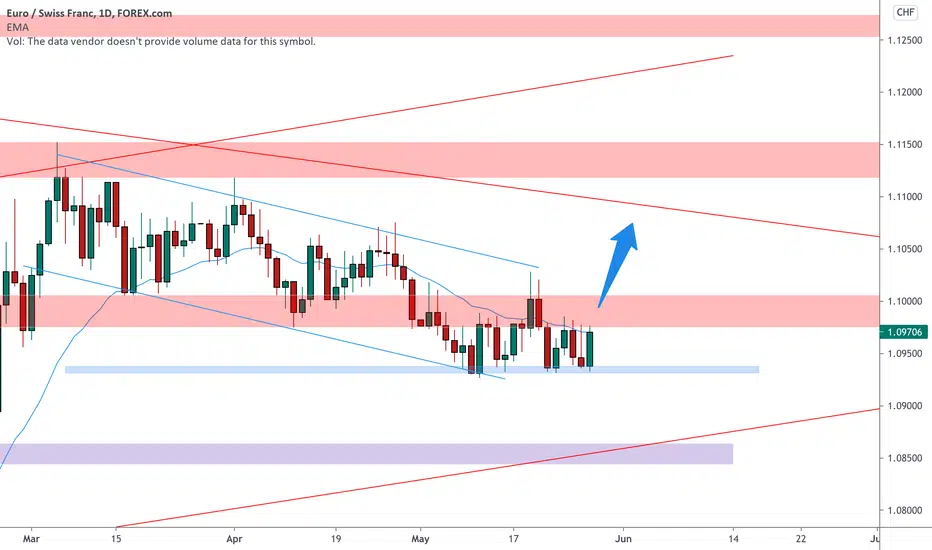
EURCHF a range trading 🦐EURCHF on the daily chart is moving between a daily support and a weekly resistance.
The price tested a few times the lows creating a triple bottom.
According to Plancton's strategy if the market will break above we will set a nice long order.
–––––
Follow the Shrimp 🦐
Keep in mind.
• 🟣 Purple structure -> Monthly structure.
• 🔴 Red structure -> Weekly structure.
• 🔵 Blue structure -> Daily structure.
• 🟡 Yellow structure -> 4h structure.
• ⚫️ Black structure -> >4h structure.
Here is the Plancton0618 technical analysis , please comment below if you have any question.
The ENTRY in the market will be taken only if the condition of the Plancton0618 strategy will trigger
How GBPCAD will move?GBPCAD is in a range trading and we can see some strong bearish candles. at first if the price break out the support line it will reach to its target at 1.69550. otherwise if the price support here it will go up till the top of the range trading.

AUDUSD Analysis Overview AUDUSD analysis Overview -
Monthly Chart - monthly closure was a doji showing some indecision for the time being, furthermore can be observed that monthly chart is under some type of consolidation rn.
Weekly Chart - furthermore the consolidation from the monthly chart can be further observed on the weekly chart. Previous weekly candle was also a doji no giving continuation to the bearish momentum from the previous week. ( no long term for me atm, keeping an unbiased opinion until breaking out of this consolidation)
Daily Chart - still maintaining uptrend, consolidating for the last month and half
H4 Chart - this daily consolidation can be seen as a range which broke the resistance level and came back down to the bottom of the range but yet respecting the support level.
30m Chart - after bouncing from H4 support broke previous level of resistance and created a new high... Ideal scenario would be to see a pull back to enter on. a long position to ride it to the resistance level.

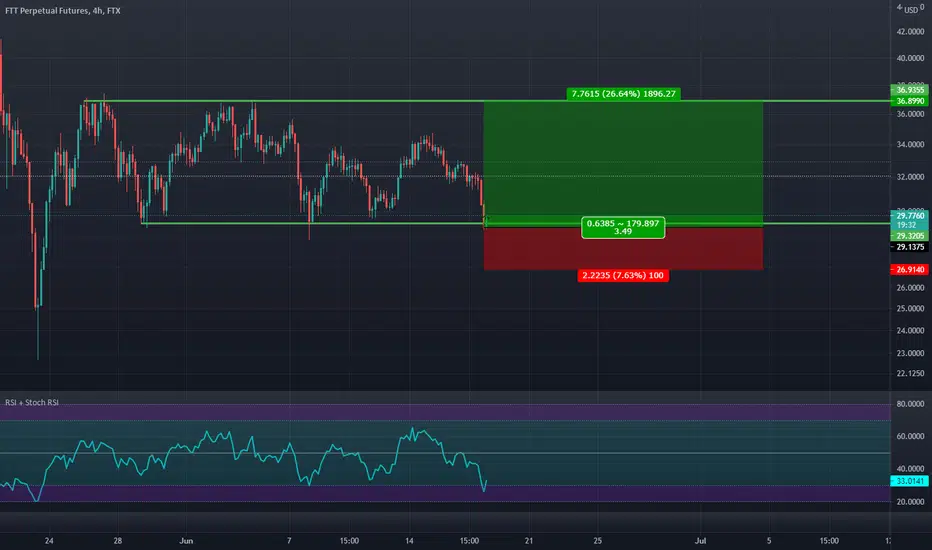
BTCUSD IS IN A RANGE TRADEBitcoin is in a very large range and tends to fall again to the 33520 price. But if it breaks the price of 36934 and stabilizes, we should expect to climb to the 39890.

EURCHF a range trading 🦐EURCHF after the retest of the weekly resistance couldn't break above.
The market is now back over the minor support and according to Plancton's strategy if the price will break below we will set a nice short order.
–––––
Follow the Shrimp 🦐
Keep in mind.
• 🟣 Purple structure -> Monthly structure.
• 🔴 Red structure -> Weekly structure.
• 🔵 Blue structure -> Daily structure.
• 🟡 Yellow structure -> 4h structure.
• ⚫️ Black structure -> >4h structure.
Here is the Plancton0618 technical analysis , please comment below if you have any question.
The ENTRY in the market will be taken only if the condition of the Plancton0618 strategy will trigger

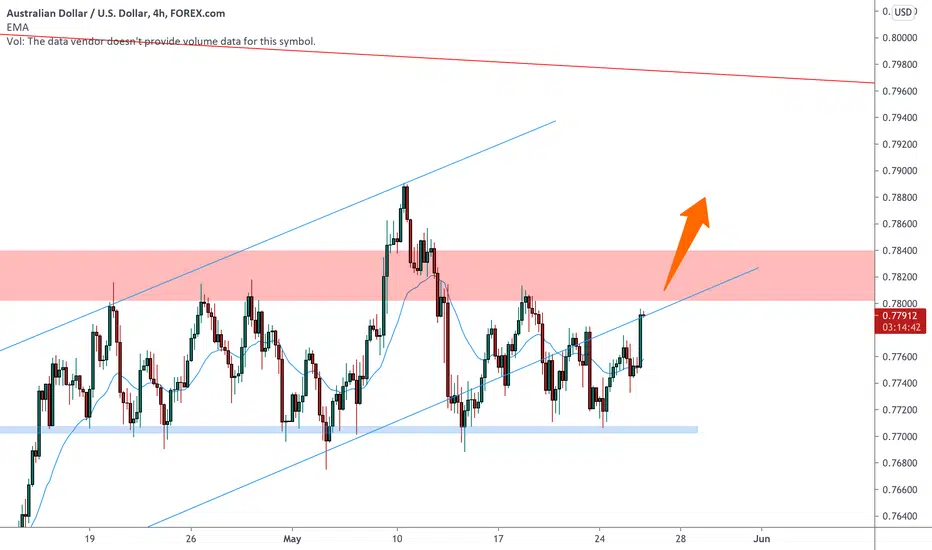
AUDUSD on a break of the range 🦐AUDUSD after the attempt to break above the weekly resistance comes back in a range trading between 2 structures.
The price has bounced on the support and now moving for another test of the resistance.
According to Plancton's strategy if the market will break above we will set a nice long order.
–––––
Follow the Shrimp 🦐
Keep in mind.
🟣 Purple structure -> Monthly structure.
🔴 Red structure -> Weekly structure.
🔵 Blue structure -> Daily structure.
🟡 Yellow structure -> 4h structure.
⚫️ Black structure -> <4h structure.
Here is the Plancton0618 technical analysis , please comment below if you have any question.
The ENTRY in the market will be taken only if the condition of the Plancton0618 strategy will trigger
Ryanair Shares Recoup From Belarus Hijacking, Still Ranging The price action of RYA has been range-trading for quite a while now, mostly being concentrated between the major resistance level at 17.100 and the major support at 15.100.
The massive Marabozu candle that is forming today could potentially indicate the termination of the sell-off. Moreover, Ryanair's stock may be due for another attempt at breaking the range and continuing to climb higher.
That is so because the Flag, as a classic trend continuation pattern, is found after a Wedge. The latter represents a type of pattern that is commonly found at the lower end of a downtrend or range.
Market bulls should not disregard the fact that the Stochastic RSI indicator is nearing its overbought extreme, which, given the still prevailing range-trading sentiment, could prompt yet another reversal.
For more risk-averse bulls, the most optimal thing to do would be to wait for the price to pull back to 17.100 following a decisive breakout, which would underpin robust buying sentiment in the market.

Apollo at attractive levelsAnother stock that came on my radar is apollo tyre.
The stock has been moving in a range for the past 4 months.
Last week its closed well near its highs.
Now if the stock sustains 190 levels on the weekly basis, the stock might test its upper range 240- 255.
And if the range breaks on the upside, the stock could test its all-time highs i.e. 307.25.

Points to monitor next Monday!Tesla failed in breaking the resistance we've been talking about at 592, and it is still inside a range. We must wait for a breakout from this point before we can do anything. If it drops below the 580, the 571 is the next stop for Tesla, or it could even fill the gap, but I'm not counting too much on this.
One of the reasons why I'm aiming for Tesla is the advanced breakout seen in the RSI, that could make it fly again to the 626, but we have no confirmation on the price yet. Let's keep watching the 592 area, this is the most important line for us. Peharps, this drop is just a pullback before the next bullish leg. We'll see.
If you liked this trading idea, remember to click on the “Follow” button to get more trading ideas like this, and if you agree with me, click on the “Agree” button 😉.
See you soon,
Melissa.

COCA-COLA 1D BEAR FLAGBear Flags are a Range and they are repeatable trading chart patterns.
Bear Flags are ascending chart patterns that will have a directional bias depending on the previous incoming trend.
Each chart pattern will have defining trendlines of the support/resistance levels creating the pattern.
What ever time frame you are trading this chart pattern, wait for a candle close outside of the trendline in the direction of the breakout candle. (Our time frame preference is the Daily chart).
Add volume indicator - Volume is the amount of $ that went into a particular candle or in Forex the # of trades that took place.
Add ATR indicator - Volatility is the amount of price movement that occurred. Use the ATR to measure the price movement.
When you see descending Volume bars and descending ATR line (which indicates volatility) this shows
a dis-interest in traders to invest in this pair creating consolidation which creates the chart pattern.
Trade Management after there is a breakout candle close.
1 - Position size (compare volume bar to volume ma line).
a - Breakout candle must be 100% of volume average for a full position size.
b - If 75% of volume average then ½ position size. (To find 75% of Volume
look at the charts volume settings – divide smaller # into larger # = 75%+)
If not 75% then stand aside from the trade.
2 – If candle breaks out of a trendline, 15m before the close of the day prepare your buy/sell order.
Enter two trades. 1st trade will have a SL & TP. It will close automatically when the 1st TP is hit. 2nd
trade only has a SL and will be allowed to run. When 1st TP is hit move the SL to breakeven. Look
at ATR and prepare SL at 1.5 of ATR. Prepare 1st trade TP at 1 of ATR.
3 - SL for both trades will be 1.5 x ATR.
4 - 1st trade TP will be 1 x ATR.
5 - No TP on 2nd trade – letting profit run and adjusting SL to follow price.
6 - When 1st TP hit – move 2nd trade SL to breakeven.
7 - Adjust the 2nd trade SL to follow price.
*8 – After Breakout candle – if price closes back into chart pattern close trade don't wait for SL to be hit.
*9 - When breakout candle is more than 1 ATR from breakout candle open.
a - Enter 1st trade at candle close with ½ position size.
b - Enter 2nd trade with a pending limit order that is 1 ATR of breakout candle open.
c – Price should pullback to that pending limit order for 2nd trade.
d – If Price returns back into chart pattern close trade before SL is hit.
