NEOUSDT ready for the break 🦐NEOUSDT after the recent high is currently moving between 2 minor structures and according to Plancton's strategy if the price will break above we can set a nice long order.
–––––
Follow the Shrimp 🦐
Keep in mind.
🟣 Purple structure -> Monthly structure.
🔴 Red structure -> Weekly structure.
🔵 Blue structure -> Daily structure.
🟡 Yellow structure -> 4h structure.
⚫️ Black structure -> <4h structure.
Here is the Plancton0618 technical analysis , please comment below if you have any question.
The ENTRY in the market will be taken only if the condition of the Plancton0618 strategy will trigger.
Rangetrading

LINKBULL high volatillity token1 long setup!Hello friends
good mood and profitable deals!
Strategy:
Channel retest
Rangetrading
Algo play
Waiting for confirmation from BTC in LTF
If you like this action
3x Long Token is tradable on Poloniex, located in USA-Delaware:
you get 10% of my trading fees and I 20% of yours
poloniex.com
If you liked this idea or have your opinion on it, write in the comments, We will be glad.
No trading advice, dyor and trade safe.

EURGBP bounce over a weekly support 🦐EURGBP on the weekly chart is moving in a huge range between 2 monthly structures.
The price after a long descending trend reached the weekly support at the 0.85 area and bounce with a strong impulse.
According to Plancton's strategy if the market will break above the resistance we will set a nice long order.
-––
Follow the Shrimp 🦐
Keep in mind.
🟣 Purple structure -> Monthly structure.
🔴 Red structure -> Weekly structure.
🔵 Blue structure -> Daily structure.
🟡 Yellow structure -> 4h structure.
⚫️ Black structure -> <4h structure.
Here is the Plancton0618 technical analysis please comment below if you have any question.
The ENTRY in the market will be taken only if the condition of the Plancton0618 strategy will trigger.

USDCZK Entry Price Area Of The Exponential Moving AverageWatch For A Pull Back To Support Resistance Level 21.84650, Exponential Moving Average Period 10 Level 21.87884, Exponential Moving Average Period 20 21.96575

AUDJPY LONG (BUY) SETUPAUDJPY is currently in a churning and making a range. micro analyzing in M5 and M15 with VSA says it will bounce again probably till near to the resistance. Let's go for it..!

GOOGLE 1D RANGE TRADINGRanges are repeatable trading chart patterns.
Ranges are consolidation chart patterns that can breakout either direction.
Each chart pattern will have defining trendlines of the support/resistance levels creating the pattern.
What ever time frame you are trading this chart pattern, wait for a candle close outside of the trendline in the direction of the breakout candle. (Our time frame preference is the Daily chart).
Add volume indicator - Volume is the amount of $ that went into a particular candle or in Forex the # of trades that took place.
Add ATR indicator - Volatility is the amount of price movement that occurred. Use the ATR to measure the price movement.
When you see descending Volume bars and descending ATR line (which indicates volatility) this shows
a dis-interest in traders to invest in this pair creating consolidation which creates the chart pattern.
Trade Management after there is a breakout candle close.
1 - Position size (compare volume bar to volume ma line).
a - Breakout candle must be 100% of volume average for a full position size.
b - If 75% of volume average then ½ position size. (To find 75% of Volume
look at the charts volume settings – divide smaller # into larger # = 75%+)
If not 75% then stand aside from the trade.
2 – If candle breaks out of a trendline, 15m before the close of the day prepare your buy/sell order.
Enter two trades. 1st trade will have a SL & TP. It will close automatically when the 1st TP is hit. 2nd
trade only has a SL and will be allowed to run. When 1st TP is hit move the SL to breakeven. Look
at ATR and prepare SL at 1.5 of ATR. Prepare 1st trade TP at 1 of ATR.
3 - SL for both trades will be 1.5 x ATR.
4 - 1st trade TP will be 1 x ATR.
5 - No TP on 2nd trade – letting profit run and adjusting SL to follow price.
6 - When 1st TP hit – move 2nd trade SL to breakeven.
7 - Adjust the 2nd trade SL to follow price.
*8 – After Breakout candle – if price closes back into chart pattern close trade don't wait for SL to be hit.
*9 - When breakout candle is more than 1 ATR from breakout candle open.
a - Enter 1st trade at candle close with ½ position size.
b - Enter 2nd trade with a pending limit order that is 1 ATR of breakout candle open.
c – Price should pullback to that pending limit order for 2nd trade.
d – If Price returns back into chart pattern close trade before SL is hit.


GBPNZD looking for the 1.99 🦐GBPNZD after the last impulse is moving around the structure at the a.96500 area.
The market after a retracement over the 0.382 level is now breaking above the resistance.
If the market will close above we can set a nice long order according to Plancton's strategy.
-----
Follow the Shrimp 🦐
Keep in mind.
• 🟣 Purple structure -> Monthly structure.
• 🔴 Red structure -> Weekly structure.
• 🔵 Blue structure -> Daily structure.
• 🟡 Yellow structure -> 4h structure.
• ⚫️ Black structure -> >4h structure.
Here is the Plancton0618 technical analysis , please comment below if you have any question.
The ENTRY in the market will be taken only if the condition of the Plancton0618 strategy will trigger

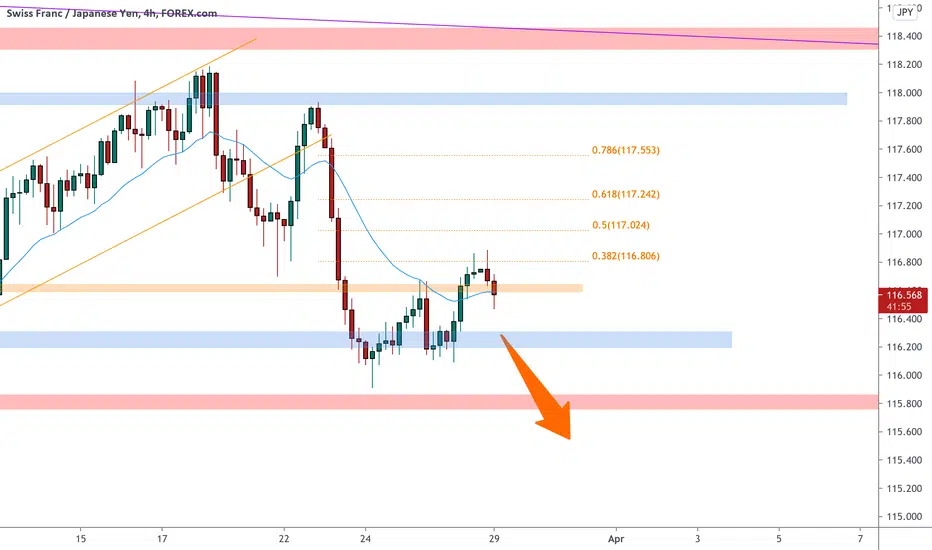
CHFJPY an inversion at the 0.382 🦐CHFJPY after the sharp rejection by the 118 level moved into a bearish impulse until the 116 area.
The market has been moving into a wide range and looks for a direction.
Now the price is testing the 0.382 of the previous impulse and according to Plancton's strategy if the price will break below we can set a nice short order.
–––––
Follow the Shrimp 🦐
Keep in mind.
• 🟣 Purple structure -> Monthly structure.
• 🔴 Red structure -> Weekly structure.
• 🔵 Blue structure -> Daily structure.
• 🟡 Yellow structure -> 4h structure.
• ⚫️ Black structure -> >4h structure.
Here is the Plancton0618 technical analysis , please comment below if you have any question.
The ENTRY in the market will be taken only if the condition of the Plancton0618 strategy will trigger
USDJPY 5:1 SHORT TRADE IDEAThe pair is in a ranging market which gives us a reasonable support and resistance zone to trade within using logical SL and TP. I am short.

USDJPY ready for a break 🦐USDJPY after the test of the the weekly resistance structure retraced over a support inside a descending channel.
The market is consolidating in a range and according to Plancton's strategy, if the price will break above, we can set a nice long order.
––––
Follow the Shrimp 🦐
Keep in mind.
• 🟣 Purple structure -> Monthly structure.
• 🔴 Red structure -> Weekly structure.
• 🔵 Blue structure -> Daily structure.
• 🟡 Yellow structure -> 4h structure.
• ⚫️ Black structure -> >4h structure.
Here is the Plancton0618 technical analysis , please comment below if you have any question.
The ENTRY in the market will be taken only if the condition of the Plancton0618 strategy will trigger.

NZDCHF on a short move 🦐NZDCHF is moving between 2 structures below a weekly resistance.
The market after the break of the ascending channel is now testing the support.
According to Plancton's strategy if the price will break below we can set a nice short order.
–––––
Follow the Shrimp 🦐
Keep in mind.
🟣 Purple structure -> Monthly structure.
🔴 Red structure -> Weekly structure.
🔵 Blue structure -> Daily structure.
🟡 Yellow structure -> 4h structure.
⚫️ Black structure -> >4h structure.
Here is the Plancton0618 technical analysis , please comment below if you have any question.
The ENTRY in the market will be taken only if the condition of the Plancton0618 strategy will trigger.

CHFJPY RANGE. A possible move down to the daily support.The price has been trapped within this range since December last year. This last week, the price gave a fake break out of the resistance, then closed the week back within the range (forming a weekly pinbar). Within this upcoming week I can expect to see the price drop further down to the support once again around 166.305. Before I take entry on this pair, I'll wait for the price to once again retest and reject the range resistance at 117.613. If the price will give a daily rejection of that level, then I'll be interested in taking a short trade back to that support at 166.305.

EURGBP looking for direction 🦐EURGBP currently is moving between a tight range within 2 structures.
According to Plancton's strategy if the market will break below we can set a nice short order.
-––
Follow the Shrimp 🦐
Keep in mind.
🟣 Purple structure -> Monthly structure.
🔴 Red structure -> Weekly structure.
🔵 Blue structure -> Daily structure.
🟡 Yellow structure -> 4h structure.
⚫️ Black structure -> <4h structure.
Here is the Plancton0618 technical analysis please comment below if you have any question.
The ENTRY in the market will be taken only if the condition of the Plancton0618 strategy will trigger.

AUFDJPY for new recent highs 🦐AUDJPY is consolidating in a minor range below a structure at the previous highs.
According to Plancton's strategy, if the price will break above and the conditions will be satisfied we can set a nice long order.
–––––
Follow the Shrimp 🦐
Keep in mind.
🟣 Purple structure -> Monthly structure.
🔴 Red structure -> Weekly structure.
🔵 Blue structure -> Daily structure.
🟡 Yellow structure -> 4h structure.
⚫️ Black structure -> >4h structure.
Here is the Plancton0618 technical analysis , please comment below if you have any question.
The ENTRY in the market will be taken only if the condition of the Plancton0618 strategy will trigger.
Mar 9
Comment:

EURSEK 1D RANGE TRADINGRanges are repeatable trading chart patterns.
Ranges are consolidation chart patterns that can breakout either direction.
Each chart pattern will have defining trendlines of the support/resistance levels creating the pattern.
What ever time frame you are trading this chart pattern, wait for a candle close outside of the trendline in the direction of the breakout candle. (Our time frame preference is the Daily chart).
Add volume indicator - Volume is the amount of $ that went into a particular candle or in Forex the # of trades that took place.
Add ATR indicator - Volatility is the amount of price movement that occurred. Use the ATR to measure the price movement.
When you see descending Volume bars and descending ATR line (which indicates volatility) this shows
a dis-interest in traders to invest in this pair creating consolidation which creates the chart pattern.
Trade Management after there is a breakout candle close.
1 - Position size (compare volume bar to volume ma line).
a - Breakout candle must be 100% of volume average for a full position size.
b - If 75% of volume average then ½ position size. (To find 75% of Volume
look at the charts volume settings – divide smaller # into larger # = 75%+)
If not 75% then stand aside from the trade.
2 – If candle breaks out of a trendline, 15m before the close of the day prepare your buy/sell order.
Enter two trades. 1st trade will have a SL & TP. It will close automatically when the 1st TP is hit. 2nd
trade only has a SL and will be allowed to run. When 1st TP is hit move the SL to breakeven. Look
at ATR and prepare SL at 1.5 of ATR. Prepare 1st trade TP at 1 of ATR.
3 - SL for both trades will be 1.5 x ATR.
4 - 1st trade TP will be 1 x ATR.
5 - No TP on 2nd trade – letting profit run and adjusting SL to follow price.
6 - When 1st TP hit – move 2nd trade SL to breakeven.
7 - Adjust the 2nd trade SL to follow price.
*8 – After Breakout candle – if price closes back into chart pattern close trade don't wait for SL to be hit.
*9 - When breakout candle is more than 1 ATR from breakout candle open.
a - Enter 1st trade at candle close with ½ position size.
b - Enter 2nd trade with a pending limit order that is 1 ATR of breakout candle open.
c – Price should pullback to that pending limit order for 2nd trade.
d – If Price returns back into chart pattern close trade before SL is hit.

PG&E CORP 1D BULL FLAGBull Flags are a Range patter & they are repeatable trading chart patterns.
Bull Flags are a descending chart pattern that will have a directional bias (Long) depending on the previous incoming trend.
Each chart pattern will have defining trendlines of the support/resistance levels creating the pattern.
What ever time frame you are trading this chart pattern, wait for a candle close outside of the trendline in the direction of the breakout candle. (Our time frame preference is the Daily chart).
Add volume indicator - Volume is the amount of $ that went into a particular candle or in Forex the # of trades that took place.
Add ATR indicator - Volatility is the amount of price movement that occurred. Use the ATR to measure the price movement.
When you see descending Volume bars and descending ATR line (which indicates volatility) this shows
a dis-interest in traders to invest in this pair creating consolidation which creates the chart pattern.
Trade Management after there is a breakout candle close.
1 - Position size (compare volume bar to volume ma line).
a - Breakout candle must be 100% of volume average for a full position size.
b - If 75% of volume average then ½ position size. (To find 75% of Volume
look at the charts volume settings – divide smaller # into larger # = 75%+)
If not 75% then stand aside from the trade.
2 – If candle breaks out of a trendline, 15m before the close of the day prepare your buy/sell order.
Enter two trades. 1st trade will have a SL & TP. It will close automatically when the 1st TP is hit. 2nd
trade only has a SL and will be allowed to run. When 1st TP is hit move the SL to breakeven. Look
at ATR and prepare SL at 1.5 of ATR. Prepare 1st trade TP at 1 of ATR.
3 - SL for both trades will be 1.5 x ATR.
4 - 1st trade TP will be 1 x ATR.
5 - No TP on 2nd trade – letting profit run and adjusting SL to follow price.
6 - When 1st TP hit – move 2nd trade SL to breakeven.
7 - Adjust the 2nd trade SL to follow price.
*8 – After Breakout candle – if price closes back into chart pattern close trade don't wait for SL to be hit.
*9 - When breakout candle is more than 1 ATR from breakout candle open.
a - Enter 1st trade at candle close with ½ position size.
b - Enter 2nd trade with a pending limit order that is 1 ATR of breakout candle open.
c – Price should pullback to that pending limit order for 2nd trade.
d – If Price returns back into chart pattern close trade before SL is hit.

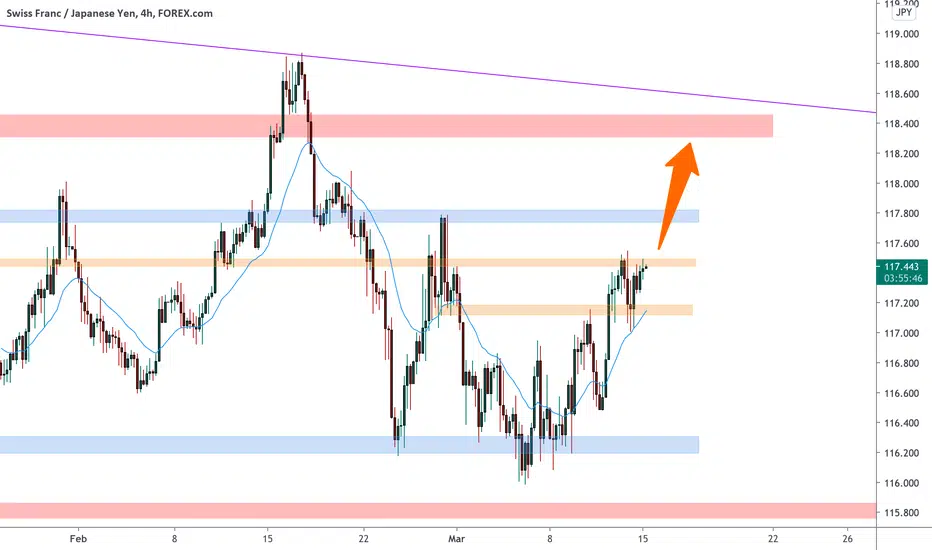
CHFJPY testing the range 🦐CHFJPY after the attempt to break below the 116.200 area started a new impulse.
The market has now approached the resistance level at 117.450 and according to Plancton's strategy if the conditions will be satisfied we can set a nice long order.
–––––
Follow the Shrimp 🦐
Keep in mind.
• 🟣 Purple structure -> Monthly structure.
• 🔴 Red structure -> Weekly structure.
• 🔵 Blue structure -> Daily structure.
• 🟡 Yellow structure -> 4h structure.
• ⚫️ Black structure -> >4h structure.
Here is the Plancton0618 technical analysis , please comment below if you have any question.
The ENTRY in the market will be taken only if the condition of the Plancton0618 strategy will trigger
EURGBP on. tight range 🦐EURGBP after our last analysis broke below the daily resistance and currently is moving between a tight range within 2 structures.
According to Plancton's strategy if the market will break below we can set a nice short order.
-––
Follow the Shrimp 🦐
Keep in mind.
🟣 Purple structure -> Monthly structure.
🔴 Red structure -> Weekly structure.
🔵 Blue structure -> Daily structure.
🟡 Yellow structure -> 4h structure.
⚫️ Black structure -> <4h structure.
Here is the Plancton0618 technical analysis please comment below if you have any question.
The ENTRY in the market will be taken only if the condition of the Plancton0618 strategy will trigger.
Mar 8
Comment:

WEEKLY RANGE FOR OPTION SELLING Weekly range for option selling based on
1) India VIX
2) Open interest
3) Chart price action

GODREJCP- at trendline supportGODREJCP has been trading near trendline support and moving in a range for the past 12 trading sessions.

EURJPY will break the range? 🦐EURJPY after the recent highs retraced back over the support where the price starts a range move between 2 structure.
According to Plancton's strategy if the price will break above we will set a nice long order.
--––
Follow the Shrimp 🦐
Keep in mind.
🟣 Purple structure -> Monthly structure.
🔴 Red structure -> Weekly structure.
🔵 Blue structure -> Daily structure.
🟡 Yellow structure -> 4h structure.
⚫️ Black structure -> <4h structure.
Here is the Plancton0618 technical analysis , please comment below if you have any question.
The ENTRY in the market will be taken only if the condition of the Plancton0618 strategy will trigger.

Bitcoin is heading northSince the last week of februari, the bitcoin price was ranging between ~$45000 & ~$52000. Now we see the price broke out of the range.
What's next?
First i want to talk about what actually happened
Because i spotted something interesting.
We where trading in a range, and at the same time price was forming a Wyckoff re-accumulation schematic. (in my opinion)
- Price formed the Range low --> Sellers climax
- Price formed the Range high --> Automatic rally
- Price made a daviation of the range low --> Spring
Price broke out above the range!?
This could mean that: we are going to see SOS (Sign of Strength) following the wyckoff.
Wich is falling inline with: long opportunities at the former range high. But if the bulls can build a lot off momentum, we might not see the test of the range-high!
My conclusion:
I think the bulls are ready for a next leg up. I'm aiming for ~$66000
Thank you for checking my analysis!
Do you have tips or other comments? Tell me please! I'm open for feedback!
