Rangetrading
Litecoin ranges for easy scalpsDrop a like if this helps you out, its free! :)
Range trading is one of my favourite trading strategies at the moment. It is highly profitable, highly rewarding and a good way to learn the markets. As you can see when a crypto enters a range like this one there are multiple opportunities to short the top and long the bottom of the range (yellow lines) for some very profitable scalps. And once the range breaks long/short the break of the range for some easy gains. If you want to be more aggressive you can play between the smaller ranges I marked off on the chart.
If you have any questions on how to create setups for these ranges feel free to dm me or comment below.
Happy trading!

THE BEST WAY TO TRADE RANGES ON CRYPTO (27% percent gain)Drop a like if this helps you out, its free! :)
This is the basic premise of how I trade. Usually after a big downwards or upwards move there is a period of consolidation (ranging) the best way to trade this 'Chop' is to plot a range high after a big bounce, then plot a range low from the low where the bounce came from. Create supply/demand zones off these range highs and lows. Lastly plot a mid range. Then simply buy tests of the demand zone and short test of the supply zone. Take profits at the mid range.
In this scenario we got 6 trades totalling a gain of 27% which is great!

Range trading: Forex as for 15/09/2020Here we publish signals of the indicator called “ Ranger ”. It was developed by our experts for intraday trading purposes.
This indicator is based on statistical analysis of the data and provides information about possible maximum/minimum values of the day (just right after the day has started) with certain probabilities.
What does this information give to the trader? Actually, a lot. First of all, trading signals. For example, if during a day the price approaches the upper (lower) mark, it can be concluded that it will not go higher (lower) prescribed mark today with already known probability. So, you can open a position opposite to the current movement, knowing in advance that it will be profitable with certain probability.
EURUSD
Long position 1
(The price today will not fall below this mark with a probability of 68%) 1.1813
Long position 2
(The price today will not fall below this mark with a probability 95%) 1.1783
Long position 3
(The price today will not fall below this mark with a probability 99%) 1.1753
Short position 1
(The price today will not rise above this mark with a probability of 68%) 1.1937
Short position 2
(The price today will not rise above this mark with a probability of 95%) 1.1966
Short position 3
(The price today will not rise above this mark with a probability of 99%) 1.1996
GBPUSD
Long position 1
(The price today will not fall below this mark with a probability of 68%) 1.2730
Long position 2
(The price today will not fall below this mark with a probability 95%) 1.2684
Long position 3
(The price today will not fall below this mark with a probability 99%) 1.2640
Short position 1
(The price today will not rise above this mark with a probability of 68%) 1.2945
Short position 2
(The price today will not rise above this mark with a probability of 95%) 1.2991
Short position 3
(The price today will not rise above this mark with a probability of 99%) 1.3036
USDJPY
Long position 1
(The price today will not fall below this mark with a probability of 68%) 105.22
Long position 2
(The price today will not fall below this mark with a probability 95%) 104.87
Long position 3
(The price today will not fall below this mark with a probability 99%) 104.51
Short position 1
(The price today will not rise above this mark with a probability of 68%) 106.13
Short position 2
(The price today will not rise above this mark with a probability of 95%) 106.49
Short position 3
(The price today will not rise above this mark with a probability of 99%) 106.84
Calculations are based on the historical data and history doesn’t necessarily repeat this particular day. About mentioned probabilities are not 100% and do not guarantee risk-free trading.

CADJPY 1D RANGE TRADINGRanges are repeatable trading chart patterns.
Ranges are consolidation chart patterns that can breakout either direction.
Each chart pattern will have defining trendlines of the support/resistance levels creating the pattern.
What ever time frame you are trading this chart pattern, wait for a candle close outside of the trendline in the direction of the breakout candle. (Our time frame preference is the Daily chart).
Add volume indicator - Volume is the amount of $ that went into a particular candle or in Forex the # of trades that took place.
Add ATR indicator - Volatility is the amount of price movement that occurred. Use the ATR to measure the price movement.
When you see descending Volume bars and descending ATR line (which indicates volatility) this shows
a dis-interest in traders to invest in this pair creating consolidation which creates the chart pattern.
Trade Management after there is a breakout candle close.
1 - Position size (compare volume bar to volume ma line).
a - Breakout candle must be 100% of average volume for a full position size.
b - If 75% of average volume then ½ position size. (To find 75% of Volume
look at the charts volume settings – divide smaller # into larger # = 75%+)
2 - Enter two trades.
3 - SL for both trades will be 1.5 x ATR.
4 - 1st trade TP will be 1 x ATR.
5 - No TP on 2nd trade – letting profit run and adjusting SL to follow price.
6 - When 1st TP hit – move 2nd trade SL to breakeven.
7 - Adjust the 2nd trade SL to follow price.
*8 – After Breakout candle – if price closes back into chart pattern close trade
*9 - When breakout candle is more than 1 ATR from breakout candle open.
a - Enter 1st trade at candle close with ½ position size.
b - Enter 2nd trade with a pending limit order that is 1 ATR of breakout candle open.
c – Price should pullback to that pending limit order for 2nd trade.

Range trading: Forex as for 14/09/2020Here we publish signals of the indicator called “ Ranger ”. It was developed by our experts for intraday trading purposes.
This indicator is based on statistical analysis of the data and provides information about possible maximum/minimum values of the day (just right after the day has started) with certain probabilities.
What does this information give to the trader? Actually, a lot. First of all, trading signals. For example, if during a day the price approaches the upper (lower) mark, it can be concluded that it will not go higher (lower) prescribed mark today with already known probability. So, you can open a position opposite to the current movement, knowing in advance that it will be profitable with certain probability.
EURUSD
Long position 1
(The price today will not fall below this mark with a probability of 68%) 1.1772
Long position 2
(The price today will not fall below this mark with a probability 95%) 1.1741
Long position 3
(The price today will not fall below this mark with a probability 99%) 1.1711
Short position 1
(The price today will not rise above this mark with a probability of 68%) 1.1911
Short position 2
(The price today will not rise above this mark with a probability of 95%) 1.1942
Short position 3
(The price today will not rise above this mark with a probability of 99%) 1.1972
GBPUSD
Long position 1
(The price today will not fall below this mark with a probability of 68%) 1.2698
Long position 2
(The price today will not fall below this mark with a probability 95%) 1.2654
Long position 3
(The price today will not fall below this mark with a probability 99%) 1.2610
Short position 1
(The price today will not rise above this mark with a probability of 68%) 1.2902
Short position 2
(The price today will not rise above this mark with a probability of 95%) 1.2946
Short position 3
(The price today will not rise above this mark with a probability of 99%) 1.2990
USDJPY
Long position 1
(The price today will not fall below this mark with a probability of 68%) 105.65
Long position 2
(The price today will not fall below this mark with a probability 95%) 105.29
Long position 3
(The price today will not fall below this mark with a probability 99%) 104.93
Short position 1
(The price today will not rise above this mark with a probability of 68%) 106.53
Short position 2
(The price today will not rise above this mark with a probability of 95%) 106.89
Short position 3
(The price today will not rise above this mark with a probability of 99%) 107.25
Calculations are based on the historical data and history doesn’t necessarily repeat this particular day. About mentioned probabilities are not 100% and do not guarantee risk-free trading.


EURAUD 1D RANGE TRADINGRanges are repeatable trading chart patterns.
A Range chart pattern will have a non-directional bias so the price can go either direction.
Each chart pattern will have defining trendlines of the support/resistance levels creating the pattern.
Whatever time frame you are trading this chart pattern, wait for a candle close outside of the trendline in the direction of the breakout candle. (Our time frame preference is the Daily chart ).
Add volume indicator - Volume is the amount of $ that went into a particular candle or in Forex the # of trades that took place.
Add ATR indicator - Volatility is the amount of price movement that occurred. Use the ATR to measure the price movement.
When you see descending Volume bars and descending ATR line (which indicates volatility ) this shows
a dis-interest in traders to invest in this pair creating consolidation which creates the chart pattern.
Trade Management after there is a breakout candle close.
1 - Position size (compare volume bar to volume ma line).
a - Breakout candle must be 100% of average volume for a full position size.
b - If 75% of average volume then ½ position size. (To find 75% of Volume
look at the charts volume settings – divide smaller # into larger # = 75%+)
2 - Enter two trades.
3 - SL for both trades will be 1.5 x ATR.
4 - 1st trade TP will be 1 x ATR.
5 - No TP on 2nd trade – letting profit run and adjusting SL to follow price.
6 - When 1st TP hit – move 2nd trade SL to breakeven.
7 - Adjust the 2nd trade SL to follow price.
*8 – After Breakout candle – if price closes back into chart pattern close trade
*9 - When breakout candle is more than 1 ATR from breakout candle open.
a - Enter 1st trade at candle close with ½ position size.
b - Enter 2nd trade with a pending limit order that is 1 ATR of breakout candle open.
c – Price should pullback to that pending limit order for 2nd trade.
d – If Price returns back into chart pattern close trade before SL is hit.

EURUSD AnalysisHey traders, here's my analysis of the EURUSD!
Price is ranging between supply and demand zones.
If price continues to stay inside range for another bounce, wait for a break of an inner trend line to enter.
If price breaks the range, wait for a retest of supply/demand zone to enter.
**Please follow me as I am new and trying to build reputation. Thank you!**

GOOGL 1D BEAR FLAGBear Flags are Ranges that are repeatable trading chart patterns.
Bear Flag chart patterns will have a directional bias depending on the previous incoming trend (short trade).
Each chart pattern will have defining trendlines of the support/resistance levels creating the pattern.
Whatever time frame you are trading this chart pattern, wait for a candle close outside of the trendline in the direction of the breakout candle. (Our time frame preference is the Daily chart).
Add volume indicator - Volume is the amount of $ that went into a particular candle or in Forex the # of trades that took place.
Add ATR indicator - Volatility is the amount of price movement that occurred. Use the ATR to measure the price movement.
When you see descending Volume bars and descending ATR line (which indicates volatility) this shows
a dis-interest in traders to invest in this pair creating consolidation which creates the chart pattern.
Trade Management after there is a breakout candle close.
1 - Position size (compare volume bar to volume ma line).
a - Breakout candle must be 100% of average volume for a full position size.
b - If 75% of average volume then ½ position size. (To find 75% of Volume
look at the charts volume settings – divide smaller # into larger # = 75%+)
2 - Enter two trades.
3 - SL for both trades will be 1.5 x ATR.
4 - 1st trade TP will be 1 x ATR.
5 - No TP on 2nd trade – letting profit run and adjusting SL to follow price.
6 - When 1st TP hit – move 2nd trade SL to breakeven.
7 - Adjust the 2nd trade SL to follow price.
*8 – After Breakout candle – if price closes back into chart pattern close trade
*9 - When breakout candle is more than 1 ATR from breakout candle open.
a - Enter 1st trade at candle close with ½ position size.
b - Enter 2nd trade with a pending limit order that is 1 ATR of breakout candle open.
c – Price should pullback to that pending limit order for 2nd trade.
d – If Price returns back into chart pattern close trade before SL is hit.

TRX has set a new range. How to trade it.BINANCE:TRXBTC recently broke out of a year long consolidation below 250 sat level.
I believe we have just seen a new range set for TRXBTC.
open longs @ 265-285 sats
TP 1 @ 385 sats
TP 2 @ 445 sats
Open shorts @ 468-450 sats
Keep an eye open for invalidation for this range. Nothing is set in stone and the markets are tricky.
Feel free to post your ideas in comment section below, would love to see them!

MCD 1D BEAR FLAG SHORT TRADEBear Flags are Ranges that are repeatable trading chart patterns.
Bear Flag chart patterns will have a directional bias depending on the previous incoming trend (short trade).
Each chart pattern will have defining trendlines of the support/resistance levels creating the pattern.
Whatever time frame you are trading this chart pattern, wait for a candle close outside of the trendline in the direction of the breakout candle. (Our time frame preference is the Daily chart).
Add volume indicator - Volume is the amount of $ that went into a particular candle or in Forex the # of trades that took place.
Add ATR indicator - Volatility is the amount of price movement that occurred. Use the ATR to measure the price movement.
When you see descending Volume bars and descending ATR line (which indicates volatility) this shows
a dis-interest in traders to invest in this pair creating consolidation which creates the chart pattern.
Trade Management after there is a breakout candle close.
1 - Position size (compare volume bar to volume ma line).
a - Breakout candle must be 100% of average volume for a full position size.
b - If 75% of average volume then ½ position size. (To find 75% of Volume
look at the charts volume settings – divide smaller # into larger # = 75%+)
2 - Enter two trades.
3 - SL for both trades will be 1.5 x ATR.
4 - 1st trade TP will be 1 x ATR.
5 - No TP on 2nd trade – letting profit run and adjusting SL to follow price.
6 - When 1st TP hit – move 2nd trade SL to breakeven.
7 - Adjust the 2nd trade SL to follow price.
*8 – After Breakout candle – if price closes back into chart pattern close trade
*9 - When breakout candle is more than 1 ATR from breakout candle open.
a - Enter 1st trade at candle close with ½ position size.
b - Enter 2nd trade with a pending limit order that is 1 ATR of breakout candle open.
c – Price should pullback to that pending limit order for 2nd trade.
d – If Price returns back into chart pattern close trade before SL is hit.

SANDUSDTSANDUSDT, is currently in a range. If a strong bounce from the pivot presents, we could see a return to the top of the pivot range. If pivot breaks trade is void. Not advice. Good luck!

SILVER 1D RANGE BUY TRADERanges are repeatable trading chart patterns.
Ranges are consolidation chart patterns that can breakout either direction.
Each chart pattern will have defining trendlines of the support/resistance levels creating the pattern.
Whatever time frame you are trading this chart pattern, wait for a candle close outside of the trendline in the direction of the breakout candle. (Our time frame preference is the Daily chart).
Add volume indicator - Volume is the amount of $ that went into a particular candle or in Forex the # of trades that took place.
Add ATR indicator - Volatility is the amount of price movement that occurred. Use the ATR to measure the price movement.
When you see descending Volume bars and descending ATR line (which indicates volatility) this shows
a dis-interest in traders to invest in this pair creating consolidation which creates the chart pattern.
Trade Management after there is a breakout candle close.
1 - Position size (compare volume bar to volume ma line).
a - Breakout candle must be 100% of average volume for a full position size.
b - If 75% of average volume then ½ position size. (To find 75% of Volume
look at the charts volume settings – divide smaller # into larger # = 75%+)
2 - Enter two trades.
3 - SL for both trades will be 1.5 x ATR.
4 - 1st trade TP will be 1 x ATR.
5 - No TP on 2nd trade – letting profit run and adjusting SL to follow price.
6 - When 1st TP hit – move 2nd trade SL to breakeven.
7 - Adjust the 2nd trade SL to follow price.
*8 – After Breakout candle – if price closes back into chart pattern close trade
*9 - When breakout candle is more than 1 ATR from breakout candle open.
a - Enter 1st trade at candle close with ½ position size.
b - Enter 2nd trade with a pending limit order that is 1 ATR of breakout candle open.
c – Price should pullback to that pending limit order for 2nd trade.
d – If Price returns back into chart pattern close trade before SL is hit.

BAC 1D BEAR FLAGBear Flags are Ranges which are repeatable trading chart patterns.
Bear Flag chart patterns will have a directional bias depending on the previous incoming trend.
Each chart pattern will have defining trendlines of the support/resistance levels creating the pattern.
Whatever time frame you are trading this chart pattern, wait for a candle close outside of the trendline in the direction of the breakout candle. (Our time frame preference is the Daily chart).
Add volume indicator - Volume is the amount of $ that went into a particular candle or in Forex the # of trades that took place.
Add ATR indicator - Volatility is the amount of price movement that occurred. Use the ATR to measure the price movement.
When you see descending Volume bars and descending ATR line (which indicates volatility) this shows
a dis-interest in traders to invest in this pair creating consolidation which creates the chart pattern.
Trade Management after there is a breakout candle close.
1 - Position size (compare volume bar to volume ma line).
a - Breakout candle must be 100% of average volume for a full position size.
b - If 75% of average volume then ½ position size. (To find 75% of Volume
look at the charts volume settings – divide smaller # into larger # = 75%+)
2 - Enter two trades.
3 - SL for both trades will be 1.5 x ATR.
4 - 1st trade TP will be 1 x ATR.
5 - No TP on 2nd trade – letting profit run and adjusting SL to follow price.
6 - When 1st TP hit – move 2nd trade SL to breakeven.
7 - Adjust the 2nd trade SL to follow price.
*8 – After Breakout candle – if price closes back into chart pattern close trade
*9 - When breakout candle is more than 1 ATR from breakout candle open.
a - Enter 1st trade at candle close with ½ position size.
b - Enter 2nd trade with a pending limit order that is 1 ATR of breakout candle open.
c – Price should pullback to that pending limit order for 2nd trade.
d – If Price returns back into chart pattern close trade before SL is hit.

Pro Trader 80-20 StrategyThe 80 – 20 Trading Strategy
The basic idea behind this pro trading strategy is around a simple chart price formation. Particularly, a candlestick bar with a long body and small wicks. Usually, these types of candlestick patterns signal a market reversal. However, there are some price characteristics that need to confirm the reversal signal.
Here are the pro rules:
The body of the candle must take at least 80% of the total candlestick size.
The wicks of the candle must constitute less than 20% (ideally 10% on each side).
Today candle must open 5-15 ticks below (above) the momentum candle (this is meant as a guideline).
Once the market breaks above the momentum candle low you buy.
Stop-loss can be placed below today’s candle low.
Take quick profits as this is a scalping strategy (don’t expect large profits from this chart pattern).
Note* This strategy works best in the futures market, but if you’re a smart trader you can work out some variation of it to make it work on your favorite market be it stocks, forex, or cryptocurrencies.

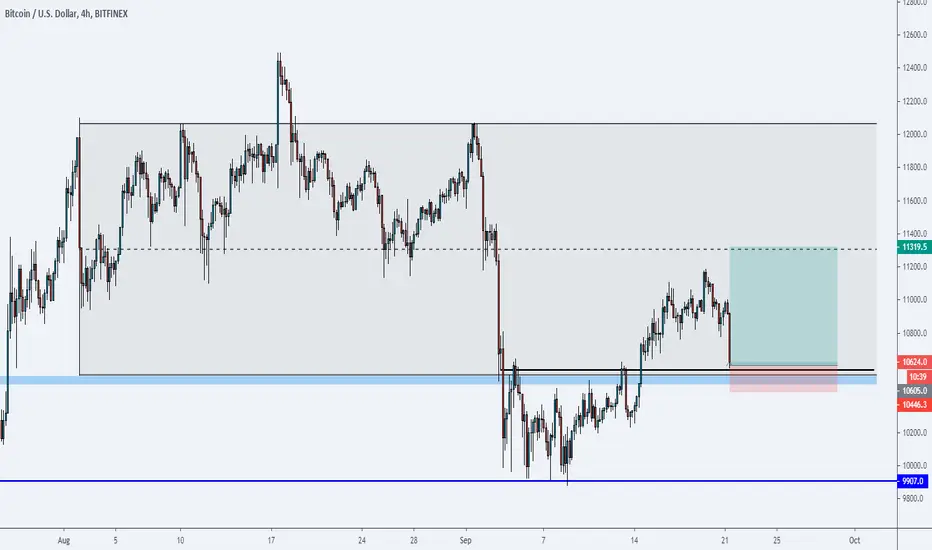
Could the Long-Term Trend Be Fading?This is an interesting pair. After making a clear trend higher on the daily chart, price has not yet been able to breakout of the recent consolidation and form new higher highs to continue the trend.
As the attached 4 hour chart shows; there are clear range support and resistance levels in play.
Aggressive traders could look to make range trades from both of these levels should any high probability price action be fired off.
More conservative traders could look to see if the momentum building creates an explosive intraday breakout signal.

Bulls should to take control of LINK for the next 24-48hDisclaimer: This is not financial advice
In high leverage trading your entry is a matter of life or death, you need to have patience and to not let fear of missing out drive you into opening rushed positions. Map out your trades in advance and wait for the right entry. Our aim is to capture quick & safe profits, not to predict the future, this is possible only if we fight for a good entry. So if you're nervous and itching to open a position then take a few deep breaths and don't trade!
Yesterday we were short LINK with TP1 14 (Tradingview removed my analysis because it turns out I had broken some house rules), now 14 is holding quite well so far and after today I expect this area to hold short term. Not just that, LINK could very well form a range here between 12 and 17. Anywhere between 14 and 12 is a longs' area, the lower 12.xx is perfect for high leverage longs targeting 14, 16 and 17. I wouldn't short here and would be looking to take profit on any open shorts if I haven't yet. We are looking for longs .
Entry: 12-14 (the closer to 12 the higher the leverage you can use) SL: 12 TP1: 16 TP2: 17

PLNT 1D BULL FLAG LONG TRADEBull Flags are Ranges which are repeatable trading chart patterns.
Bull Flag chart patterns will have a directional bias depending on the previous incoming trend.
Each chart pattern will have defining trendlines of the support/resistance levels creating the pattern.
Whatever time frame you are trading this chart pattern, wait for a candle close outside of the trendline in the direction of the breakout candle. (Our time frame preference is the Daily chart).
Add volume indicator - Volume is the amount of $ that went into a particular candle or in Forex the # of trades that took place.
Add ATR indicator - Volatility is the amount of price movement that occurred. Use the ATR to measure the price movement.
When you see descending Volume bars and descending ATR line (which indicates volatility) this shows
a dis-interest in traders to invest in this pair creating consolidation which creates the chart pattern.
Trade Management after there is a breakout candle close.
1 - Position size (compare volume bar to volume ma line).
a - Breakout candle must be 100% of average volume for a full position size.
b - If 75% of average volume then ½ position size. (To find 75% of Volume
look at the charts volume settings – divide smaller # into larger # = 75%+)
2 - Enter two trades.
3 - SL for both trades will be 1.5 x ATR.
4 - 1st trade TP will be 1 x ATR.
5 - No TP on 2nd trade – letting profit run and adjusting SL to follow price.
6 - When 1st TP hit – move 2nd trade SL to breakeven.
7 - Adjust the 2nd trade SL to follow price.
*8 – After Breakout candle – if price closes back into chart pattern close trade
*9 - When breakout candle is more than 1 ATR from breakout candle open.
a - Enter 1st trade at candle close with ½ position size.
b - Enter 2nd trade with a pending limit order that is 1 ATR of breakout candle open.
c – Price should pullback to that pending limit order for 2nd trade.
d – If Price returns back into chart pattern close trade before SL is hit.

EURNZD 1H BEAR FLAG 2 SHORT TRADE SETUPSSETUP 1 SHORT TRADE
Enter with 1H Candle Close
below Bear Flag Bottom
SETUP 2 SHORT TRADE
Enter with 1H Candle Close
below Support level @ 1.8056
Measure TP for both trades
@ 1.7976
SL above Swing High

EURCHF extreme consolidation 🦐EURCHF is in a extreme consolidation range between 2 weekly levels (red structures) around 1.07 and 1.08 area
Market reach the monthly discening trendline (purple) and the two 4h structure around between 1.07450 and 1.07800 are keeping the price in a tight range.
After a range movement we expect the market to take a strong direction.
We will wait for a clear break of the range to set an order accordingly.
–––––
Follow the Shrimp 🦐
Here is the Plancton0618 technical analysis, please comment below if you have any question.
The ENTRY in the market will be taken only if the condition of Plancton0618 strategy will trigger.

RCL 1D BEAR FLAGBear Flags are a Ranges pattern which are a repeatable trading chart patterns.
Bear Flag chart patterns will have a directional bias depending on the previous incoming trend.
Each chart pattern will have defining trendlines of the support/resistance levels creating the pattern.
Whatever time frame you are trading this chart pattern, wait for a candle close outside of the trendline in the direction of the breakout candle. (Our time frame preference is the Daily chart).
Add volume indicator - Volume is the amount of $ that went into a particular candle or in Forex the # of trades that took place.
Add ATR indicator - Volatility is the amount of price movement that occurred. Use the ATR to measure the price movement.
When you see descending Volume bars and descending ATR line (which indicates volatility) this shows
a dis-interest in traders to invest in this pair creating consolidation which creates the chart pattern.
Trade Management after there is a breakout candle close.
1 - Position size (compare volume bar to volume ma line).
a - Breakout candle must be 100% of average volume for a full position size.
b - If 75% of average volume then ½ position size. (To find 75% of Volume
look at the charts volume settings – divide smaller # into larger # = 75%+)
2 - Enter two trades.
3 - SL for both trades will be 1.5 x ATR.
4 - 1st trade TP will be 1 x ATR.
5 - No TP on 2nd trade – letting profit run and adjusting SL to follow price.
6 - When 1st TP hit – move 2nd trade SL to breakeven.
7 - Adjust the 2nd trade SL to follow price.
*8 – After Breakout candle – if price closes back into chart pattern close trade
*9 - When breakout candle is more than 1 ATR from breakout candle open.
a - Enter 1st trade at candle close with ½ position size.
b - Enter 2nd trade with a pending limit order that is 1 ATR of breakout candle open.
c – Price should pullback to that pending limit order for 2nd trade.
d – If Price returns back into chart pattern close trade before SL is hit.

CAD IndexOver the last two days, CAD pairs have started to show strength causing the index to break above a descending trend line. Price seems it is still respecting the months long range this chart has been in. I'll be watching for CAD strength to show in the pairs. As the Index moves to the top of the range, new trends could form.
