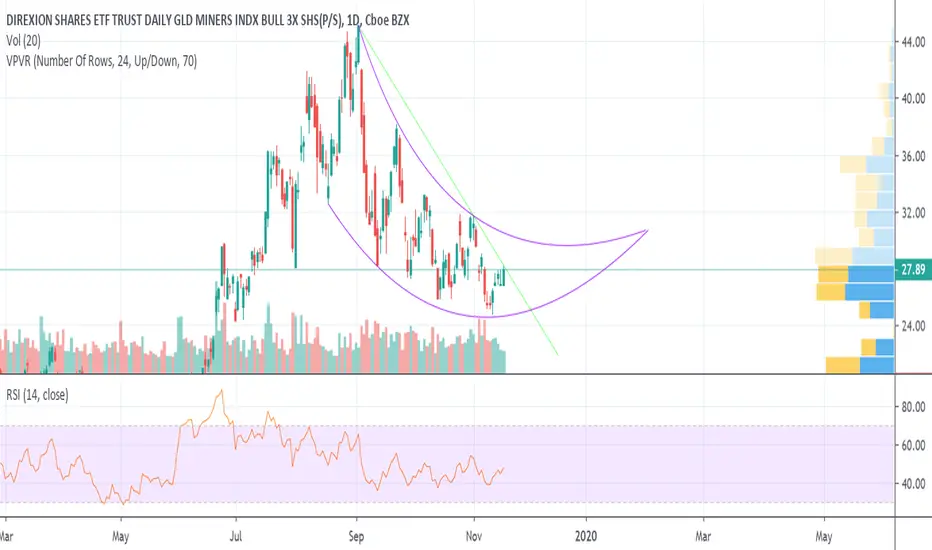
Miners rounding bottom?The gold miners' ETF is testing its downward trend line again today, and may be in the process of making a rounding bottom. Buy low in the crescent or watch for a bullish trend line break. Gold has been showing some strength due to Fed policies and dollar weakness. It could break out upward on news of either significant market weakness or a breakdown in the US dollar.
Ratecut
ORBEX: TOO Many "Insurance" CUTS! Where Risk Takes Us?In today’s #marketinsights video recording, I talk about #Fed's rate cut and identify the main components leading to their decision.
I also talk about their decision toolbox and wonder whether they should start looking at slowing inflation with a different eye? One that doesn't look at trade wars with such certainty.
With Fed, BOC and now also BOJ out, we can't miss the opportunities appearing on #cadjpy and #usdcnh, can we?
Stavros Tousios
Head of Investment Research
Orbex
This analysis is provided as general market commentary and does not constitute investment advice

Uncertainties remain! Dovish statement We just received the 25 basis points rate cut. The market had already priced it in.
Powell just released the statement. It seems to be a dovish one . He will start his speech at 2:30pm, where the market will try to understand the possibility of a 4th rate cut in December.
The CBOE Fed tool has the 4th cut in December at 26%.
We should see the yield curve steepen.
-----
Economic reports
GDP report was positive/neutral.
ADP employment change headlines were good, but analyst are not happy reading into the details.

TLT Inverse Bond Play Before MeetingThe play for OTM calls on TLT right now is a good risk to reward for myself given the numerous positive potential outcomes. If they don't cut rates, I expect TLT to make a very nice upward move due to bond prices going up and maturity going down.
If they cut rates, I still expect bond maturities to go down and for TLT to go up.
With the current landscape I am feeling very comfortable with the prices I got for my OTM calls and the ROI.
I'll update later today after the meeting which is less than two hours away currently.
Happy trading everyone, try and be as positive of an impact as you can be everyday. Good luck with any of your plays today
-golddolphin

#SPY #SPX500 will the FED cut rates today? 30.10.2019While the SP500 trading at all time high and Mainstream media and the American Government is just talking about how wonderful, bright and happy everything is i just want to share the technical chart of 2019 Federal Reserve Fed Cuts on the SP500 Chart which were done this year.
31.07.2019 2,25% SP500 dropped 8-9%
18.09.2019 2,00% SP500 dropped 5-6%
Economist and Media are expecting a 3rd Rate cut this year today.
And probably they will do it and announce that this will be the last rate cut they are doing.
So there is a big question mark how the market will react today, and past performance is no indication for future events.
here you can watch the Livestream today:
www.youtube.com
Trade Safe!
===========================
You can copy and follow my Trades on eToro
www.etoro.com
===========================
#FED #FEDCUTRATES #TECHNICALANALYSIS #SP500 #SPX500 #SPY $SP500 $SPX500 $SPY #SP500INDEX

Day trading and swing trading trend lines for goldXAUUSD is still in its long-term falling channel, but it's established both short-term and mid-term uptrends.
If you're day trading gold, you'll want to exit if it falls below the steeper trend line. (Honestly probably too late for a day trade entry at this point.) I expect it will break this trend line soon and move sideways along the volume support.
If you're swinging gold, watch my gentler blue trend line. Enter near the trend line if it falls that low, and exit if it falls below the line. With the dollar weakening, I expect gold to hold this trend line at least until the Fed meeting.
If the Fed cuts interest rates, gold should break upward out of its falling channel. If the Fed doesn't cut interest rates, gold will fall through the trend line. You can limit losses by setting a stop loss beneath the trend line ahead of the Fed meeting.

AUDUSD - Possible bear continuationAs we can see from the chart above, the cross reached a very important resistance first established back in May as a support and tested in June; the "change of polarity" happened in July, when price dropped of more than 4% in 2 trading weeks. As the saying goes: "the first test never fails"; it didn't indeed. We could be in front of a retest of the resistance, which, moreover, coincides with the 50% of Fibonacci level (as you can see from the chart). So here's what I expect: price will drop at least to 0.6755, if not to 0.6725, where there's a high liquidity zone.
In addition, some economists expect one more rate cut from the RBA for 2019 and the likely adoption of QE, in order to accomplish the inflationary target of 2-3% (CPI), which is now at 1.6%. The next CPI data will be published on October, 30th and will likely remain at 1.6%.

ROKU - Will it fill the gap?Today's market showed some breath, specially for software. Which is normally a growth>value story.
$118 is the closing gap resistance.
Important market sentiment:
Tomorrow October 4th will be a deciding move, as we get the employment report before the open (8:30am ET).
With recent continued weak manufacturing data, this employment data could tell us if a recession is coming, and more importantly (short-term), if the FOMC is going to cut rates again.
The market has the cut now priced with a probability of 90% at the end of this month.

Gold AnalysisGold is a safe haven at this time.
A rate cut is priced in of US Fed after worse than expected ISM Manufacturing and Non-Manufacturing PMI.

IWM short setup in the worksA break below 156-ish is bearish in my opinion, and increases the likelihood that IWM will retest the bottom of its descending channel. In addition to that, the RSI is showing overbought conditions. If it breaks below the 156-ish level, I will short it via puts and look for a risk/reward somewhere in that area I noted.
Fundamentally, it all hinges on the Fed meeting later this afternoon. I still believe a meager 25 BP rate cut will send the market hopesters to their "safe places," while they pout. Therefore, sending the markets lower while they sulk in their own pity.
Don't be a hopester ... use solid analysis. DO YOUR OWN RESEARCH AND BE RATIONAL ABOUT IT!! Yes, I know the markets are irrational at times. However, you can still give yourself an edge that the hopesters don't have by analyzing instead of guessing (gambling).

FOMC tool - 40% NO-CUT Using the FOMC tool, we see a:
25 basis points rate-cut --> 58.8%
NO rate-cut --> 41.2%
To get these rates:
www.cmegroup.com
Tomorrow's volatility will surely grow, even if the FOMC cuts rates; with these percentages, we can expect J. Powell to suggest no more cuts in the future.
You can also expect Trump to fight this, hard.
**FOMC meeting to take place in 26 hours.

EUR/USD prior the ECB Meeting this Thursday I am thinking Euro/Dollar could finish a bigger corrective structure, however during the ECB meeting I am also expecting another move to the downside. After the meeting is done there could be bigger long swing playing out since I am assuming that most of the ECB rate cut on Thursday has been already priced in.

NZDUSD Likely To Decline Further Towards 61 Cents!
Have a look at the snapshot above. It represents the nearby support and resistance levels on monthly TF of NZDUSD. A convincing close of monthly candle below 0.64000 would likely confirm probable bearish continuation until 0.61000 where the next support lies.
Looking at the main chart, there is a nice descending channel continuation! Should the monthly candle and this week's candle close below 0.64000 we can take this pair SHORT to target 0.61000 level.
The fundamental outlook too is against the KIWI as global slowdown due to trade war is affecting the KIWI. With the Tradewar far from over and RBNZ leaning towards slashing rates again to boost the economy, a visit to 0.61000 is highly likely.
This just represents my outlook on this pair, shall a trade opportunity arise i will post it in a new thread.

SPY remains with a specified range range:
$281.72-$294.15
Going long the lower end of the range and shorting the upper end of that range has been profitable for the past few trading weeks.

FED Rate Cut Outlook & TradeWar May Take SAFEHAVEN YEN TO 105.00INSTANT ENTRY AT AROUND: 107.350 LEVEL
POSITION TYPE: SHORT
STOP LOSS: 109.500
TAKE PROFIT: 105.00
RR: 1:1
SHALL THERE BE ANY UPDATES I WILL PROVIDE THEM IN THE THREAD BELOW. BENEATH YOU CAN FIND THE ANALYSIS BEHIND THIS TRADE SETUP
As seen from the main chart, the weekly TF shows the price respected by a long term held triangle (black lines). The blue line represents another concrete trendline which was broken as the weekly candle closed comfortably outside the trendline. As of now the next support that lies is present at 105.00 level where the main triangle's lower trendline is present. So we can expect the price to make its way to that level in the coming weeks.
On the fundamental perspective, the prospect of US interest rate cut has already sent the greenback tumbling against all major currencies. USDJPY is the most sensitive pairs of them all. Inevitably the FED would cut the interest this year and it might be two times potentially! although this event has not been priced in at 100% in the markets, the coming weeks may seem to reveal further USD weakness as the prospect of eventual rate cut gets priced in!
Additionally, the trade war is not helping the greenback either against the yen, as any negative news or developments seems to favor traders rushing for safehaven yen. As said the coming weeks are crucial and will show clear picture as to where the price headed but at the moment the technical and fundamental picture are both in our favor.

GBPUSDThe Sterling Pound
The markets were optimistic regarding Germany’s Merkel agreement for the Irish backstop. The divorce with the EU, and Boris Johnson’s plan to meet with the Merkel will probably not accomplish any progress but headlines have moved Sterling a little higher.

Swiss Franc(CHF) to fall ahead! With ECB committed to ease in September, pressure is increasing on SNB to further cut rates towards minus 1 percent from current minus 0.75%. CHF has appreciated considerably as a safe haven move recently making higher possibility of intervention by SNB. chart structure has started to favor fall in Swiss franc in coming weeks. Further looking at SMI 20 strong bounces on dip support that franc is going down by SNB actions ahead. It makes high interest rate currencies good buy against chf... USDCHF, CADCHF, AUDCHF, NZDCHF and GBPCHF may remain bid and shall be accumulated on dips for solid gains in coming weeks.

Opportunity Knocks For The NZDJPYWith global equities continuing to be supported by favorable liquidity conditions and little else, it was really just a matter of time before risk assets came under more pressure. The biggest red flag was flying in the bonds market, where global bonds have continued to rally sending yields sharply lower. Equities rallying strong along with bonds is not sustainable, and considering slowing global growth, trade conflicts, and political unrest risk assets have appeared the most vulnerable. The constant flows into bonds highlights the increasing uncertainty and demand for safety.
The current equities decline started when the Fed disappointed doves with only a 25bp cut, delivered with a neutral statement. The decline was accelerated by news of new tariffs that will be imposed on China by the Trump administration. This sparked a sell off of risk assets, and flows into safe havens such as JPY and CHF. The USD missed the boat this go around partly due to the unwinding of the EURUSD carry trade caused by the quick spike in volatility. There were also some EM factors that contributed to the USD decline, but those are outside the scope of what we are trying to convey here. After all, we are here for the NZDJPY.
NZD is a high beta currency strongly tied to the performance of the global economy. It is also directly impacted by the US-China trade conflict, just like its cousin the AUD. Today the RBNZ surprised the market by cutting 50bp (market was expecting 25bp). Soft inflation expectations wiped out any positive the currency picked up on strong employment figures yesterday, business confidence remains very poor, and the RBNZ has even floated the idea of unconventional monetary policy. All of these things should keep the NZD weak over the medium term.
On the technical side, we have now traded through key monthly support, which should now serve as a barrier for any rally attempts. Over the coming months we are looking for continued declines towards 65.00 and then 62.00.


BTCTrump hits Beijing with tariffs this coming September. The markets retaliate and consumers run to Bitcoin as a speculative store of value.

The last time the FED starting cutting Rates..... Please have a look at the last time that the FED began lowering rates; they began with 25 basis points, and they ended at ZERO percent.

Fed action further distanced SP500 from 3000This is a follow up to GAMS' first post.
The Fed's 25bps cut, coupled with hawkish verbiage, added more weight to the already dwindling American corporate earnings and further confirmed GAMS's bearish view towards the rest of 2019.
Strong USD will create strong headwind to heavy-weight components in SP500 like MSFT, AAPL, etc who rely heavily on foreign revenues. As corporate earnings start to take a nose dive as it is about to now, the Fed wouldn't have any ammunition to turn the tide any more.
GAMS is extremely bearish with USD and SPX, in the medium to long term. We see GLD, JPY and long UST duration as safe havens in this environment.
To express above views, GAMS had entered below strategies.
1. Bull put spread on GLD, 132/152, Dec2019 exp. This creates upfront credit
2. Credit from leg 1 to buy TLT
3. Monthly TLT Covered Call
4. ITM put on SPY, Dec2019 exp.

