Euro PullbackEuro pair retraced clearly after an impulse wave and i am looking forward to long the pair again. in my analysis i labeled an extended wave 3 meaning that the current pullback better not break below 1.1268.
however minor low can take place near 1.1285 before upward continuation might happen.
do not forget to risk manage your trade because of the geopolitical tensions and the possibility of stronger Dollar if Russia invades Ukraine.
Rates

SPY vrs 40 YEARS OF DECLINING INTEREST RATESIt just gets curiouser and curiouser.
Will Powell act? He is definitely no Volker! About 1982, under Volker, 30 year rates hit 18%. What next: a long period of low rates with catastrophic inflation or ...
door #2 - Higher rates and a stagnant or falling market.
I may be wrong, but I suspect the FED doesn't want to hurt THE MONEYED CLASS unless they have to.

10 Year Rate: Price keeps moving up!Quick Analysis on 10 Year Treasury Yield on a 1D Linear Chart.
1) The US 10 Year Treasury Yield has been respecting a falling channel for multiple decades going back to the 1980s.
2) It has broken out of the top trendline of the falling channel with a recent re-test of the S/R line.
3) The measured move of the falling channel would bring it back to Pre-2008 ranges (LONG-TERM). The measured move is noted.
4) There was a Bull Flag Pattern forming on the charts within the falling channel pattern, which helped the price move higher. The measured move for the SHORT-TERM is noted.
5) I discussed this breakout in the first week of December 2021 when the price was still at around 1.40ish. PAY ATTENTION!
What are your opinions on this?
If you enjoy my ideas, feel free to like it and drop in a comment. I love reading your comments below.
Disclosure: This is just my opinion and not any type of financial advice. I enjoy charting and discussing technical analysis. Don't trade based on my advice. Do your own research! #cryptopickk

$DXY needs to hodl the line 👁🗨*This is not financial advice, so trade at your own risks*
*My team digs deep and finds stocks that are expected to perform well based off multiple confluences*
*Experienced traders understand the uphill battle in timing the market, so instead my team focuses mainly on risk management*
FOMC meeting next week, February 16, 2022. Here are our expectations for $DXY.
!! This chart analysis is for reference purposes only !!
If you want to see more, please like and follow us @SimplyShowMeTheMoney

Fed funds futures pricing in 5 rate hikes in 2022?Economists are forecasting anything from 3 to 7 hikes in 2022 while the Fed funds futures market appear to be pricing in at least 5 rate hikes in 2022, starting with the first, a 25bp hike, at the March FOMC meeting. The Fed's current target range is 0 to 0.25%. March futures (ZQH2022) imply a rate of 0.23 suggesting that the lower target rate will be raised from 0 to 0.25.
Assuming the the Fed sticks with a 25bp increment, the futures currently are pricing in at least 5 hikes as we see May futures (ZQK2022) implying a rate of 0.565, July (ZQN2022) implying 0.79, October (ZQV2022) with 1.06 & Dec (ZQZ2022) with 1.235.

Markets price in five Fed rate hikes in 2022, cut by 2025Fed policy bets are evolving, which may explain why gold has managed an upswing alongside the S&P 500 while the US Dollar has fallen so far in February.
Policymakers’ increasingly assertive posture on stimulus withdrawal coupled with supportive economic data – most recently, January’s payrolls report – have driven up near-term rate hike expectations. The longer view has softened, however.
Fed funds futures imply that the push to price in five 25bps rate hikes for 2022 has likewise seen the 2023 outlook soften, from three such increases to two. A single rise seems to have drifted out to 2024, implying adjustment to a more gradual path after fireworks this year. Strikingly, a cut is now priced in for 2025.

Big Four Macro Overview: Part 5For more detail please refer to the first four pieces in the series (linked below) and the accompanying charts.
Markets entered 2022 with well established trends and trading ranges, but I believe that the coming year holds significant potential for change. This is particularly true in the equity and treasury markets. Because much of the outlook hinges on inflation (see below) it will be particularly important to monitor inflation related markets.
Importantly, while it's easy to make the case that rates should rise significantly this year, modern financial history suggests that rising rates are likely to break the most vulnerable financial link. If that link has the ability to create systemic disruption, rates will fall again, even if inflation is high, as the market runs to the quality of treasuries.
In my opinion, the most important trend of the last four decades has been the decline and subsequent quiescence in the inflation rate. Falling and low inflation allowed Treasury rates to decline. Falling Treasury rates supported equity valuations and home prices. They also enabled the wholesale financialization of the economy and allowed both public and private entities to add leverage without consequence. Importantly low and steady inflation also created the negative correlation between treasury and equity. Without that correlation 60/40 and risk parity strategies may well be in danger.
Inflation: My working thesis has been that many of the trends that supported disinflation have reversed and that rising inflation will act as a headwind to investment for the next decade. Going into 2020 I believed that the stage for higher inflation had already been set and that higher inflation would result in higher rates and ultimately equities.
Consider that in early 2020:
• The output gap had closed for the first time since the Great Financial Crisis.
• The economy had just reached full employment with a U-3 Unemployment rate @ 3.5%.
• Wages as measured by the Employment Cost Index were rising @ +4.4% YOY rate.
• The Cleveland Fed Median CPI had recently set a 10 year high.
If not for the pandemic, by early 2021. the Federal Reserve would have been forced to respond to rising inflation by increasing rates. Instead, Covid crushed the demand side of the economy, derailing the growing inflation. Now the extreme fiscal and monetary response combined with disruptions in logistics and labor have combined to create very high inflation. While I think that many of the issues creating this burst of inflation are moderating, the same set of factors that were reversing in 2020 are still in place. In short, I believe that the broader trend has changed and that when everything settles out, will end up significantly in excess of the Feds 2% average target.
Bottom Line: Above trend growth in inflation and monetary/fiscal tightening suggest higher volatility and a significant chance that many of the trends that have defined the last few decades will falter. My sense of the economy is that the best growth has already occurred as the result of historically supportive fiscal and monetary policies and now both paths are turning restrictive (see the second part of this series for a more in depth discussion) and markets will likely reflect that reality.
Rates:
• Bonds remain in a bull market defined by a broad declining channel, but rising inflation could easily change the trend. The most likely catalyst to end keep rates below 3.25% would be a financial accident created by higher rates.
Equities:
• SPX remains in a technical bull market and there are no overtly bearish behaviors evident in the longest perspectives. However short term weakness can easily morph into a bear market.
Commodities:
• Goldman Sachs Commodities index is in the center of a broad 14 year range, bounded essentially by the low set during the financial crisis and the resultant 2011 high. range. The most notable/useful current chart feature is the clear uptrend from the 2020 pandemic low. Until that uptrend is broken, the most immediate trend is to higher prices.
US Dollar:
• The wide macro range, 70.70 - 121.02 has contained price action over most of my trading career but volatility is more cyclical than price. These periods of low vol. set up conditions that often lead to explosive moves.
Now, back to the charts!
Good Trading:
Stewart Taylor, CMT
Chartered Market Technician
Shared content and posted charts are intended to be used for informational and educational purposes only. The CMT Association does not offer, and this information shall not be understood or construed as, financial advice or investment recommendations. The information provided is not a substitute for advice from an investment professional. The CMT Association does not accept liability for any financial loss or damage our audience may incur.

Which Way Next?The market is stuck sideways this week. Perhaps the breakout will be determined by external events rather than the FED under Powell who is certainly no Volker...

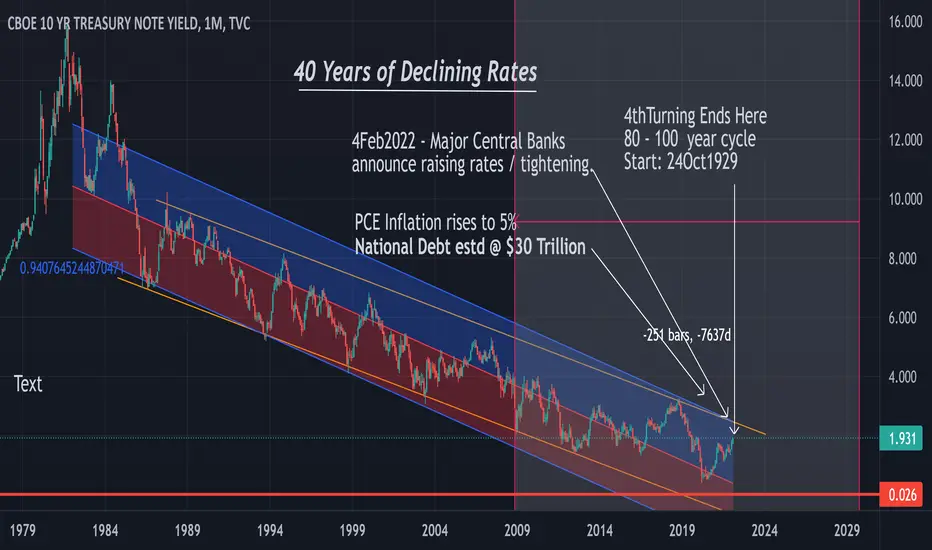
THE 40 YEAR BEAR MARKET IN 10 YEAR TREASURY NOTE INTEREST RATEThe attached chart shows 40 years of declining 10 year rates. As we all know, that rate is the basis for mortgage rates and just about everything else. During that half cycle the housing market boomed, the stock market boomed and generally speaking, corporations and individuals prospered.
But that trend has ended.
Thursday I would have said that rates would either remain low for an indefinite period while inflation soared or rates would be raised to quell inflation. But Friday Central Banks around the world announced tightening.
The party is over!
It is time to batten down the hatches, lock in long term profits on stocks, rentals and any other investments that correlate inversely with interest rates.
Obviously the major players saw this coming and started bailing at the first of2022.
Now us little fish must do what we can to avoid losing the wealth we have.
As an aside, it was announced last year that Bill Gates was diversifying into farm land. Obviously that anticipates food shortages and inflation.............
I will post more on this once the picture becomes clearer.
midnitepoet
SP500 selling pressure might not be completed however missing leg higher is probable for the american indices in which we can see a completion of wave 4 soon.
the selling pressure was because of the rate hike pricing from the FED.
wave can be simple or complex however we will wait for more confirmation to see the pattern that will show on this wave before any buying opportunity.

DJI WEEKLY - FIB RETRACEMENT - CORRECTION MODE - MEGAPHONEFollowing along with the MEGAPHONE theme from a previous chart taking the first touch of the MEGAPHONE TOP, as the top. Being a weekly chart, we need to see the weekly close below the RIBBON for CONFIRMATION that we are indeed heading into a period of CORRECTION. Given that the FEDERAL RESERVE will meet next week and have already stated that they will not move in to bolster the stock market I hazard a guess that the DOW will continue its current downward trend. As we all know the FED is slow to respond as that is the nature of the data cycle, they are at least 3-6 months behind real-world. We also need to keep in mind that the FED is an INFLATION fighting mode which means they will be announcing a rate rise of 25 basis points at the very least for a MARCH START, which the market has already priced in. My gut feeling is that they need to raise rates by 50 basis points to douse inflation, which the market has not priced in.
We have a CHINESE NEW YEAR coming up and harsh WARNINGS FROM the WEF and DAVOS.
Take care and stay safe.
NOT FINANCIAL ADVICE

Mortgage Rates Back In An Uptrend Trend On 30 Year-Fixed Historically in America the interest rate for a 30 year fixed has been in a multi-decade down trend. As of January 2021 the rate for a 30 year fixed dropped to a historical low of around 2.65% and has since reversed in trend. This year we can potentially see rates continue to rise up to 3.75% as we're in secondary uptrend on the line chart. Currently we're at around 3.45% up 30% from 2.65% we seen last year.

$QQQ bounces for now$QQQ bounced today as shown on the weekly chart
$QQQ has still not experienced a 13/34-week EMA bearish crossover
10 year rates briefly moved above 3 year highs but have since stalled
CPI numbers were hot today and market participants are pricing in a March rate hike

10Y YIELD CRATERING SOON? EXTREME FEAR EXPECTED IN 1Q OF 2022Hello traders & investors!
As we look into the beginning of 2022 and use 10Y as our guide - expect enormous amount of fear coming to the markets/news channels/politician speeches..
I am expecting 40-50% correction on this 10 Year treasury. Cash will flow into bonds and DXY should strengthen at the same time too :)
That being said, I expect this to unfold in first half of 2022. Multi-year and decade long views does not change - rates will climb much faster & higher.
We have nice place to enter the markets in the times of extreme fear.
Levels to watch: 1.52% & 0.90%
Take care! This is not a financial advice.

10 Year Rates: Daily and Weekly Perspective: Important JunctureA reminder that falling bond yields are synonymous with higher bond prices while rising bond yields are synonymous with lower bond prices. In other words, a yield downtrend is the same thing as a bull market in bonds.
Last week we published macro overviews of rates and equities that should be referred to for context.
1) A weekly close above the 1.77% would represent the first time since the February 2020 - 0.33% low print that rates will have managed to set higher highs. This would represent a significant change in the markets behavior.
2) The market is currently testing the confluence of resistance generated by the pivot high (1.77%), the top of the channel from the August 2021 low, and the roughly 50% retracement of the 3.25% to 0.33% decline. The confluence should provide signficant resistance.
3) Combined with the oversold condition of the RSI oscillator (remember that rising yields = lower prices, so a high oscillator reading is oversold) it is reasonable to monitor the daily and hourly charts for tradable reversal behaviors. We will cover some of these behaviors and patterns in future posts.
4) At the very least the resistance confluence should create a period of consolidation.
5) The caveat is that longs would not be in harmony with either the weekly and monthly charts, which appear to be setting up for an extended period of rising rates.
6) With both weekly and monthly charts appearing to be in the midst of a signficant change of trend, a break out wouldn't be particularly surprising.
7) At important junctures like this, I typically adapt an, "If this happens, then I do this" trading approach. After all, the market can only do one of a very few behaviors.
a. It can breakout and run. In which case finding a trade with solid risk reward becomes impossible. Move to a different market and find a trade.
b. It can breakout, move higher and then make a clear consolidation pattern (for instance a flag or a pennant). You can buy breakout with risk stops below the pattern.
c. It can upthrust the range (make a false breakout) and fail. This is by far my favorite trading pattern. We will cover it extensively in future posts.
What fundamental could produce a produce a reversal? Equity weakness that produces a flight to safety is the most likely candidate. But note that SPX saw a strong reversal yesterday and this mornings dip attracted buyers. But, again, refer to part two of the macro overview for context.
Good Trading:
Stewart Taylor, CMT
Chartered Market Technician
Shared content and posted charts are intended to be used for informational and educational purposes only. The CMT Association does not offer, and this information shall not be understood or construed as, financial advice or investment recommendations. The information provided is not a substitute for advice from an investment professional. The CMT Association does not accept liability for any financial loss or damage our audience may incur.

Government Bond Yield Surge - US2Y, US5Y, US10YThe crypto & stonk killer. Rates have been exceptionally low because of crisis. Look back to 2009. They went up in 2016 for a little bit while donnie complained. (he wanted that easy money because he tweeted about stonks his entire time in office). They drifted lower thereafter and then BAM! Another crisis the government had to print through. Where did all the PPP money go??? Kodak? DWAC? Nobody knows. Frauds abundant and the Fed will now run-off their near $9T balance sheet and start lifting rates. Plebs keep buying $SPY & Tesla calls or Simpcoins. #clueless
Should be an epic show.
*valuations matter
Rates will bust the Fed's 2% Long Term average goal with ease. Crypto kids will go broke and they should blame their doge daddy for pumping them for personal gain.
The "trillion" dollar companies will implode. Shibby Bitty too. All of it.
GL

Buckle up!Dear reader
How nice to see you again.
I have been busy with public and private clients since 2020, and although I continue to take a keen interest in markets and etc, I no longer have much time other than the (very) occasional consultancy for detailed writings. I am looking for a solution as even the weekends cannot tempt me back into regular updates!
There are a couple of trades though that I hear interesting things about - whether they will be suitable for your portfolios, I do not know, but they may be worth considering:
Stay Long USDJPY looking for 150, and Short Gold for 1510.
Full disclosure I am in full positions in both, Long USDJPY we have covered in great detail already, as with Gold . My in-depth knowledge of the commodity sector is decreasing now as I am further away from it, but from what I hear, these two are capable both medium and long term.
I hope this information might be useful to you. I would be grateful for anonymity as a source. Wish you all the best for Q1.
Thanks again!

21/12/14 - Gold offering a good long entryHey Trader,
please see my current idea on Gold where my count suggest an entry at around 1778 leading to a target of 1813.
Tomorrow evening we will have high volatility in the markets due to FED's rate decision. For those who decide to enter ahead to the FED meeting I suggest to play this trade with small size and tight stops, just in case this idea gets folded by fundamental impact.
This is no financial advice,
RT

EURNZD - another shortBased on the daily chart, the N100 stock index has grown today and the oil seems to be stabilizing preparing for growth.
Both of the two assets are anti-correlating to the EURNZD pair which I explained several times in both educational articles and pair-delegated ideas.
Furthermore, NZD did increase its interest rates. This would normally lead to NZD growth, hence EURNZD's drop.
However, the drop has not started yet and although it never has to, it just doesn't have to work like that single time, I do believe that the recent rally was driven by a lot of fear in the commodity markets as the following chart explains.
The commodity index CRB has just started dropping. Baltic Dry Index has been for some time, which is an average for shipping costs calculated every day.
I will be opening another short in this market at some point. I am waiting for price action now.

Bond to Bitcoin CorrelationHere is a brief correlation between bitcoin and bond price action. Hope you find this useful! I haven't been posting much due to what's going on in the economy. Switching up my approach. We all know when bonds rise, yields fall. When bonds fall, yields rise. Think about this when reading this chart. Good luck to the HODL!
Feel free to follow or simply keep up. I'm working on getting better always so bare with me. We all know what kind of journey this is!
Would love your support!


Long🟢Symmetric Triangle, Descending Wedge on BTCUSDT (Bullish)AI computes BTCUSDT is solid for a rally.
Price is in a falling wedge.
Falling wedge is a bullish pattern.
Wedge breakout will pump the price.
Heuristic pattern combination describes:
The wedge is in a Symmetric Triangle.
Wedge breakout triggers Triangle breakout.
Target would be ATH.

