LORD RAYDIUM - all bow to the god of lightning - BULL UPDATELORD RAYDIUM - all bow to the god of lightning - BULL UPDATE
well nailed this one. *takes a bow
anyone that listened got almost perfect entry instead of waiting on the sidelines each day for a pull back.
interestingly i reckon now is the last pull back before a short/medium term top.
not telling you where i got that fractal from either. what i can say is;
typical pumpinomics
lfg
the key guys is not the gains, but being able to sell. we gonna get that right together this round.
Raydium

Timing the Second Best Entry on $RAY - RAYDIUMNASDAQ:RAY has hit a nice level of resistance, so now I'm looking to anticipate a small retrace into the low EUROTLX:4S for a potential add/entry.
I still see NASDAQ:RAY moving much higher as $SOLANA isn’t done yet. The MEME frenzy will keep going, and this cycle is gearing up for a strong final leg, with potential for BTC to enter a multi-year cycle.

RAY / USDT - Looking for a trend up to $5Raydium swap will grow as Solana grows. I see ray outperforming Solana in the mid to longer term (Weekly). Volume will only increase.
In the shorter term (Daily) I'm expecting a continued trend up towards $5 and above. I have left the chart as simple as i could. This is one of my high conviction plays.
This is not FA. Only a idea. I'm using smaller time frames to enter. Invalidation would be a brake of trend.
If you have liked this chart please boost and leave a follow to be among my first 100 followers here on trading view.

RAYdium update well here we go again. going to start updating all my charts.
iam leaning towards bull bias here. if things start to sink im jumping ship, hopefully early.
well ,, lets see.
go to defi lama, look under SOL chain (clearly a popular chain with big VCs with huge stashes, ie they are gonna pump it and attempt to dump it on your ass) , now look which protocols/services have the most volume.
thats it. thats the thesis. check the % gains compared to its mother chian SOL. better.
this and ORCA (much lower rank but doing crazy volume) and JUP which is awesome to use, gets good results, good volume, etc
lfg. too bad i can't delete this if im wrong like last time (or was i just early? :P)
lfg

Raydium - Load The Truck Raydium.
Higher 24H Fees Generated Than ETH
800M Mcap, 1.6b FDV
Breakout against BTC..
Nobody uses Jupiter.. Raydium is where it's at..
Pump.Fun is the real catalyst for this bull run, and Raydium is the LP they've partnered with..
It's not just a DEX...Raydium grants you , with no experience, and no money.. the power to create your own currency celebrating your overweight cat.. and give people something to believe in.
But it also allows people to create communities around things that matter.. community is the new narrative. People believing in something is the spark of this new movement.
Doge was the first crypto example..
GME and AMC were the first trad fi examples ..
Then came the OG memes DOGE, SHIB...
The space grew to other chains..
PEPE.. BOME... WIF...
Then .. bang. Tweets are being tokenized. Videos are being tokenized..
The merge is happening, between media and money... And it's Raydium at the center of it
Raydium is the pick. Just buy it and don't think about it until end of 2025. Initial target, depth of the cup.. 700ish% against BTC (while btc is breaking out we're assuming).. so 20x in USD more or less.

#RAY/USDT#RAY
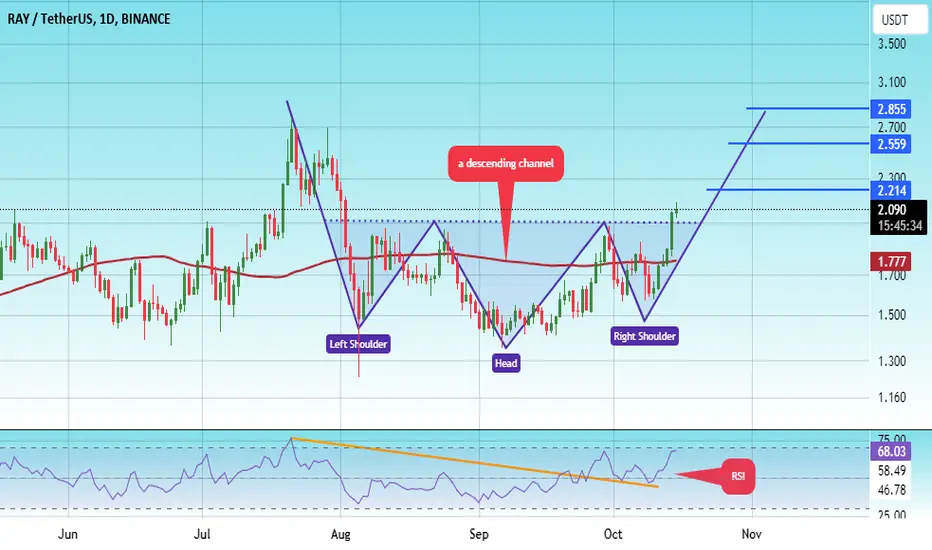
The price is moving in a descending channel on a 1-day frame
It is adhering to it well and has completed the right shoulder
We have a bounce from the lower limit of the descending channel and we are now touching this support at a price of 1.52
We have a downtrend on the RSI indicator that is about to be broken, which supports the rise
We have a trend to stabilize above the moving average 100
Entry price 2.05
First target 2.21
Second target 2.55
Third target 2.85
Billy/SOL - Raydium (Meme coin)TF: Daily
Price Action:
Currently the price is in a bearish trend on Daily tf, it has given signs on a lower tf for a pull back to start taking place. If the pullback takes place we can expect the price to reach above marked supply area and even swing highs. (in order for price to be bullish it needs to flip the swing high)
**Buying ranges are mentioned but there is a ton of liquidity below the range, price can come and take out liquidity before continuing the trend, take cautions.
Buying Ranges:
0.02435 – 0.01252
*NOT A FINANCIAL ADVICE – DYOR!*

PENG/SOL - Raydium (Meme coin)TF: Daily
Price Action:
Currently in a bearish trend.
Broke the previous daily structure, and price pulled back in to the current range supply zone which led the break of structure,
Key point: before running into the supply area, price took out the liquidity and then made an internal bos. Currently price is retesting its internal S/R flip zone, which also has a 0.5% of Fib, but as of yet no significant reaction found, if the price starts ranging at the current price levels, I’ll wait for the liquidity to be taken out first before entering a position, or I ‘ll wait for price to come in my demand zone.
Buying Ranges:
0.1403 – 0.1120
*NOT A FINANCIAL ADVICE – DYOR!*

USA/SOL - Raydium (Meme coin)TF: Daily
Price Action:
Broke the previous High
Taking a Pullback.
Buying Ranges:
0.000001002 – 0.000000204
*NOT A FINANCIAL ADVICE – DYOR!*

Mini/SOL - Raydium (Meme coin)TF: Daily
Price Action:
Liquidity already taken before making a BOS.
Break out and retesting of the structure.
S/R Flip.
Aligned with Golden pocket zone of the fib.
Buying Ranges:
0.04114 – 0.02882
*NOT A FINANCIAL ADVICE – DYOR!*

$GIGA: The Rise of the Giga Chad Meme Coin on SolanaIn the ever-evolving world of cryptocurrency, where memecoins often attract speculators and enthusiasts alike, BME:GIGA stands out as the new contender aiming for the top. Built on the Solana blockchain, BME:GIGA positions itself as more than just another memecoin. It's inspired by the Giga Chad meme—a symbol of self-improvement and discipline—and has garnered significant attention from the crypto community.
Whale Moves and the Growing Memecoin Market
The memecoin sector has recently seen explosive growth, with a 36% surge in market capitalization, rising from $41.49 billion to $56.46 billion in just 30 days. Memecoins such as DOGE, SHIB, and PEPE might not be regaining their earlier momentum, but new entrants like BME:GIGA , alongside GOAT and FWOG, are seizing the spotlight.
One of the most significant moments in BME:GIGA ’s recent history was a whale movement involving a $5.46 million investment in memecoins, including $GIGA. The whale allocated 11,750 SOL (around $1.96 million) to purchase 31.71 million GIGA tokens at an average price of $0.062. This move, noted by blockchain monitoring service Lookonchain, signals increasing confidence in BME:GIGA ’s potential.
The Giga Chad Movement
BME:GIGA isn't just about profits; it draws its philosophy from the Giga Chad meme, which emphasizes self-discipline, time management, and personal growth. This foundational ethos resonates within its community, where members strive to improve themselves and inspire others around them.
Beyond its meme origins, BME:GIGA has captured mainstream attention thanks to endorsements from notable figures like Ernest Khalimov, the face of the Giga Chad meme, and bodybuilder Mike O’Hearn. These endorsements have been particularly influential on social media, contributing to price spikes and further embedding BME:GIGA into the fitness and sports culture. The coin's association with Giga Fitness solidifies this unique blend of meme culture and fitness, making BME:GIGA stand out in a crowded marketplace.
Price Movement and Market Sentiment
As of now, BME:GIGA is trading at $0.0615, with a 24-hour volume of over $11 million, showing strong market interest. The memecoin has also climbed by 8.06% in the past 24 hours, pushing its market cap to $572 million, securing its position at #210 on CoinMarketCap.
Technical Analysis: Is There More Growth Ahead?
On the technical side, BME:GIGA is currently navigating a critical resistance level, struggling to break past the $0.077 pivot point. Despite this, the coin remains bullish with its Relative Strength Index (RSI) sitting at 63, suggesting more upside potential. However, to reach its next significant resistance level, a substantial influx of volume will be necessary.
Immediate support is found at $0.048, a level that has held strong during market pullbacks. With BME:GIGA trading above key moving averages, its recent bullish spark has been sustained. Should the broader memecoin market remain heated, BME:GIGA could see further gains in the short term.
Final Thoughts
While BME:GIGA ’s association with high-profile figures and its growing community make it an attractive investment in the short term, its long-term potential hinges on its ability to maintain momentum and evolve beyond its meme origins. Like most memecoins, BME:GIGA thrives on social media hype, and its continued success will depend on sustaining that buzz while delivering real-world value.
For traders, BME:GIGA offers an exciting opportunity, particularly for those who can navigate the volatility of the memecoin market. With technical indicators pointing towards a possible surge and growing whale interest, BME:GIGA could be primed for more upside in the coming weeks.

GME/USDT - MEXC- SOL - Raydium (Meme coin)TF: Daily
Price Action:
Break of structure – Can take a pull back to supply zones and EVEN TO SWING HIGHS (10x)
Internal Break of Stucture (Body to Body) – Price can come into buying ranges to grab Liquidity
Buying Ranges:
0.00287 - 0.0016
*NOT A FINANCIAL ADVICE – DYOR!*

Raydium ($RAY): The Future of DeFi on Solana Raydium ( NASDAQ:RAY ) is one of the most innovative decentralized finance (DeFi) protocols built on the Solana blockchain, with a clear first-mover advantage as an Automated Market Maker (AMM) within the Serum decentralized exchange (DEX) ecosystem. Its dual focus on providing liquidity via an orderbook model and expanding the Solana ecosystem makes it a key player in the DeFi world. With an ambitious roadmap and a growing user base, Raydium continues to capture attention.
Raydium Token Overview
Raydium ( NASDAQ:RAY ) is not just another AMM. What makes it unique is its integration with Serum, providing on-chain liquidity to a central limit orderbook. This allows Raydium liquidity providers (LPs) to access the entire order flow and liquidity available on Serum, making it a bridge between Solana and Serum and a pivotal part of the DeFi ecosystem.
The tokenomics of Raydium ( NASDAQ:RAY ) are well-structured to ensure long-term sustainability and growth. With a total of 550 million RAY tokens minted at genesis, they are distributed over a 3-year period as follows:
- 34% Airdropped to liquidity providers over 3 years
- 30% Reserved for partnerships and ecosystem expansion with 3-year lockups
- 20% Allocated to the team and future employees with a 1-year lockup and a 2-year vesting schedule
- 8% For liquidity provisioning
- 6% For seed funding and community pools
This structured distribution ensures there’s a strong incentive for liquidity providers and ecosystem participants to engage with the platform, while simultaneously locking up a significant portion of the supply to prevent inflationary pressure in the short term. The strategic release of tokens further strengthens its potential for price appreciation.
Current Market Performance
As of now, Raydium ( NASDAQ:RAY ) is trading on major centralized and decentralized exchanges such as OKX, Raydium’s own DEX, and XT.COM. The most active trading pair on OKX, RAY/USDT, saw a trading volume of $994,689 in the past 24 hours. This reflects a growing interest in the token despite recent market volatility.
- Current Price: While Raydium ( NASDAQ:RAY ) is down 89.03% from its all-time high of $16.83, recorded in September 2021, it is still 1,273.44% higher than its all-time low of $0.1344, recorded in December 2022. This showcases significant growth potential.
- Market Cap: Raydium’s market cap sits at $488.1 million, ranking it #148 as per data on CoinGecko. With 260 million NASDAQ:RAY tokens currently in circulation, the fully diluted valuation (FDV) is around $1.03 billion.
- Trading Volume: The trading volume of Raydium over the last 24 hours was $20.37 million, reflecting a 2.50% increase, which shows that market activity is heating up.
Technical Analysis
From a technical perspective, Raydium’s price chart reveals an optimistic outlook. Currently trading at a modest rise of 1.88%, NASDAQ:RAY appears to be gaining momentum.
1. RSI (Relative Strength Index): The RSI for RAY is currently at 59.90, indicating the token is on the brink of entering the overbought territory but still has room for growth. The RSI suggests strong upward momentum, often a precursor for price rallies.
2. Candlestick Pattern: On the daily price chart, RAY has formed a bullish symmetrical pattern, which is commonly seen as a harbinger of positive price action. Symmetrical triangles often lead to breakouts, and with the overall market sentiment favoring bullishness, NASDAQ:RAY looks poised for further upside.
3. Bullish Momentum: The price action indicates continued growth for Raydium, as the token consolidates near resistance levels. A breakout above these resistance levels could lead to a significant price surge, especially given the broader market trends and the growing adoption of Solana-based DeFi platforms.
Conclusion
Raydium ( NASDAQ:RAY ) presents a compelling opportunity in the DeFi space, backed by solid fundamentals and strong technical signals. As an integral part of the Solana and Serum ecosystems, Raydium ( NASDAQ:RAY ) is positioned to benefit from the growing interest in decentralized exchanges and liquidity provision. With a well-thought-out token distribution model, increasing market activity, and bullish technical indicators, Raydium ( NASDAQ:RAY ) is not only holding its ground but is likely to gain even more traction in the near future.
For both long-term investors and short-term traders, Raydium offers an appealing investment case, now could be a prime time to get involved. Keep an eye on the charts and watch for a potential breakout as the DeFi landscape continues to evolve and expand.

Catch the Wave: Why $RAY is Set to Soar!The price action of CRYPTOCAP:SOL indicates that it’s likely to take off.
Beta plays are the things to bet on once Solana starts moving. I’d look at coins like NASDAQ:RAY , LSE:JUP , and $JTO.
The weekly trend is confirmed, but it's lacking a bit of momentum for the monthly. I still think the bet is worth it here and on a retrace into the gray area on the chart—if it actually gives that retrace.
Overall, it’s a super constructive chart.

RAYUSDT 1H - up if it breaks the triangleRAYUSDT 1H - up if it breaks the triangle
It is forming a bullish channel that could push the price up to 1.86 without any major problem.
To validate this rise, it remains to be seen how the price evolves upwards.
This strategy can be executed with TradeX BoT when we finish developing it.
TradeX BoT (in development):
Tool to automate trading strategies designed in TradingView. It works with both indicators and graphic design tools: parallel channels, trend lines, supports, resistances... It allows you to easily establish SL (%), TP (%), SL Trailing... multiple strategies in different values, simultaneous BUY-SELL orders, conditional orders.
This tool is in the process of development and the BETA will soon be ready for testing.
FOLLOW ME and I will keep you informed of the progress we make.
I share with you my technical analysis assessments on certain stocks that I follow as part of the strategies I design for my portfolio, but I do not recommend anyone to operate based on these indications. Get informed, educate yourself and build your own strategies when it comes to investing. I only hope that my comments help you on your own path :)

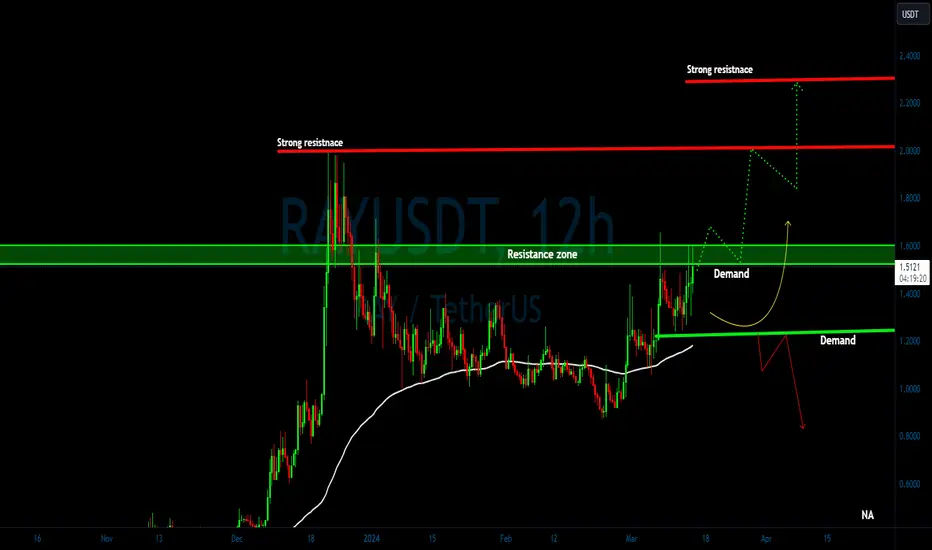
Is RAYUSDT Heading for a Major Downturn? Key Levels to Watch!Yello, Paradisers! Are we about to witness a significant downturn for #RAYUSDT? Let's break down the current situation.
💎#RAY has broken through the ascending channel support, signaling a potential shift towards bearish momentum. The price has recently dipped below key levels, hinting at a possible upward retest to the supply zone between $1.57 and $1.70 before continuing its downward trajectory.
💎The first target to watch is the strong support area. This zone is crucial for NASDAQ:RAY ; if the price breaks down below this level, we could see a significant downturn with the highest probability of reaching our final target in the demand area around $0.94.
💎However, If NASDAQ:RAY manages to reclaim the price above the ascending channel support and breaks the resistance at $1.96, this would invalidate the bearish momentum. In that case, the price could potentially continue its upward movement.
Stay sharp, traders, and keep these critical levels in mind as you navigate the market.
MyCryptoParadise
iFeel the success🌴

RaydiumRAY - Is a Solana DEX Play
Reason To Consider
1. DeFi maybe Blockchain top use case
2. High-Speed Transactions
3. Low Transaction Fees
4. Deep Liquidity
5. Staking Rewards
6. Cross-Chain Compatibility
7. User-Friendly Interface
8. Strong Community
9. Partnerships
10. Solid Governance
11. Growth Potential
I believe this token will perform very well for the rest of the Bull.
Easy 6X if RAY catches 50% of UNI or just returns to all time high.
TRADE SAFE

Raydium _ Next Target is Previous High, Make a +575% PROFITRaydium is going to break the 0.6 Fibonacci Retracement level. If the market close above the 0.6 Fibonacci Retracement level, then the market Approaching Previous High. So Previous High is the Next Target. And Offering the chance to make a +575% Percentage Profit.
Support me; I want to Help People Make PROFIT all over the "World".

RAY/USDT It required break the supply to continue upward!💎 Paradisers, #RAY is indeed showing promising movements that merit close observation.
💎 Currently, RAY is encountering a supply area ranging from 1.88 to 1.97. In the previous attempt to break above this supply zone, RAY experienced a fakeout, and the current price action suggests rejection from this supply area.
💎 Consequently, there's a likelihood that the price will retest the demand zone around 1.66 to generate new momentum for another attempt to break above the supply area.
💎 However, if RAY manages to break above the supply area without a retest, it could signal significant upward movement, potentially leading to the attainment of our target area.
💎 On the flip side, if RAY fails to bounce off the demand area and even breaks below it, the price may continue downward, revisiting the Bullish Order Block (OB) area. Historical data indicates that RAY has consistently bounced when reaching this zone, and a similar scenario might unfold if RAY revisits the OB+.
💎 It's crucial to monitor RAY's price action closely, particularly its ability to hold above key support and resistance levels. A breakdown below the demand zone, confirmed by a daily candle close below it, would suggest bearish momentum, potentially leading to further downward movement.
MyCryptoParadise
iFeel the success🌴

📈Navigating Market Restlessness: A Deep Dive into Ray Token 💵🔍Since the previous analysis, the market has exhibited a sideways movement, indicating a period of consolidation. Amidst this, the spotlight falls on Ray Token (RAY), a project garnering attention for its innovative approach within the decentralized exchange (DEX) space, operating on the Solana blockchain.
🔄In the 4-hour timeframe, we find ourselves within a range-bound scenario, with the box's ceiling at 1.7863 and the floor at 1.3569. While navigating within this range, short-term and scalp positions are viable options. However, it's essential to remain cautious, particularly on Sundays, as market volatility tends to be subdued due to reduced participation from major traders. Consequently, risk management becomes paramount to mitigate potential losses during erratic market movements.
📉The primary trigger for short positions lies at 1.3569, with the potential activation of a double bottom pattern upon breaching this short-term support. However, given the subdued market conditions, exercising patience until confirmation of a sustained break below this level is advisable. Conversely, long positions should be approached cautiously, with the primary trigger set at 1.7863, considering the significant resistance at 1.8818. Exploring alternative coins exhibiting relative strength against Bitcoin while lacking extensive overhead resistance may present more favorable long opportunities.
📈For RAY token specifically, a critical level to monitor is 2.4575, beyond which a potential bullish momentum could ensue, particularly in higher timeframes such as daily or weekly. Hence, positioning for long trades post-breakout beyond this level could yield favorable results.
📊Volume analysis indicates a diminishing volume within the box, signaling an imminent sharp movement. Therefore, staying vigilant and capitalizing on sharp price movements is advisable to maximize trading opportunities.
💎Regarding RSI triggers, oversold conditions below 42.68 could signal potential short opportunities, while overbought conditions provide favorable entry points for long positions. However, it's crucial to exercise discretion and wait for confirmation from price action, particularly in scenarios where RSI enters oversold territory, indicating a possible trend reversal.
📝In conclusion, despite the market's current state of restlessness, opportunities abound for astute traders. By employing a judicious approach, leveraging critical triggers, and remaining adaptable to evolving market conditions, traders can navigate the intricacies of the market landscape effectively, maximizing profit potential while minimizing risks.

RAY/USDT In the crucial support, need bouncing for back upward!💎 Paradisers, #RAY has recently experienced notable market dynamics. Demonstrating a bounce from the support area, RAY has consistently shown resilience at this level, indicating strong support.
💎 There is potential for the price to continue bouncing as observed in historical patterns and retest the strong resistance area.
💎 However, if #RAY breaks below the support area, this could signal a bearish development. In such a scenario, the price may continue its downward trajectory toward the demand area, ranging between $1.6 to $1.3.
💎 It's crucial for price action to confirm a bounce at the demand area and reclaim the price above the support level. Failure to do so could result in further downward movement for #RAY.

RAY looking very bullishRAY .... update if you had a stop loss ( not recommended ) you would have lost -8%
if you are also doing the "No Lose / Only Win" method ... then you would want to add to the trade
if you did get stopped out ... here is another setup
the group will be updated on other charts soon
enter at current price
Market Cap 587M
DeFi / DEX
Stop Loss 1.8384
Targets 2.9990 / 3.5854
Raydium ( RAY ) is one of the main DEXs on Solana
( the other is Jupiter JUP )
Not Financial Advice

RAY/USDT assessing key resistance ? 👀 🚀RAY Today Analysis💎Paradisers, your focused attention is warranted as #RAYUSDT exhibits notable action around the crucial resistance level of $1.5001. A breakthrough and sustained momentum above this mark could herald a significant bullish journey towards tackling the next tier of resistance.
💎Navigating #RAY's Momentum: As #RAY vies to uphold its drive from its current support, strategic acumen becomes imperative. We're poised to recalibrate our approach in harmony with the dominant market sentiment. A bullish resurgence is anticipated from the support at $1.2373, emphasizing the necessity for agility and responsiveness in our trading maneuvers.
💎Market Dynamics and Strategy Adjustments: The unpredictability of the market calls for vigilance, especially if #RAY dips below the pivotal support of $1.2373. Such a move would suggest the bears are in control, steering us towards a bearish phase. Such indicators are critical for timely strategic adjustments, signaling a pivotal moment for market reevaluation.
💎Strategic Vigilance and Support: Amidst market volatility, a diligent watch on essential signals and readiness to adapt strategies is essential. Your prowess in modifying your approach in response to shifting market sentiments is invaluable for adeptly navigating the crypto market's uncertainties. Rest assured, the Paradise Team remains at your side, providing guidance and insights to foster informed decision-making in this dynamic trading landscape.