RAY Long Position (Breakout Retest) Market Context: RAY has broken through its daily resistance and is currently retesting the breakout level, presenting a prime opportunity to enter a long spot position.
Trade Setup:
Entry: Around $1.98
Take Profit:
First target: $2.30
Second target: $2.60
Stop Loss: Just below $1.70
This setup leverages the breakout retest, offering a solid entry with clear risk management. #RAY #Crypto #Breakout
Rayusdt

RAY is going to close this month bullishHello, as we took beautiful trade with RAY - 80% profit, some of you 130% profit with RAY in one trade recently... there can be continuation... Monthly engulfing green candle means that RAY is strong at the moment... at least 0.35 usdt region should be visited again in February. With power there can be another 100%+ rally. Volume was really huge at the bottom so it looks like whales are in with loaded bags... let's se. BUT MANAGE YOUR RISK AND USE STOPLOSS!
Have a great day!

Catch the Wave: Why $RAY is Set to Soar!The price action of CRYPTOCAP:SOL indicates that it’s likely to take off.
Beta plays are the things to bet on once Solana starts moving. I’d look at coins like NASDAQ:RAY , LSE:JUP , and $JTO.
The weekly trend is confirmed, but it's lacking a bit of momentum for the monthly. I still think the bet is worth it here and on a retrace into the gray area on the chart—if it actually gives that retrace.
Overall, it’s a super constructive chart.

RAYUSDT 1H - up if it breaks the triangleRAYUSDT 1H - up if it breaks the triangle
It is forming a bullish channel that could push the price up to 1.86 without any major problem.
To validate this rise, it remains to be seen how the price evolves upwards.
This strategy can be executed with TradeX BoT when we finish developing it.
TradeX BoT (in development):
Tool to automate trading strategies designed in TradingView. It works with both indicators and graphic design tools: parallel channels, trend lines, supports, resistances... It allows you to easily establish SL (%), TP (%), SL Trailing... multiple strategies in different values, simultaneous BUY-SELL orders, conditional orders.
This tool is in the process of development and the BETA will soon be ready for testing.
FOLLOW ME and I will keep you informed of the progress we make.
I share with you my technical analysis assessments on certain stocks that I follow as part of the strategies I design for my portfolio, but I do not recommend anyone to operate based on these indications. Get informed, educate yourself and build your own strategies when it comes to investing. I only hope that my comments help you on your own path :)

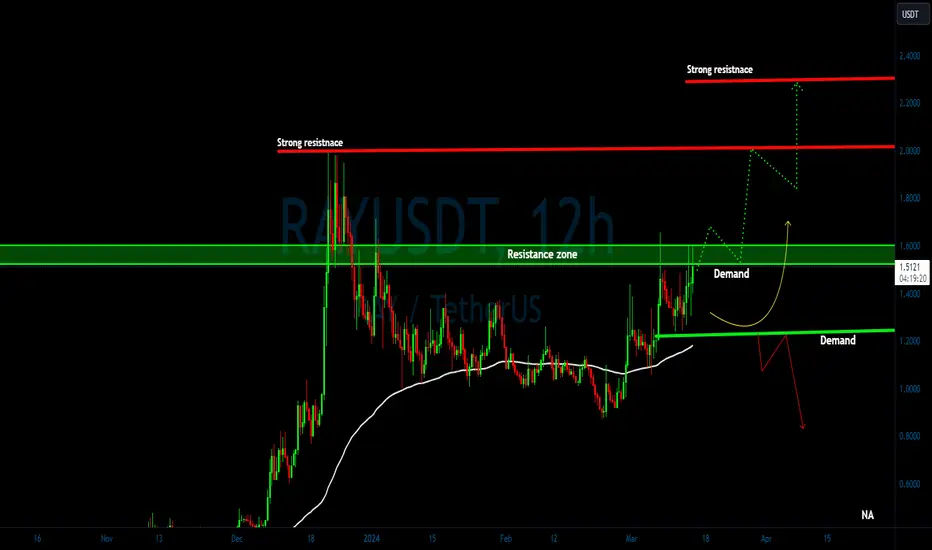
Is RAYUSDT Heading for a Major Downturn? Key Levels to Watch!Yello, Paradisers! Are we about to witness a significant downturn for #RAYUSDT? Let's break down the current situation.
💎#RAY has broken through the ascending channel support, signaling a potential shift towards bearish momentum. The price has recently dipped below key levels, hinting at a possible upward retest to the supply zone between $1.57 and $1.70 before continuing its downward trajectory.
💎The first target to watch is the strong support area. This zone is crucial for NASDAQ:RAY ; if the price breaks down below this level, we could see a significant downturn with the highest probability of reaching our final target in the demand area around $0.94.
💎However, If NASDAQ:RAY manages to reclaim the price above the ascending channel support and breaks the resistance at $1.96, this would invalidate the bearish momentum. In that case, the price could potentially continue its upward movement.
Stay sharp, traders, and keep these critical levels in mind as you navigate the market.
MyCryptoParadise
iFeel the success🌴

RAY/USDTToday’s growth is strong, which means there is volume, and the local trend is holding. Most importantly, everything is going through accumulation. I’m expecting a retest and further growth.

RaydiumRAY - Is a Solana DEX Play
Reason To Consider
1. DeFi maybe Blockchain top use case
2. High-Speed Transactions
3. Low Transaction Fees
4. Deep Liquidity
5. Staking Rewards
6. Cross-Chain Compatibility
7. User-Friendly Interface
8. Strong Community
9. Partnerships
10. Solid Governance
11. Growth Potential
I believe this token will perform very well for the rest of the Bull.
Easy 6X if RAY catches 50% of UNI or just returns to all time high.
TRADE SAFE

RAY/USDT It required break the supply to continue upward!💎 Paradisers, #RAY is indeed showing promising movements that merit close observation.
💎 Currently, RAY is encountering a supply area ranging from 1.88 to 1.97. In the previous attempt to break above this supply zone, RAY experienced a fakeout, and the current price action suggests rejection from this supply area.
💎 Consequently, there's a likelihood that the price will retest the demand zone around 1.66 to generate new momentum for another attempt to break above the supply area.
💎 However, if RAY manages to break above the supply area without a retest, it could signal significant upward movement, potentially leading to the attainment of our target area.
💎 On the flip side, if RAY fails to bounce off the demand area and even breaks below it, the price may continue downward, revisiting the Bullish Order Block (OB) area. Historical data indicates that RAY has consistently bounced when reaching this zone, and a similar scenario might unfold if RAY revisits the OB+.
💎 It's crucial to monitor RAY's price action closely, particularly its ability to hold above key support and resistance levels. A breakdown below the demand zone, confirmed by a daily candle close below it, would suggest bearish momentum, potentially leading to further downward movement.
MyCryptoParadise
iFeel the success🌴

📈Navigating Market Restlessness: A Deep Dive into Ray Token 💵🔍Since the previous analysis, the market has exhibited a sideways movement, indicating a period of consolidation. Amidst this, the spotlight falls on Ray Token (RAY), a project garnering attention for its innovative approach within the decentralized exchange (DEX) space, operating on the Solana blockchain.
🔄In the 4-hour timeframe, we find ourselves within a range-bound scenario, with the box's ceiling at 1.7863 and the floor at 1.3569. While navigating within this range, short-term and scalp positions are viable options. However, it's essential to remain cautious, particularly on Sundays, as market volatility tends to be subdued due to reduced participation from major traders. Consequently, risk management becomes paramount to mitigate potential losses during erratic market movements.
📉The primary trigger for short positions lies at 1.3569, with the potential activation of a double bottom pattern upon breaching this short-term support. However, given the subdued market conditions, exercising patience until confirmation of a sustained break below this level is advisable. Conversely, long positions should be approached cautiously, with the primary trigger set at 1.7863, considering the significant resistance at 1.8818. Exploring alternative coins exhibiting relative strength against Bitcoin while lacking extensive overhead resistance may present more favorable long opportunities.
📈For RAY token specifically, a critical level to monitor is 2.4575, beyond which a potential bullish momentum could ensue, particularly in higher timeframes such as daily or weekly. Hence, positioning for long trades post-breakout beyond this level could yield favorable results.
📊Volume analysis indicates a diminishing volume within the box, signaling an imminent sharp movement. Therefore, staying vigilant and capitalizing on sharp price movements is advisable to maximize trading opportunities.
💎Regarding RSI triggers, oversold conditions below 42.68 could signal potential short opportunities, while overbought conditions provide favorable entry points for long positions. However, it's crucial to exercise discretion and wait for confirmation from price action, particularly in scenarios where RSI enters oversold territory, indicating a possible trend reversal.
📝In conclusion, despite the market's current state of restlessness, opportunities abound for astute traders. By employing a judicious approach, leveraging critical triggers, and remaining adaptable to evolving market conditions, traders can navigate the intricacies of the market landscape effectively, maximizing profit potential while minimizing risks.

RAY/USDT In the crucial support, need bouncing for back upward!💎 Paradisers, #RAY has recently experienced notable market dynamics. Demonstrating a bounce from the support area, RAY has consistently shown resilience at this level, indicating strong support.
💎 There is potential for the price to continue bouncing as observed in historical patterns and retest the strong resistance area.
💎 However, if #RAY breaks below the support area, this could signal a bearish development. In such a scenario, the price may continue its downward trajectory toward the demand area, ranging between $1.6 to $1.3.
💎 It's crucial for price action to confirm a bounce at the demand area and reclaim the price above the support level. Failure to do so could result in further downward movement for #RAY.

RAY/USDT assessing key resistance ? 👀 🚀RAY Today Analysis💎Paradisers, your focused attention is warranted as #RAYUSDT exhibits notable action around the crucial resistance level of $1.5001. A breakthrough and sustained momentum above this mark could herald a significant bullish journey towards tackling the next tier of resistance.
💎Navigating #RAY's Momentum: As #RAY vies to uphold its drive from its current support, strategic acumen becomes imperative. We're poised to recalibrate our approach in harmony with the dominant market sentiment. A bullish resurgence is anticipated from the support at $1.2373, emphasizing the necessity for agility and responsiveness in our trading maneuvers.
💎Market Dynamics and Strategy Adjustments: The unpredictability of the market calls for vigilance, especially if #RAY dips below the pivotal support of $1.2373. Such a move would suggest the bears are in control, steering us towards a bearish phase. Such indicators are critical for timely strategic adjustments, signaling a pivotal moment for market reevaluation.
💎Strategic Vigilance and Support: Amidst market volatility, a diligent watch on essential signals and readiness to adapt strategies is essential. Your prowess in modifying your approach in response to shifting market sentiments is invaluable for adeptly navigating the crypto market's uncertainties. Rest assured, the Paradise Team remains at your side, providing guidance and insights to foster informed decision-making in this dynamic trading landscape.
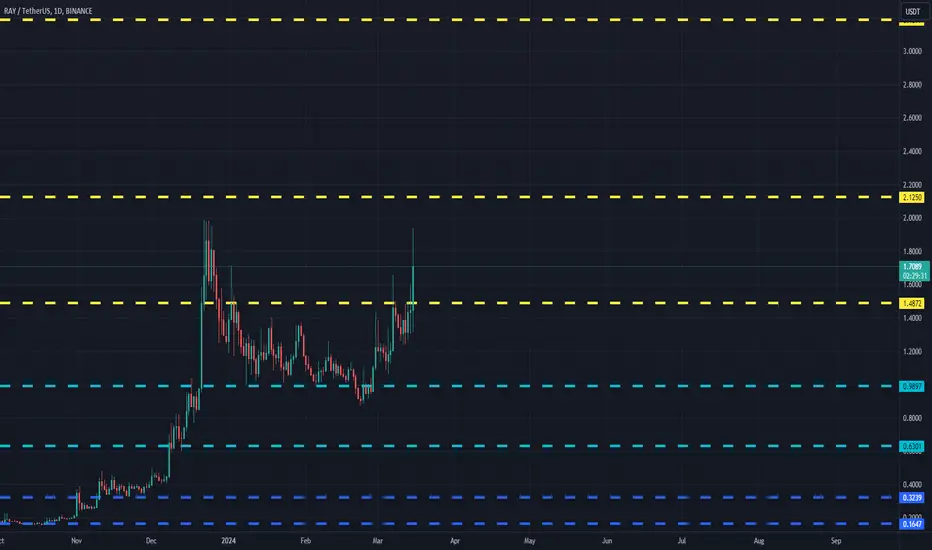
RAYUSDT (Raydium) Daily tf Range Updated till 15-03-24RAYUSDT (Raydium) Daily timeframe range. if we zoomout and look closely this thing got lots of room for to surf. but the question is in what duration. for now 2.1250 yet to reach but staying above 1.4872 will make sure of it.
RAY charles smooth - f you SBFRAY charles smooth - f you SBF
update
look sometimes i like to draw parallel channels. they tend to work for shitcoins if you get the right angle.
i hope sbf is watching ray pump like a mofo from prison and feeling some of the best fomo possible.
SOL go up? then RAY and ORCA probs go up more. ive been saying this on twitter from SOL $20. the thesis remains.
lfg

🚨#RAY/USDT Long#RAY
On the 4-hour frame, we have a bearish channel that the price is trading within, and we are about to break it
We have strong upward momentum that the price is expected to continue rising
The market during this period is expected to push many alternative currencies upward
Entry price is 1.18
The first goal is 1.28
Second goal 1.43
The third goal is 1.65

RAYUSDT.1DBased on the provided market data, the RAY/USDT pair is currently trading at 1.229 USDT. The RSI for 4 hours, 1 day, and 7 days are 61.23, 66.15, and 64.60 respectively, indicating a somewhat overbought condition which could suggest a potential price correction.
The MACD for 4 hours, 1 day, and 7 days are 0.076, 0.0040, and 0.22 respectively, indicating bullish momentum in the short term. The Bollinger Bands (BB) for 4 hours, 1 day, and 7 days are at 1.40, 1.40, and 1.70 respectively, which shows that the price is not currently volatile.
In terms of support and resistance levels, on the 4-hour chart, the support levels are at 1.13, 0.97, and 0.85, while the resistance levels are at 1.45, 1.50, and 1.60. On the daily chart, the support levels are at 1.041, 0.88, and 0.76, and the resistance levels are at 1.42, 1.53, and 1.65. Lastly, on the 7-day chart, the support levels are at 0.85, 0.41, and 0.14, while the resistance levels are at 1.42, 2.031, and 2.27.
In conclusion, the pair is currently in a bullish momentum but is also somewhat overbought. There could be a potential price correction in the short term. However, if the price manages to break the resistance level at 1.45 on the 4-hour chart, we could see further upward movement. As always, it's important to combine this technical analysis with other market indicators and news before making any trading decisions.

RAY / RAYUSDTGood Luck >>
• Warning •
Any deal I share does not mean that I am forcing you to enter into it, you enter in with your full risk, because I'll not gain any profits with you in the end.
The risk management of the position must comply with the stop loss.
(I am not sharing financial or investment advice, you should do your own research for your money.)

RAYUSDTRAYUSDT is trading in falling wedge pattern. The price was reacting well the support and resistance of wedge.
Currently the price has given the massive breakout from falling wedge and after successful retest of the level will be bullish signal and seems like the price may go for another leg higher.
If the breakout sustain to upside the optimum target could be 2
What you guys think of this idea

Lord Raydium ,,, fatalitythe lord of lightning is powering up to throw his zippy zappy hat at your ass..
fatality

RAYUSDT Bullish Momentum 1H TF (1H Divergence)RAYUSDT is showing bullish momentum in 1H time frame. There is 1H divergence that shows price might be in reversal.
Trade Plan
Entry @ Buy Stop
SL @ Lower Low
TP1 and TP2 @ 1:1 and 1:2 risk and reward.

RAYUSDT(Raydium) Daily tf Range Updated till 20-01-24RAYUSDT(Raydium) Daily timeframe range. trying to hold on to 1.1445 if it fails than good chance to back to 0.5930. if 1.1445 can hold than retrace back is possible.

RAY sell/short setupHigh liquidity pools are expected to accumulate and move from the specified SUPPLY to lower targets.
The structure is not falling in the swing degree, but it is falling in the substructure degree.
Closing a daily candle above the red range will violate the analysis
For risk management, please don't forget stop loss and capital management
When we reach the first target, save some profit and then change the stop to entry
Comment if you have any questions
Thank You

RAY/USDT Ready for an Exponential Bull Rally? 👀🚀 RAY analysis💎 Paradisers, direct your attention to #RAYUSDT, as it's currently showing signs of a potential major move from an important demand level.
💎 #Raydium is charting an upward path, indicating a likely bullish breakout from its current demand zone. There's an anticipation that it will retest the demand level at $1.01 before embarking on further upward momentum. If #RAY manages to stay above this level, it sets the stage for a potential rise towards the key supply zone at $2.05.
💎 However, if #RAY encounters difficulties in sustaining above the $1.01 level, it may be time to reassess our trading approach. In this event, we would consider shifting our focus to initiating a bullish move from a lower bullish Order Block (OB) level at $0.72.
💎 Monitoring this level is critical, as a decline below it could indicate the start of a significant bearish trend.
💎 Stay vigilant and ready to adapt, Paradisers. Your ParadiseTeam is committed to providing you with the most current insights and strategic advice, ensuring you're fully equipped to handle these market dynamics effectively.

Raydium DCA RAY/USDT
What is Raydium?
Raydium is an automated market maker (AMM) and liquidity provider built on the Solana blockchain for the Serum decentralized exchange (DEX). Unlike any other AMMs, Raydium provides on-chain liquidity to a central limit orderbook meaning that funds deposited into Raydium are converted into limit orders which sit on Serum’s orderbooks.
.....................................................................................................................
We are not registered or licensed in any jurisdiction whatsoever to provide investing advice or anything of an advisory or consultancy nature.
and are therefore are unqualified to give investment recommendations.
Always do your own research and consult with a licensed investment professional before investing.
This communication is never to be used as the basis of making investment decisions, and it is for entertainment purposes only.
