Realestate
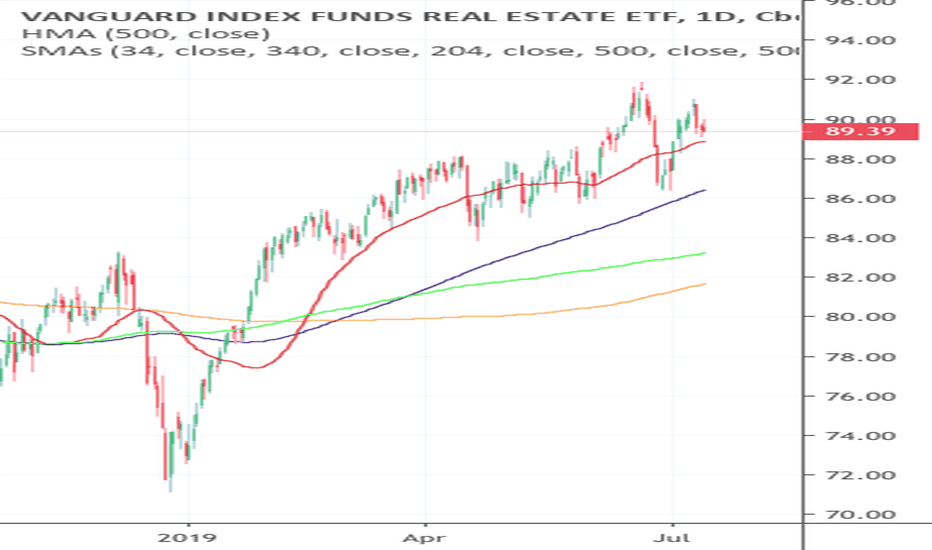
EPISODE 9/11: US REAL ESTATE:WAVE VARIATIONS& INDICATOR TA(XLRE)Episode 9/11 : US (SPX) Sectors Technical Analysis Series - 31st of July 2019
Brief Explanation of the chart ( since everything is labelled on the chart ): (1 minute read)
First and foremost : The XLRE Index was formed very recently(2016), so obviously due to the lack of data this analysis should be seen at most as informative . Now, let's break down the chart :
Weekly XLRE chart labelled with 2 large structural supports as blue( 30$ ) & purple( 34-35$ ) rectangles. Furthermore, the wave/cycle variation can be broken down to 3 most probably variations :
Variation #1 ( Purple ): If the economy continues to be in a great state. US-China deal goes through and Trump wins 2020. Most bullish Scenario.
Variation #2 ( RED ): Trump wins 2020, but the global economy slows down/Deal takes too long to be completed. Still a bullish scenario either way.
Variation #3 ( Blue ): Bearish scenario . Dems win 2020, in which case we will have a recession in the nearby future, thereafter.
This is it. I do not think there's anything more to be said. I always let my charts speak the words that I am not willing to put the effort to say/write.
This is just a brief "free" and very detailed analysis. Perhaps in the future I might form a premium group, to whose members I will provide all the details of my research.
>>I do not share my ideas for the likes or the views. This channel is only dedicated to well informed research and other noteworthy and interesting market stories.>>
However, if you'd like to support me and get informed in the greatest of details, every thumbs up or follow is greatly appreciated !
Step_Ahead_ofthemarket-
Check my Previous episodes on the US Sectors :
EPISODE 8 : US CONSUMER STAPLES (XLP)
EPISODE 7 : US CONSUMER DISCRETIONARY ( XLY )
Full Disclosure: This is just an opinion, you decide what to do with your own money. For any further references- contact me.


